
Forex analysis review |
- CAD/JPY facing bearish pressure from resistance, potential for further drop
- Forecast for EUR/USD on May 21, 2020
- Forecast for AUD/USD on May 21, 2020
- Forecast for USD/JPY on May 21, 2020
- Hot forecast and intraday trading signals for the GBP/USD pair on May 21. COT report. Bears urgently need to return to the
- Hot forecast and intraday trading signals for the EUR/USD pair on May 21. COT report. Dollar buyers need to stay below 1.0990-1.1008
- Overview of the GBP/USD pair. May 21. The British government has announced a new tariff policy that will be in effect after
- Overview of the EUR/USD pair. May 21. Donald Trump's unsubstantiated accusations against Barack Obama and Joe Biden did not
- EUR/USD and GBP/USD. Andrew Bailey's speech unlikely to stir markets. UK, EU Inflation were ignored
- Risk over the pound's decline is still there, but there is a chance of growth to $1.35 in the long run
- EUR/USD. The struggle for the 10th figure: fate of the upward trend in the hands of the "Union of Opposition"
- May 20, 2020 : EUR/USD Intraday technical analysis and trade recommendations.
- May 20, 2020 : GBP/USD Intraday technical analysis and trade recommendations.
- Waiting for statistics: calm before the storm in the oil market
- Evening review on EUR/USD for May 20, 2020
- EURUSD shows short-term signs of strength entering the Ichimoku cloud.
- Short-term Ichimoku cloud indicator analysis of Gold for May 20, 2020
- The stock market at a crossroads
- Gold maintains an upward trend
- EURUSD and GBPUSD: All EU countries can join the economic recovery fund. The pound declined on inflation data, but the speech
- BTC analysis for May 20, 2020 - Watch for the breakout fo the upward channel and symmetrical triangle to confirm downside
- GBP/USD: plan for the American session on May 20 (analysis of morning deals). The inflation data only partially soured the
- GBP/USD analysis for May 20, 2020 - The rally started and I see further upside towards the level of 1.2325
- EUR/USD: plan for the American session on May 20 (analysis of morning deals). Euro buyers are slowly approaching the resistance
- Trading recommendations for the EUR/USD pair on May 20, 2020
| CAD/JPY facing bearish pressure from resistance, potential for further drop Posted: 20 May 2020 08:08 PM PDT
Trading Recommendation Entry: 77.860 Reason for Entry: horizontal swing high resistance and 100% fibonacci extension Take Profit: 76.383 Reason for Take Profit: horizontal overlap support, 50% fibonacci retracement Stop Loss: 78.499 Reason for Stop loss: Horizontal swing high resistance The material has been provided by InstaForex Company - www.instaforex.com |
| Forecast for EUR/USD on May 21, 2020 Posted: 20 May 2020 08:05 PM PDT EUR/USD Yesterday, the euro continued to work out positive economic statistics; on Tuesday it was the release of a strong eurozone business sentiment index for May from the ZEW institute - an increase from 25.2 to 46.0, on Wednesday the consumer confidence index also showed an increase from -23 to -19 in May. The eurozone balance of payments also came out yesterday, but in March, so the indicator worsened: 27.4 billion euros against 37.8 billion in February. Today, US statistical services have to answer Europe. The Ministry of Labor will publish a weekly report on applications for unemployment benefits - a forecast of 2,400 million against 2,981 million a week earlier. The Philadelphia Manufacturing PMI is expected to improve from -56.6 to -40.0 in May, Manufacturing PMI is projected to grow slightly to 39.3 from 36.1, Services PMI is expected to reach 32.6 points from 26.7 in last month. We believe that all data will come out better than forecasts, regardless of whether this is true or not. We saw a similar picture in 2011 and 2014 during periods of tough confrontation between the US and the eurozone, when US statistics were subsequently revised to deteriorate. The euro worked out the upper limit of the trading range with a false on the daily chart, as it now seems, exit over the MACD indicator line and the embedded price channel line. Similar turns of the euro occurred on May 4 and March 30, these points are marked by sand-colored ovals. The Marlin oscillator begins to turn down. A divergence has formed on the four-hour chart on Marlin - a reversal pattern. Overcoming the price of the signal level of 1.0914 will correspond to the price falling below the line of the price channel on the daily chart. The 1.0888 level corresponds to the support of the MACD line on the daily chart, but then we see a coincidence with the expected support of the MACD line on a four-hour scope - the line tends to this level and can meet the price on it. Leaving the price below 1.0888 will return the market in anticipation of a medium-term decline. The material has been provided by InstaForex Company - www.instaforex.com |
| Forecast for AUD/USD on May 21, 2020 Posted: 20 May 2020 08:02 PM PDT AUD/USD The Australian dollar grew by 60 points on Wednesday, and it almost returned to yesterday's opening today in the Asian session. This is a sign that the price will not reach the target level of 0.6677, the aussie aimed to overcome the price channel line in the region of 0.6492, which will be a good reason for continuing the fall to 0.6338. A slightly veiled double divergence is formed on the Marlin oscillator. The price returned to the signal level of 0.6562 on the four-hour chart - yesterday's exit above it turned out to be false. The MACD indicator line is located at the 0.6492 level taken from the daily time, which strengthens this level. Accordingly, overcoming it will become a significant condition for opening short positions with a target above 0.6338. |
| Forecast for USD/JPY on May 21, 2020 Posted: 20 May 2020 08:02 PM PDT USD/JPY The USD/JPY pair traded in the range of 65 points yesterday, but the body of the candle remained in the space between the downward line of the price channel and the red balance indicator line. This means consolidating the price over the MACD line (blue) and the line of the price channel itself. The Marlin oscillator is growing in the zone of positive values. Now the price should move above the balance line, and it can confidently continue to rise to the goals of 108.30 and 109.50. The downward trend will recover if the price goes below the MACD line, around 107.20. But this is now an alternative scenario. The price is supported by the indicator lines of balance and MACD on the four-hour chart. The signal line of the Marlin oscillator is unfolding from the border with the bears''territory. The price needs to leave the area above the signal level of 107.78 in order to continue growth to the nearest target of 108.30. The material has been provided by InstaForex Company - www.instaforex.com |
| Posted: 20 May 2020 06:05 PM PDT GBP/USD 1H Lateral movement was observed on the hourly chart for the pound/dollar pair on May 20. Quotes of the pair left the downward channel, although yesterday there were hopes that they would remain within it. At the same time, traders managed to overcome the resistance area of 1.2196-1.2215. Thus, at the moment, it is more preferable to continue the upward movement. However, we believe that it will be difficult for traders to go above the Senkou Span B line and before overcoming this line, we advise you not to buy the British pound, since so far everything is very similar to a protracted correction in a downward trend. If this hypothesis is confirmed, the pair will turn down and consolidate below the Kijun-sen line and the 1.2196-1.2215 area, which will enable us to conclude that the downward trend will resume. GBP/USD 15M The higher linear regression channel shows a continuing upward trend on the 15-minute timeframe. But the lower channel signals a turn down. Thus, our concerns about a possible downward movement based on an analysis of the hourly timeframe are not in vain. On the lowest timeframe, there is also reason to assume the end of the British currency's growth. COT report The latest COT report for May 12 shows that the total number of buy and sell transactions among large traders per week increased by 4,000, mainly due to purchases. However, the total number of transactions for the purchase is only 16,000 more than transactions for selling. Such an imbalance persists for a long period of time, and it was not enough for the pair to begin forming an upward trend. In the reporting week, professional traders opened more new deals for sale (4539), which means that most of them are waiting for the British currency to fall again. The fundamental background for the British pound remains sharply negative. Despite the fact that the macroeconomic background is equally disappointing both in the United States and Great Britain, we believe that the UK economy is experiencing and will face much more serious problems than the US economy, despite the fact that the latter has serious problems due to the highest unemployment. The business activity indices that will be published today in the US and Britain are unlikely to attract the attention of market participants. Jerome Powell's speech in the evening can affect the course of trading. And even then, only if the Federal Reserve chief, who has recently been giving interviews almost daily, reports really new and interesting information. We have two main options for the development of the event on May 21: 1) The initiative for the pound/dollar pair remains in the hands of the bears, despite the fact that the quotes have come out of the downward channel. Thus, we recommend buying the British pound no earlier than consolidating the price above the Senkou Span B line - 1.2323 and the resistance level of 1.2325 with the first target as the resistance area of 1.2404-1.2422. The next goal, in case of overcoming the area, will be the resistance level of 1.2550. Take profit will be about 75 points in the first case and 120 points in the second. 2) Sellers currently have greater chances to implement their trading ideas. It will be enough to return the price to the area below the Kijun-sen line and the 1.2196-1.2215 area in order to resume selling the pair while aiming for the May 18 low, 1.2073 and the support level of 1.1987. In this case, take profit will be about 105 and 190 points. The material has been provided by InstaForex Company - www.instaforex.com |
| Posted: 20 May 2020 06:05 PM PDT EUR/USD 1H Quotes of the EUR/USD pair resumed the upward movement and overcame a new downward trend on the hourly timeframe over the past day, built at the highs of March 27 and May 1. In addition, the quotes of the pair ideally worked out the April 19 high at 1.0990, which is also the upper boundary of the side channel of 1.0750-1.0990, in which the pair has been trading in recent weeks. Thus, from current positions, a downward movement can begin with targets near the lower boundary of the channel, near the 1.0750 level. However, the key condition for executing this option is to not overcome the area of 1.0990-1.1008. If traders succeed in pushing this area, then the pair will be able to move to form a new upward trend with targets near the March 27 high at 1.1147. EUR/USD 15M We see a confident upward trend that continues on the 15-minute timeframe, judging by the two channels of linear regression. The lowest linear regression channel made an attempt to turn down yesterday, but the bulls today began to attack with renewed vigor and held the initiative in their hands. Turning the lower channel down will indicate the end of the upward trend in the short term, we also continue to monitor the pair's behavior near the area of 1.0990-1.1008. COT report The latest COT report dated May 12 showed a new decrease in the number of buy and sell transactions among large traders, by 4,781 and by 3,554. Thus, the general mood of large traders remains bullish (the total number of purchase transactions is higher, 549,000-521,000), in addition to this, traders still managed to stay above the trend line on the 4-hour timeframe. Also, purchase positions increased among entities engaged in professional activities in the foreign exchange market (+4569 purchase transactions). Thus, the euro can continue to grow for some time, which we see this week. As for the fundamental background, it is almost neutral for the pair. There is still a lot of news coming from both the European Union and the United States. Many of them are of great importance for the future of both countries, for their economies. However, traders continue to ignore current macroeconomic reports; therefore, the mood of traders and their preferences are in no way connected with the macroeconomic background. And the fundamental background is now so ambiguous that it is difficult to interpret in anyone else's favor. On Thursday, May 21, we recommend that you pay attention to the next report on applications for unemployment benefits in the United States. According to expert forecasts, this indicator may again grow by several million, which will indicate a continued trend of rising unemployment overseas and, accordingly, may create additional pressure on the dollar, which, incidentally, will contradict the current technical picture. Based on the foregoing, we have two trading ideas for May 21: 1) It is possible for quotes to grow if the resistance range of 1.0990-1.1008 is overcome, which consists of two corresponding levels. This will mean that the pair has left the side channel and is ready to form an upward trend with the first goal, the March 27 high at 1.1147. Potential to take profit in this case will be about 140 points. 2) The second option - bearish - is more likely. It is advised to sell euro from the resistance area of 1.0990-1.1008, not forgetting about the Stop Loss in case the bulls still continue to push the pair up. If a rebound occurs, the pair will begin to move downward, which we advise traders to practice, with targets at the 1.0952 level, the Kijun-sen line (1.0889), the Senkou Span B line (1.0846) and the upward trend line (1 , 0810). Potential to take profit in executing this scenario will be from 35 to 180 points. The material has been provided by InstaForex Company - www.instaforex.com |
| Posted: 20 May 2020 05:17 PM PDT 4-hour timeframe
Technical details: Higher linear regression channel: direction - downward. Lower linear regression channel: direction - downward. Moving average (20; smoothed) - sideways. CCI: 83.1255 The British pound spent the third trading day of the week in a very narrow price range and began to move down by the end of the trading day, despite the previous consolidation above the moving average line. In general, we can say that by the end of Wednesday, the pound failed to continue its upward movement, which increases the chances of resuming the downward trend. Market participants ignored the macroeconomic report on inflation, as well as many previous ones. The head of the Bank of England, Andrew Bailey, did not say anything new in principle at his speech. The only thing that the media is reporting now is that the Board of the British regulator is still considering the possibility of further expanding the quantitative stimulus program, as well as the possibility of reducing the key rate to a negative area. It is reported that BA is now studying the experience of other countries that already have negative rates. However, all this information does not significantly change the already established fundamental background. And it remains extremely negative for the British currency. Even if everyday traders do not get information feed that would allow them to sell the pound again and again, nevertheless, the "Sword of Damocles" has been hanging over the British currency for the past 3-4 years. With the emergence and arrival of the "coronavirus" epidemic in the Foggy Albion, all the problems of Great Britain only increased. However, Boris Johnson is not discouraged, and the country is preparing to terminate all agreements with the EU after December 31. Today, the UK government announced that up to 60% of goods entering the UK will not be subject to any tariffs or duties. The Ministry of Foreign Trade of the country has announced a new tariff regime, which will be much simpler and cheaper than the single external tariff of the European Union. It is also noted that it will be in pounds, not euros. "For the first time in 50 years, we can set our own tariff regime, which will be adapted to the UK economy. Our new tariff will benefit British consumers and households by removing various red tape and reducing the cost of thousands of goods," the Ministry of Foreign Trade said. As we have repeatedly stated, there is almost no correlation between the euro and the pound. If the euro currency has grown in recent days by 250 points against the US currency but generally holds inside the side channel, then the pound has started a new downward trend against the US currency and is currently only being corrected. Thus, despite all the political upheavals in the United States, the eternal war (during the reign of Donald Trump) between the Democrats and Republicans, which, in particular, does not allow to approve a new package of assistance to the US economy for $ 3 trillion, despite the strong economic decline, strong unemployment and large-scale defeat by the "coronavirus", the American dollar still looks much more attractive to investors and traders than the British pound. Buyers of the pound can only hope that the government of Boris Johnson will still be able to agree with the European Union on trade terms and other aspects of a comprehensive agreement that will determine the relationship between Brussels and London after 2020. Or it is still hoping for an even greater deterioration of the situation in America. And this may well happen. We have already said that a new trade war between China and the United States will hit the entire world economy and the economy of the United States itself. So far, Donald Trump and the company have refrained from concrete actions, but there is some progress in this direction. However, it is foolish to assume that China plays a secondary role in this confrontation. We believe that China is very competent in its battles with Washington. First, Beijing does not get into trouble, does not provoke conflicts first, and only responds to the attacks of the United States. Secondly, after all, the Chinese economy is the largest in the world along with the American one, so there is something to respond to Beijing in any case. Accordingly, it is foolish to expect that the United States will impose new duties, apply sanctions to Chinese officials, Chinese companies, and at this time, Beijing will simply remain silent and wait for everything to end. Thus, any actions against China will primarily affect America itself. Consequently, its economy will be weakened even more, although it continues to decline at the moment, despite the weakening of the "lockdown". On the penultimate trading day of the week in the UK, the publication of business activity indices in the services and manufacturing sectors is scheduled. As in the case of the European Union and Germany, both indices should grow by the end of May, in the service sector - to a value of 25, in the production sector - to a value of 36. However, we believe that this data will be ignored by market participants and will only allow us to understand whether the British economy is beginning to recover? In the United States, more interesting data will be published on Thursday. First, this is a report on applications for unemployment benefits. According to experts' forecasts, the number of initial applications in the week of May 15 will amount to another 2.4 million, so the total number of initial applications will reach 40 million in 10 weeks. But the number of secondary applications, which is considered a more accurate indicator of real unemployment, could reach 24.765 million for the week of May 8. However, in any case, we will see an increase in both indicators, which means that the situation with unemployment in the US will worsen. Also, data on business activity in the service sector (forecast – growth from 26.7 to 30.0), as well as in the manufacturing sector (forecast – growth from 36.1 to 38.0) will be received from overseas. As we can see, the situation is about the same as in Britain, the EU, and Germany. Late in the evening, there will be another speech by the head of the Fed, Jerome Powell, who has spoken or given interviews three times in the past 5 days. Thus, we do not expect any new information from him. Most likely, the Fed Chairman will again talk about a "strong economic shock" and the need for additional monetary injections into the US economy.
The average volatility of the GBP/USD pair remains stable and currently stands at 105 points. On Thursday, May 21, thus, we expect movement within the channel, limited by the levels of 1.2129 and 1.2339. The reversal of the Heiken Ashi indicator indicates a possible resumption of the downward trend. Fixing the price below the moving average will confirm this hypothesis. Nearest support levels: S1 – 1.2207 S2 – 1.2146 S3 – 1.2085 Nearest resistance levels: R1 – 1.2268 R2 – 1.2329 R3 – 1.2390 Trading recommendations: The GBP/USD pair turned down on the 4-hour timeframe, and fixing below the moving average will trigger a change in the downward trend. Thus, it is now recommended to trade the pound/dollar pair for a decrease with the goals of 1.2146 and 1.2129, but after fixing the price below the moving average line. It is recommended to buy the pound/dollar pair if traders manage to keep the pair above the moving average and after overcoming the Murray level of "5/8"-1.2268, with goals of 1.2329 and 1.2390. The material has been provided by InstaForex Company - www.instaforex.com |
| Posted: 20 May 2020 05:17 PM PDT 4-hour timeframe
Technical details: Higher linear regression channel: direction - downward. Lower linear regression channel: direction - upward. Moving average (20; smoothed) - upward. CCI: 125.4280 The EUR/USD currency pair starts near the level of 1.1000 on May 21 and intends to start a downward correction. During yesterday's day, the pair's quotes perfectly worked out the upper limit of the side channel of 1.0750-1.0990. The maximum price value was 1.0999. Thus, the upper border of the channel is now worked out exactly and clearly. Thus, now the quotes can begin to fall to the lower border of the channel, located near the level of 1.0750. This is potentially a decrease of 250 points. Only overcoming the levels of 1.1000 and 1.1008 will allow us to expect the formation of a new upward trend and further growth of the European currency. The macroeconomic and fundamental backgrounds were weak on Wednesday, but market participants, in any case, continue to ignore most of the incoming information, considering it uninteresting and unimportant. Just the other day, we wrote that US President Donald Trump has started a new round of accusatory speeches against the Democrats. However, this time the name of Joe Biden was touched only indirectly, so to speak "for the company". The main accusations poured in against former US President Barack Obama, whom Trump accused of provoking the "Russian affair" and leading the campaign to prevent Trump from winning the election in 2016. And Joe Biden, according to Trump, "was in the same boat with Obama" and in general, all Democrats are against him. However, the US leader did not provide any concrete evidence or arguments. Thus, most political scientists and experts immediately concluded that Trump has nothing to blame for Obama and Biden. You can claim their guilt every day, but what are the facts? And no one knows the facts, except for Trump himself. Thus, it seems that the American leader, using the so-called "Obamagate" case, is simply trying to divert the attention of Americans from himself, from the "coronavirus" pandemic and the economic crisis. And of course, he tries to put himself in the best possible light before the voters and to denigrate the Democrats as much as possible. US Attorney General William Barr also confirmed that Barack Obama and Joe Biden are unlikely to face any charges, hence there will be no criminal prosecution. Trump himself was very surprised by this position of Barr and immediately criticized the Prosecutor General at the same time: "I think this is a manifestation of double standards. If I were in their (Obama and Biden's) place, they would start an investigation." Most TV channels and periodicals in the United States almost immediately made a similar conclusion. The conclusion that Donald Trump is trying to distract the attention of Americans from the "coronavirus" pandemic, which has already claimed the lives of more than 90,000 people in the United States and the number of people infected with the COVID-2019 virus is already more than 1.5 million. Most experts in America associate such a strong defeat of the country by "coronavirus" with the name of Trump and his administration, which until recently did not want to take the virus seriously. The media call the "Obamagate" case an "informational story", knowing perfectly well that it is an interesting story, but not a real political or judicial trial. It is reported that only the Fox News channel loyal to the US President has seized on this topic and is actively promoting it. Thus, accusing Obama of "the largest crime in the history of America", Trump aims to worsen the reputation of the former President, and at the same time, Joe Biden. Joe Biden himself also speaks out against his main political rival very unflatteringly, but not so sharply. Biden said that if he wins future elections, he will not use his presidential powers to pardon Donald Trump for his potential crimes. Biden also previously said that President Gerald Ford made a big mistake when he pardoned his predecessor, Richard Nixon, in the 1974 Watergate case. According to Biden, Trump's pardon will not unite the United States, but only show that some people are above the law. Also, some American publications report that as long as Donald Trump is President, he has the so-called "constitutional immunity", which does not allow to bring a criminal case against him. However, everything will change when Trump leaves office. Several charges could end up with a 10-year sentence for Donald. Among the main charges against Trump are obstruction of justice in the case of Russian interference in the 2016 election, illegal delay of military assistance to Ukraine, blackmail of the Ukrainian President to launch an investigation against Joe Biden, and extortion of campaign donations from foreigners. On the penultimate trading day of the week in the European Union and Germany, the publication of business activity indices in the services and manufacturing sectors for May is planned. The values are not final but will allow us to draw certain conclusions about the trend in these areas. According to forecasts, business activity in Germany will start to grow in May. In the service sector, it will increase from 16.2 to 26.6, and in the manufacturing sector - from 34.5 to 39.2. These figures will remain scanty, but if they start to grow, it will be a good sign of economic recovery. In the European Union, the situation is approximately the same. In the manufacturing sector, business activity is expected to grow from 33.4 to 38.0, and in the service sector – from 12 to 25. However, we still do not believe that these macroeconomic reports will have any impact on the movement of the euro/dollar currency pair. First, the indicator values will remain extremely low. Secondly, in America, most likely, due to the gradual abolition of "lockdown", business activity will also begin to grow. Thus, the synchronously falling US and EU economies can now begin to recover synchronously. The main question is how much each economy will lose in the end and what will be the pace of their recovery?
The average volatility of the euro/dollar currency pair as of May 21 is 79 points and has not changed in recent days. Thus, the value of the indicator remains stable and is characterized as "average", despite a fairly active Monday. Today, we expect quotes to move between the levels of 1.0905 and 1.1063. A reversal of the Heiken Ashi indicator downwards may signal a turn of the downward movement within the channel of 1.0750-1.0990. Nearest support levels: S1 – 1.0925 S2 – 1.0864 S3 – 1.0803 Nearest resistance levels: R1 – 1.0986 R2 – 1.1047 R3 – 1.1108 Trading recommendations: The EUR/USD pair continues its upward movement. However, the level of 1.1000 was worked out, so there is a high probability of the pair turning down and a downward movement within the side channel of 1.0750-1.0990. Thus, it is recommended to consider selling the pair with the goal of 1.0750 after the Heiken Ashi indicator turns down, and buying is recommended to consider only above the level of 1.1000 with the goals of 1.1047, 1.1063 and 1.1108. The material has been provided by InstaForex Company - www.instaforex.com |
| EUR/USD and GBP/USD. Andrew Bailey's speech unlikely to stir markets. UK, EU Inflation were ignored Posted: 20 May 2020 01:05 PM PDT 4-hour timeframe Average volatility over the past five days: 80p (average). Following a slight correction, the EUR/USD pair resumed the upward movement within the framework of the side channel, limited by the levels of 1.0750 and 1.0990 on Wednesday, May 20. Thus, as we expected this morning, the pair will try to clearly work out the upper border of the channel and it will decide the future of the euro currency in the coming days and weeks. With a high degree of probability, a rebound will occur from the $1.10 level, which will leave the pair inside the side channel. In this case, a new round of downward movement will begin with the target of 1.0750. However, in case of overcoming the upper boundary of the side channel, the continuation of the upward movement is expected. From a fundamental point of view, it is difficult to say something specific now. On the one hand, there is a proposal to create a Recovery Fund in Europe, from which they want to help the countries and segments of the economy that are most affected by the coronavirus. On the other hand, this is not a reason for joy and purchases of the European currency. Earlier, ideas about crown bonds and a 2-trillion stimulus package failed miserably. Thus, 500 billion, firstly, is not enough, and secondly, they still need to be collected, and before that it is necessary that all 27 EU member states approve this plan of Angela Merkel and Emmanuel Macron. Thus, we do not believe that the euro/dollar is growing due to these events. As for ordinary macroeconomic statistics, everything here is also ambiguous. Market participants simply continue to ignore almost all the data at their disposal. For example, the consumer price index in the European Union for April was published today. The inflation value turned out to be worse than the already weak forecast and reached only 0.3% in annual terms. Compared to March 2020, prices in the eurozone fell by 0.2%, that is, this is a deflation. Minutes of the last meeting of the US Federal Reserve is set to be released in the evening, however, as we already said in previous articles, this document is unlikely to contain information still unknown to the markets. Meanwhile, the most interesting information comes from the US again. Joe Biden calls the US president "President Tweety," alluding to Trump's daily posts on Twitter. Donald Trump once again called the "crazy" House Speaker Nancy Pelosi, simultaneously accusing all Democrats of corruption and the desire to remove him from power by illegal means. "There was not so much abuse against anyone as against me. The top of the FBI is corrupt and bad people. "Russian business" is a concocted, fabricated story. Democrats are sick. Nancy Pelosi is a sick woman, she has problems with her head," the US leader said. Once again, we would like to note that Trump, although he is a strong leader, is sorely lacking in flexibility and the ability to work in a team with opposition political forces, taking into account the interests of all. That is why he regularly falls under the wrath of the Democrats, who, indeed, are ready for anything, just to prevent Trump from being re-elected. Moreover, if a year ago everything was relatively good in America, and the trade war with China, although it entailed a slight reduction in the economy, nevertheless ended with the signing of a trade agreement (albeit not complete), now this deal threatens to be terminated and Beijing and Washington are preparing for a new trade war. And what successes in the presidential field can Donald Trump now boast of, daily insulting everyone and everything? Trump is to blame for everything, China, the World Health Organization, the Democrats. After that, he wonders why everyone is so unfavorable to him and fervently wants him to leave his post? Well, the situation with the coronavirus is just a cherry on the cake. Wherever COVID-19 infection came from, the United States was not prepared for an epidemic. Authorities should be blamed for this and not the WHO. 4-hour timeframe Average volatility over the past five days: 117p (high). The GBP/USD pair is trading almost identically to the EUR/USD pair on May 20. The upward movement also resumed for the pound/dollar pair, although there were no strong macroeconomic reasons for this. The Ichimoku indicator has formed a new signal to buy the Golden Cross, which allows us to expect a new upward trend to form. However, the Ichimoku cloud with a strong Senkou Span B line lies on the way up. Therefore, the current upward movement continues to be identified as corrective for now, despite overcoming the critical Kijun-sen line. Volatility for the pair is extremely low today, at the time of writing, only 67 points. The UK consumer price index for April was published today. As in the case of the European Union, inflation slowed down, but not so much, and reached 0.8% in annual terms. However, we have already noted that under current conditions, the inflation rate is not important. Inflation is a significant indicator when it comes to economic growth. The central bank is oriented to stimulate economic growth due to inflation. However, now all the economies of the world are simultaneously reducing, so it does not matter what inflation rate is fixed. Traders, as we see, hold the same opinion, because the next slowdown in the consumer price index did not cause any reaction. The British pound continued to rise moderately against the dollar. Bank of England Governor Andrew Bailey is set to make a speech today. However, we believe that he will not inform the markets of anything fundamentally new. The only thing that market participants expect from the central bank in the near future is the expansion of the quantitative incentive program by 100 or 200 billion pounds. Thus, in general, we can say that the fundamental background was absent for the pound/dollar pair today, and the macroeconomic one was again ignored. Technical factors are in first place, which we recommend paying special attention to when opening any positions and predicting the further movement of the pair. Recommendations for EUR/USD: For short positions: The EUR/USD pair continues its upward movement on the 4-hour timeframe. However, it can turn around and begin to fall near the upper boundary of the lateral channel 1.0750 - 1.0990. Thus, we recommend considering selling the pair with a view to the lower boundary of the channel - 1.0750 in the case of an eloquent rebound in the price from the level of $1.10. For long positions: Buy orders can be opened no earlier than breaking 1.0990, the 1.1000 level and the resistance level of 1.1008. After overcoming these obstacles, we can expect an upward trend to form and continue trading for an increase. Recommendations for GBP/USD: For short positions: The pound/dollar continues to adjust against the downward trend. Thus, traders are advised to resume selling the pair with the objectives of 1.2130 and 1.1987 in case of price taking below Kijun-sen. For long positions: You are advised to consider purchases of the GBP/USD pair while aiming for the 1.2325 level, but in small lots, since the Golden Cross is weak. The material has been provided by InstaForex Company - www.instaforex.com |
| Posted: 20 May 2020 10:51 AM PDT The pound was able to rise against the US dollar on Wednesday, while falling against the euro. The clouds over sterling continue to gather. A portion of today's negative came from the inflation data, which fell below 1%, to a 4-year low. This happens at a time when the UK financial authorities are debating negative rates. The fall in inflation has given rise to speculation in the markets that the Bank of England may soon lower interest rates below zero to support an economy affected by the coronavirus pandemic. Meanwhile, the fall of the GBP/USD pair was not so extensive. The point here is the dollar's weakness, as it declined across the entire spectrum of the market by the end of the day. USDX The British currency has nothing to say against the gaining euro. The euro rose after consumer confidence in the eurozone improved by 3.2 points in May compared with April. Sterling paired with the euro in the moment touched the weakest mark since the end of March - 89.69. The officials of the English regulator are now carefully studying the experience of other central banks with negative interest rates. However, they do not want to notice how the UK economy responds to the April emergency rate cut in response to the economic shock caused by the spread of COVID-19. Many global strategists agree that lowering rates below zero in the UK is a bad idea. "It is impossible to imagine an economy in which negative rates would be worse than in the UK," wrote Societe Generale. Rates below zero will push the British currency into the abyss. Sterling is now at the bottom of its recent trading range, as Britain remains one of the pandemic-affected countries with more than 35,000 deaths and nearly 250,000 infected. GBP/USD There are opinions on the market that suggest that the pound is not so bad. There is really no chance of growth in the short term. However, in the long run, one can hope for the appearance of light at the end of the tunnel. So, strategists of the Swiss Bank UBS expect the pound to rise against the US dollar by the end of the year to the 1.35 level. This forecast implies a 10% rally from the current levels around 1.22 and strongly contrasts with other opinions on the market. Most analysts write about the British currency's decline. If we talk about the end of the year, according to a Bloomberg survey, sterling can grow against the dollar to a value as high as 1.26. UBS believes that Brexit without a trade agreement and talking about negative interest rates in the UK are only short-term risks for the sterling. If we talk more about these two factors, then the Bank of England in June is likely to announce an increase in QE by 100 billion pounds. Concerns about Brexit are exaggerated. It is unlikely that Britain will leave the EU without an agreement; we have already passed this. It is worth waiting for a low transaction or a small extension of the transition period. It is also worth paying attention to the weakening dollar. Given the almost zero rates in the US, demand for US currency should decline. The dollar will also be pressured by Federal Reserve measures to alleviate the stress associated with dollar financing. UBS also drew attention to the fact that the pound remains "deeply underestimated", and the equilibrium level of GBP/USD for three years ahead is 1.53. The material has been provided by InstaForex Company - www.instaforex.com |
| Posted: 20 May 2020 10:50 AM PDT The euro-dollar continues to show bullish sentiment. Today, buyers approached the boundaries of the 10th figure - the last time the pair was in this price area was almost three weeks ago - in early May, when traders massively recorded profits amid a downward turn in the buzz around the dollar. At that time, the EUR/USD grew because the greenback weakened, while the situation is radically different today. However, the dollar still remains under the background pressure: political strife around an additional anti-crisis package did not make it possible for dollar bulls to emerge at a decisive moment - as part of the downward pullback, sellers were unable to return to the eighth figure, and this fact fueled interest in long positions. In the next stage of the battle, the bears lost again, allowing their opponents to go above the resistance level of 1.0950. Now the tenth figure is at stake, and if sellers are also defeated here, we can talk about the first signs of a trend reversal. There are certain prerequisites for this. The fact is that all previous growth impulses were caused only by a weakening dollar - the European currency passively followed the greenback, which showed either a slight increase or a slight decrease. The pair obediently focused on the dollar, starting from the lower or upper border of the almost 150-point price range (1.0750–1.0890). However, to date, the euro has ceased to be led and has proved to lead. The pair was able to break out of the above price range only due to the euro's growth and the phlegmatic nature of dollar bulls. Now the fate of the upward trend depends on the fate of Merkel's plan to restore the eurozone economy. If this initiative is supported by all EU members, the pair will receive a powerful argument for their further growth. Let me remind you that Berlin and Paris have proposed to create a fund for the recovery of the European economy worth 500 billion euros. This idea was received in different ways in Europe: for example, the countries of the south (in particular, Spain, Italy, Greece) supported this initiative. The head of the European Commission and the ECB president also expressed their support. The main opponent of Merkel in this issue was Austria. In Vienna, they said that they do not support the idea of Germany and France, so together with three other EU countries, they will prepare an alternative proposal involving the issuance of loans instead of subsidies. By and large, this is the continuation of a fairly long dispute over the so-called crown bonds - only now the question is somewhat different: whether to provide free grants to the countries affected by COVID-19 or still loans? It is noteworthy that now Germany is on the side of the south, which is important, and I would say a key ally. Germany previously strongly opposed crown bonds, while now they are with the same zeal defending Merkel's proposal to create a 500-billion euro aid fund. The French are not far behind the Germans, who are also actively lobbying for a joint initiative. According to some experts, if this scenario is implemented, most EU countries will depend on the two most powerful powers. This will enable Paris and Berlin to advocate for a more integrated, interdependent Europe, while strengthening their own positions in relation to other countries. Thus, the European continent is again divided into two camps – some support the plan to restore the eurozone economy, while others oppose. Only now the forces are clearly unequal: such political heavyweights as Germany and France have moved to the side of the south. Whether a kind of "Union of oppositionists" (Austria, Denmark, the Netherlands and Sweden) will be able to insist on their own is, of course, an open question. But judging by the dynamics of the pair, market participants are confident that in the framework of informal negotiations, representatives of these countries will still change their point of view and eventually vote for the creation of an aid fund. The pair was indirectly supported by very good reports from the ZEW Institute, which were published on Tuesday. Thus, the German business activity index was projected to reach 30 points, but eventually jumped to 51. The indicator was below the key 50-point mark since January last year, so this landmark event could not be ignored by the market. The pan-European index also increased significantly, exceeding forecast values (growth to 46 points instead of a decline to 24). Such trends have become an additional argument for the recovery of EUR/USD. But nevertheless, the key to the pair's growth is in the hands of the leaders of the EU countries - this is especially true for those states that now act as oppositionists. If they demonstrate their "negotiability", the euro will conquer the tenth figure, indicating new price horizons. Otherwise, the bears will seize the initiative and the pair will return to the region of the eighth figure. Thus, at the moment, the pair retains the potential for further growth, but, due to the uncertainty regarding the position of the four European countries (the fifth country, Hungary, may soon join them), it is advisable to open long positions only if they consolidate above 1.1000. In this case, the bulls will clear their way to the next resistance level, which corresponds to the 1.1060 level - this is the upper border of the Kumo cloud on the daily chart and at the same time the Kijun-sen line on the weekly. The material has been provided by InstaForex Company - www.instaforex.com |
| May 20, 2020 : EUR/USD Intraday technical analysis and trade recommendations. Posted: 20 May 2020 09:38 AM PDT
Few weeks ago, the EURUSD pair has expressed remarkable bullish recovery around the newly-established bottom around 1.0650. Bullish engulfing H4 candlesticks as well as the recently-demonstrated ascending bottoms indicated a high probability bullish pullback at least towards 1.0980 and 1.1075 (Fibo Level 50%). Around the price zone between (1.1075-1.1150), a bearish Head & Shoulders pattern was demonstrated. That's why, Further bearish decline was demonstrated towards 1.0800 where the nearest demand level to be considered was located near the backside of the broken channel (1.0800-1.0750). Evident signs of Bullish rejection have been manifested around the price zone of (1.0800-1.0750) leading to the recent bullish spike up to 1.0990. The short-term technical bullish outlook remains valid as long as bullish persistence is maintained above the recently-established ascending Bottom around 1.0770. Further bullish advancement was expected to pursue beyond 1.1000 towards 1.1175 where 61.8% Fibonacci Level is located. Bullish breakout above 1.1000 was needed to enhance further bullish movement towards 1.1075 and probably 1.1150. However, lack of bullish momentum brought another recent bearish decline towards the depicted price zone around 1.0800. The price zone of (1.0815 - 1.0775) still stands as a prominent Demand Zone which has been providing quite good bullish support for the pair. Currently, bullish breakout above 1.1000 is needed to enhance further bullish advancement towards 1.1075 and 1.1175. On the other hand, any bearish breakdown below 1.0770 should be marked as an early Exit signal for all short-term BUY trades. Trade recommendations : Intraday traders are advised to wait for bullish breakout above 1.1000 as a valid BUY signal. T/P levels to be located around 1.1075 then 1.1175 if sufficient bullish momentum is maintained while S/L to be located below 1.0950 The material has been provided by InstaForex Company - www.instaforex.com |
| May 20, 2020 : GBP/USD Intraday technical analysis and trade recommendations. Posted: 20 May 2020 09:30 AM PDT
Recently, Bullish persistence above 1.2265 has enhanced another bullish movement up to the price levels of 1.2520-1.2590 where significant bearish rejection as well as a quick bearish decline were previously demonstrated (In the period between 14th - 21 April). Currently, Atypical Bearish Head & Shoulders reversal pattern may be in progress. The pair was recently demonstrating the Right Shoulder of the pattern. Hence, Bearish persistence below 1.2265 (Reversal Pattern Neckline) was needed to confirm the pattern. Thus, enhance another bearish movement towards 1.2100, 1.2000 then 1.1920. By the end of Last Week, Intraday traders were advised to wait for bearish pullback towards the price levels of 1.2300-1.2280 where a low-risk short-term BUY trade could be taken. The recently demonstrated Lower High around 1.2440 endangered the previously-mentioned short-term bullish scenario. That's why, the price zone of 1.2300-1.2280 failed to provide enough bullish support for the pair. Thus, the suggested short-term BUY trade was invalidated shortly after. The current bearish breakdown below 1.2265 should be taken into consideration as it confirms the previously-mentioned reversal-top pattern. Hence, further bearish decline would eventually be enabled towards 1.2020 as a projection target for the reversal pattern. Currently, the price zone of 1.2265-1.2300 (Backside of the broken Uptrend) stands as a recently-established SUPPLY-Zone to offer bearish rejection and a valid SELL Entry for the pair in the short-term. Trade recommendations : Intraday traders can consider the current bullish pullback towards 1.2265-1.2300 as a valid SELL signal. T/P level to be located around 1.2150, 1.2100 and 1.2000 while S/L should be placed above 1.2350. The material has been provided by InstaForex Company - www.instaforex.com |
| Waiting for statistics: calm before the storm in the oil market Posted: 20 May 2020 08:46 AM PDT
Today, the cost of crude oil continues to move up. The main reason is quite noticeable signs of increased demand, as well as a decline in stocks in the United States. However, the situation with the COVID-19 pandemic still keeps participants in suspense, which puts pressure on oil, preventing it from making a more impressive recovery. Futures for Brent crude oil for delivery in July rose 0.9% this morning, which allowed them to be at $ 34.97 per barrel. Futures for WTI black gold added a little more - 1.03% and began to cost 32.29 dollars per barrel. According to data from the U.S. Petroleum Institute, last week, crude stocks fell 4.8 million barrels and reached 521.3 million barrels. From this, it follows that real indicators may turn out to be much better than the preliminary forecast of experts who claimed that an increase of about 1.2 million barrels should occur. Gasoline stocks will also decrease by about 651 thousand barrels and distillates will decrease by 5.1 million barrels according to the API. As for the stocks of raw materials specifically in Cushing, they should be reduced by 5 million barrels. However, other experts from S&P Global Platts, on the contrary, made the forecast not so comforting for the market. They argue that oil reserves will show growth of 2.4 million barrels, distillates will increase by 3.2 million barrels, but gasoline reserves, in turn, will decrease by 3.5 million barrels, which is associated primarily with its growth consumption after the removal of quarantine measures. In the event that the assumptions of S&P Global Platts analysts coincide with reality, the oil market will experience even more serious pressure, which clearly will not benefit it. Yesterday, market participants were in a very delicate situation, as they were under serious pressure over the growth of oil reserves, but they left with the June contract for WTI raw materials, which expired and successfully transferred to the contract for the next month. The demand has become more stable in the short-term. Nevertheless, most investors still keep a low profile on the situation, as the situation with coronavirus infection does not let the world market go to the end. Particularly serious concerns are caused by the recovery of the US economy, a country that is one of the largest oil consumers in the world. In such a difficult situation, the crude oil market is looking for the support, which it manages to find against the background of a slow but sure lifting of the quarantine in more and more countries, which is good in itself, but it can also fuel demand for raw materials. In addition to this positivity is the decline in black gold production from key OPEC countries. Most market participants express great hope that this will help maintain a balance in the market in the end, and positive dynamics will continue to be recorded. The most approximate forecasts say that it will be possible to restore the hydrocarbon market no earlier than the third quarter of this year, which in this situation can be considered the best scenario. However, the situation can also be significantly supported by the release of a vaccine against coronavirus, the development and successful testing of which has already been announced by the largest pharmaceutical company Moderna. However, there is no sufficient reason to trust this information since no correct supporting data has been provided. One way or another, investors' moods are still quite restrained, and the main attention is focused on official publications of the United States Department of Energy. Only after the publication of new statistics on commercial stocks of oil, gasoline and distillates, market participants will be able to act more confidently. It can be recalled that yesterday's session ended with a decline in the cost of Brent crude oil by 3.3%, which, however, did not prevent it from maintaining its maximum value since the beginning of last month. The material has been provided by InstaForex Company - www.instaforex.com |
| Evening review on EUR/USD for May 20, 2020 Posted: 20 May 2020 07:28 AM PDT
EUR/USD: After its normal consolidation on an H4 scale, the pair breaks through a maximum of 1.0980. The maximum normal rollback is 1.0940. Closing the day above the level of 1.1020 may open the probability of growth at 1.1400. You may consider purchases from 1.0855 and stop at 1.0835. You may move the stop to 1.0855, or to 1.0915, for conservative investors. There is no level for sale so far near current prices, the closest is at 1.0770. The material has been provided by InstaForex Company - www.instaforex.com |
| EURUSD shows short-term signs of strength entering the Ichimoku cloud. Posted: 20 May 2020 07:23 AM PDT EURUSD is making new higher highs and has entered the Ichimoku cloud resistance area. Trend is now neutral in terms of the Ichimoku cloud indicator on a daily basis. As long as price is inside the Cloud, we consider trend is neutral.
EURUSD has held above the tenkan-sen (yellow line indicator) and the kijun-sen (green line indicator). The tenkan-sen is also crossing above the kijun-sen. This is a weak bullish signal. Price entering the body of the cloud is a sign of strength since it comes from below. Next key resistance is the upper cloud boundary at 1.1065. Breaking above this level would be a big win for bulls. Support remains key at the lower cloud boundary at 1.0960 and next at 1.087-1.0880. The material has been provided by InstaForex Company - www.instaforex.com |
| Short-term Ichimoku cloud indicator analysis of Gold for May 20, 2020 Posted: 20 May 2020 07:15 AM PDT Gold price remains in a bullish trend. Price continues to respect and trade above short-term support Ichimoku indicators. Although technically we still observe bearish divergence signals in the weekly chart, there is no reversal signal yet.
Gold price after breaking above the black resistance trend line has provided a new 2020 high and continues to hold above the tenkan-sen and kijun-sen indicators. Support by those two indicators has now risen towards $1,728 and $1,712 respectively. As long as price is above these two levels short-term trend remains bullish targeting $1,770-80 as we explained in previous posts.
Red line -bearish divergence Green rectangle -target Gold price is diverging on a weekly basis. This is an important warning not to get too optimistic at $1,750 and above. Yes price could reach $1,780 but the downside potential is bigger. Key reversal level is the $1,700 base and the $1,710-20 support area. Looking closely for any clues of a reversal. So far no sign. Bulls need to be cautious. The material has been provided by InstaForex Company - www.instaforex.com |
| The stock market at a crossroads Posted: 20 May 2020 06:59 AM PDT
Today, the stock market began with uncertainty. Investors in Europe, the US, and Asia were not able to determine the general dynamics of development, which only added to their thoughts. Indices of the Western European countries could not demonstrate the same vector of movement. They slightly changed their positions and trading went in different directions. The main news that the participants supposed was the possible receipt of a vaccine against coronavirus. However, investors reacted restrainedly and skeptically in this matter. The Stoxx Europe 600 index climbed 0.15% on Wednesday morning to reach 339.99 points. The UK FTSE index also rose slightly by 0.04%, the same with the German DAX indicator by 0.03%. CAC from France, by contrast, declined by 0.26%, and indicators from Italy and Spain followed. The first FTSE MIB lost 0.55%, and the second IBEX 35 lost by - 0.16%. The positive that the global stock market showed at the beginning of this week seems to have come to an end. The large medical publication Stat added fuel to the fire, casting doubt on the fact that Moderna was indeed able to develop an effective vaccine against COVID-19. The reason for doubt was the insufficient amount of reliable and high-quality information that allows us to draw conclusions about the real results of the research. Eurozone statistics, which arrived this morning, reflected a decline in inflation in the UK over the past month. The slowdown was a record and went down to the minimum level that was recorded four years ago. Consumer prices, however, increased in April by 0.8% in annual terms, reflecting the lowest pace. Thus, analysts estimate that inflation has become 1.5% slower than it was in March. Experts, on the contrary, argued in their forecasts that the growth rate of consumer prices should weaken by 0.9%. Producer prices fell by 0.7% last month. Recall that in March, they recorded an increase of 0.3%. Thus, it should be noted that the decline in this sector has become the most serious over the past few years. Again, the forecasts of analysts who claimed that the reduction did not exceed the 0.4% mark did not materialize. Securities of Marks & Spencer Group Plc increased their value by 4.9%, this is due to the release of the next batch of company statistics, which for investors seemed very successful. Experian shares also climbed 6.1%, despite negative forecasts. Shares of a major engineering holding Rolls-Royce, in contrast, are becoming cheaper with a decrease of about 2.7%. A possible reason is the announcement of large-scale layoffs that should occur in the enterprise. Stock indices of the United States of America ended yesterday's trading session with a negative. On average, the decline was in the range from 0.5% to 1.6%. US stock exchanges did not continue the significant growth that was observed a day earlier. Market participants reacted differently to the proposed situation, which was reflected in their mixed and multidirectional mood. In general, it can be noted that investors still prefer to take a break for thought. There are many reasons for doubt in the market. So, news of a potential vaccine against coronavirus is also putting pressure on the US market. However, even greater excitement is caused by the speech of the head of the US Federal Reserve Service, Jerome Powell, who made a call to promote economic recovery in all possible ways. Among other things, this may mean the introduction of another portion of incentive measures. The Dow Jones Industrial Average index fell 1.59% to reach 24,206.86 points. The S&P 500 index also fell 1.05%, its current level is now at 2822.94 points. The Nasdaq Composite index fell by 0.54% and was fixed at 9185.10 points. Kohl's shares were down to 7.7%, while Facebook, by contrast, increased the value of its securities by 1.7%. Stock indices in the Asia-Pacific region are also mixed today. There was even a slight pullback after yesterday's trading session. They also analyzed data on the coronavirus vaccine, however, this was not the only point of pressure on market participants. The news that investors were playing out was that the Central Bank of China did not make changes not only to the annual but also to the five-year refinancing rate. They remained at 3.85% and 4.65%. The Shanghai Composite Index fell by 0.45%, while the Shenzhen Component Index fell by 0.37%. The growth of tension between the two economically active powers China and the United States exerted pressure on the market. Hong Kong's Hang Seng Index was down by 0.12%, while Japan's Nikkei 225 Index was up by 0.96%. South Korea's Kospi index also rose slightly by 0.21%. And although insignificant, growth was also recorded in the ASX 200 index, which increased by 0.06%. The material has been provided by InstaForex Company - www.instaforex.com |
| Gold maintains an upward trend Posted: 20 May 2020 06:50 AM PDT
Asian trading for today showed a rise in gold quotes. According to the morning data from the New York Mercantile Exchange division, gold futures for delivery in June began to cost 0.51% more, which allowed them to take the mark of $ 1.754.55 per troy ounce. The support of the precious metal was at the level of $ 1.716 per troy ounce, whereas the resistance was at $ 1.775.8 per troy ounce. The situation on the mail precious metals market has not changed; the upward trend continues. After a minor correction the other day, gold continued a slow but gradual upward movement. Recall that now the price of precious metal tends to break through the ceiling of $ 1,800 per troy ounce. Moreover, many experts are inclined to believe that in the near future, it may well succeed if there are no global changes. However, if suddenly some stunning news collapses on the market only the level of the growth point will undergo changes, it is unlikely to redirect the upward trend itself. For other metals, the growth trend continues. Thus, quotes of silver futures for delivery in July recorded a rise of 1.07%, which allowed them to be at around 18.093 dollars per troy ounce. Copper futures for July delivery also increased their value by 0.42%, their current level is at $ 2,419 per pound. The material has been provided by InstaForex Company - www.instaforex.com |
| Posted: 20 May 2020 06:01 AM PDT All attention in the first half of the day was drawn to the data on inflation in the UK, the decline of which leaves the Bank of England with even more maneuver with interest rates, maybe even with negative ones, and will also allow you to expand the QE program without any problems. The low value of the British pound and a sharp jump in the unemployment rate, as we can see, do not yet create serious inflationary pressure. According to the forecasts of many economists, by the summer of this year, annual consumer price inflation in the UK may even touch the deflationary level and fall to zero, as the current growth rate has become the fastest since the crisis in 2009. However, such problems are more related to a sharp drop in energy prices, rather than a real decline in consumer prices. As I noted above, low inflation has only increased the talk that the Bank of England may expand its bond-buying program by 100 billion pounds at the beginning of the summer. According to the statistics agency, the annual rate of consumer price inflation in April 2020 slowed to 0.8% from 1.5% in March, while economists expected inflation around 0.9%. Things were much better with core inflation. The report shows that it fell in April to 1.4% from 1.6% in March. Already, inflation is 1 point below the Bank of England's target level, which is around 2.0%, and we will know very soon how the bank manager Andrew Bailey will react to this. At the very least, he needs to write a letter to the Finance Minister explaining why this happened. However, the reasons are already clear, which most likely will not cause serious problems. Returning to the topic of lowering interest rates, we can also expect similar actions from the regulator in June this year. Of course, it is not necessary to seriously think about the introduction of negative rates yet, but we should not rule out such a moment in the future. It is important to understand how the economy will respond to reduced restrictions and quarantine measures and how quickly it will recover from the coronavirus pandemic. Once again, the main driver of the fall in the consumer price index was energy prices, which is unlikely to have greatly concerned the Bank of England. How the regulator will act in the future, it will be possible to understand today after the speech of its Governor, Andrew Bailey. As for the technical picture of the GBPUSD pair, a break in the resistance of 1.2285 may lead to a more powerful bullish impulse and update the highs of 1.2340 and 1.2430. In the event of a negative reaction of the pound to the speech of the head of the Bank of England, a break in the support of 1.2222 will lead to a larger sale in the area of the lows of 1.2170 and 1.2120. EURUSD The European currency remained to trade in a side-channel against the US dollar, as the euphoria from the creation of the Franco-German economic recovery fund gradually fades, and disputes and opposition to this fund only increase. And if no one disputes the 500 billion euros needed to restore the economy, it is difficult to say for sure whether this fund will be approved. The problem point is the decision to participate in the fund for the entire EU, not just the Eurozone countries. Today's data on the current account surplus of the euro area's balance of payments, which decreased in March compared to April, did not cause serious pressure on the euro. According to the data, the balance fell to 27 billion euros in March against a current account surplus of 38 billion euros in February. As for the technical picture of the EURUSD pair, the bulls still have problems with the level of 1.0980. Only its breakout will lead to the return of the trading instrument to the highs of 1.1020 and 1.1140. The downward correction, which may begin today, will lead to an update of the minimum of 1.0890, but the longer-term goal will be the minimum of 1.0855, where buyers of risky assets will try to build the lower border of a new upward channel aimed at a larger growth of the euro. The material has been provided by InstaForex Company - www.instaforex.com |
| Posted: 20 May 2020 05:19 AM PDT News:
As such, the difficulty of mining is set to self-adjust every 2016 blocks -basically every two weeks- in order to maintain a steady block interval. For instance, if it took more than two weeks to mine the previous 2016 blocks, the difficulty decreases. If it took less, mining difficulty is increased. On May 20, the difficulty decreased by 6% to 15.14T. According to Glassnode, this decrease was expected and is consistent with the recent drop in hashrate after the halving. Technical analysis: Trading recommendation: Watch for selling opportunities if you see the breakout of the symmetrical triangle and upward channel. The downward targets are set at the price of $9,085 and $8,150. Main resistance is set at the price of $10,000 The material has been provided by InstaForex Company - www.instaforex.com |
| Posted: 20 May 2020 05:14 AM PDT To open long positions on GBPUSD, you need: In the first half of the day, sellers tried to gain a foothold below the resistance of 1.2237, and if you look at the 5-minute chart, you will see how the sell signal worked itself out after repeated testing of this level from the bottom up, but it was not possible to form a larger downward movement. This led to the return of GBP/USD to the level of 1.2237, the demolition of stop orders, and the formation of new support of 1.2222, which buyers are now very much counting on. While trading is above the level of 1.2222, demand for the pound will continue, and the speech of the Governor of the Bank of England, Andrew Bailey, may revive major players who are betting on a breakout and consolidation above the resistance of 1.2882, which may lead to the continued growth of GBP/USD already in the area of highs of 1.2336 and 1.2370, where I recommend fixing the profits. If the Bank of England's monetary policy report leads to the formation of pressure on the British pound, it is best to return to long positions only after the formation of a false breakout in the support area of 1.2222 or buy immediately for a rebound from large lows in the area of 1.2173 and 1.2122 with the aim of an upward correction of 30-40 points within the day.
To open short positions on GBPUSD, you need: Sellers of the pound need to return GBP/USD to the level of 1.2222, and this should be done as quickly as possible. Only fixing below this range will increase the pressure on the pair, which will lead to an update of the minimum of 1.2173, and quite possibly to a test of large support of 1.2122, where I recommend fixing the profits, since the bulls will try to form the lower border of a new ascending channel. No less important is the protection of the resistance of 1.2882, where only the next formation of a false breakout will be a signal to open short positions. If growth is above this range, it is best to abandon sales before the test of a large resistance of 1.2336 or to rebound from the maximum of 1.2370.
Signals of indicators: Moving averages Trading is just above the 30 and 50 daily averages, which indicates the continuation of the upward correction. Note: The period and prices of moving averages are considered by the author on the hourly chart H1 and differ from the general definition of the classic daily moving averages on the daily chart D1. Bollinger Bands A break in the upper limit of the indicator around 1.2882 will lead to a larger increase in the pound. In the case of a decrease in the pair, a breakthrough of the lower border of the indicator in the area of 1.2222 will increase the pressure on the pound. Description of indicators
|
| Posted: 20 May 2020 05:12 AM PDT Corona virus summary:
Member states have backed a resolution strongly supportive of the World Health Organization, after Donald Trump issued a fresh broadside against the UN body, giving it 30 days to make unspecified reforms or lose out on US funding. None of the WHO's 194 member states raised objections Technical analysis: Trading recommendation: Watch for buying opportunities on the pullbacks using the intraday time-frames 15/30 minutes for the better entry location. Main upward targets are set at the price of 1,2325 and 1,2370. The material has been provided by InstaForex Company - www.instaforex.com |
| Posted: 20 May 2020 05:11 AM PDT To open long positions on EURUSD, you need: The data on inflation in the Eurozone that was released in the first half of the day, which declined more than expected by economists, did not significantly affect the European currency. Lack of activity on the part of euro sellers in the second half of the day may lead to further growth of the pair. From a technical point of view, nothing has changed either, since none of the channel borders have been updated. At the moment, the entire focus of the bulls remains on the range of 1.0923, since only the formation of a false breakout there will be a signal to open long positions in the euro. It is important to note that in general, as long as trading is conducted above this range, we can expect a second wave of EUR/USD growth in the area of yesterday's maximum. But the more important task of the bulls is to break through and consolidate above the resistance of 1.0972, which will open a direct path to new levels in the area of 1.1013 and 1.093, where I recommend fixing the profits. If the pressure on the euro gradually returns, and this happens immediately after the breakdown of the support of 1.0923, which yesterday helped buyers many times, then it is best to open long positions after a downward correction to the area of the minimum of 1.0890 or immediately to a rebound from the support of 1.0855 with the aim of increasing by 30- 35 points intraday. To open short positions on EURUSD, you need: In the afternoon, the minutes of the April meeting of the Federal Reserve is expected to be published, which may negatively affect the European currency. The main task of the bears is to return and fix the EUR/USD below the level of 1.0923, since only then can we talk about the resumption of pressure, which will push the pair to the lows of 1.0890 and 1.0855, where I recommend fixing the profits. Also, sellers should not forget about the protection of the resistance of 1.0972, but now I recommend opening short positions from there only after the formation of a false breakout, since after the data on the Eurozone consumer sentiment index, the bulls may once again attempt to continue the upward correction. If you grow above the resistance of 1.0972, it is best to abandon short positions before updating the larger maximum of 1.1013 or sell the euro immediately on the rebound from the resistance of 1.1093, in the expectation of correction of 30-40 points within the day.
Signals of indicators: Moving averages Trading is conducted above the 30 and 50 daily moving averages, which indicates the bullish nature of the market. Note: The period and prices of moving averages are considered by the author on the hourly chart H1 and differ from the general definition of the classic daily moving averages on the daily chart D1. Bollinger Bands In case of a decline, support will be provided by the lower border of the indicator around 1.0920 from which you can buy euros immediately on the rebound. Breaking the upper limit of the indicator in the area of 1.0972 will lead to larger growth of the pair. Description of indicators
|
| Trading recommendations for the EUR/USD pair on May 20, 2020 Posted: 20 May 2020 05:01 AM PDT From the point of view of complex analysis, we can see that a local slowdown occurred after a rapid movement downwards. Yesterday's trading resumed the previous movement, but only managed about 70 points. Afterwards, a pullback arose, and then slowed down. The flat in 1.0775 / 1.1000 has been formed for 1.5 months already. Before it, a compression occurred, which indicated the upcoming acceleration. Thus, the present compression of amplitudes led market participants to a sideways movement, possibly due to an impressive external background, which played on the emotional mood of market participants. Taking this flat as a signal of change in the market tact is debatable. As long as the upper border of the flat stands, everything will continue indicating a downward medium-term move. In order to see a clear signal of a change in the medium-term course, the quote needs to overcome March's high at 1.1150. However, such an occasion is very unlikely, since the chances of holding the position of bulls are much higher than a breakout in the border of the flat. When pursuing medium-term positions, do not forget about local operations, which currently bring significant income to traders. Analyzing yesterday's trading by minutes, we can see that the round of long positions, which locally resumed the movement, occurred at the start of the European session. As discussed in a previous review, market participants viewed the 1.1000 border as a level that would put pressure on market participants and resume a downward move. This process has somehow begun, but the concentration of quotes in the upper part of the flat remains in the market. In terms of volatility, a 12% slowdown relative to the average daily indicator was recorded. Since the slowdown is still within the permissible rate of market activity, the figure is still considered as normal. Analyzing the daily chart, we can see the frequency of fluctuations from the beginning of this year, which signals a strong impact on the market. The news published yesterday contained data on the volume of construction in Europe, which recorded a 15% decline, the strongest observed in more than eight years. Said data is still an indicator for March, so subsequent figures promise to be terrible. In the US, the data on construction was published in the afternoon, which revealed a 30.2% decrease in the volume of construction of new houses in April. Issued building permits also dropped by -20.8%. Market participants remain unresponsive to such statistics. Meanwhile, countries are beginning to gradually remove restrictive measures, but maintaned vigilance, due to the fears of a second wave of infections. At the beginning of the week, France and Germany put forward a proposal to create a € 500 billion fund aimed to the post-crisis economic recovery of the European Union. However, so far, only an emergency package of employment support worth €100 billion has been approved. Yesterday, US Secretary of Treasury Steven Mnuchin and Fed Chairman Jerome Powell faced the Senate Banking Committee, during which they reported on economic measures taken by the government in connection with the coronavirus. Senators asked questions about what measures were taken to support the economy, as well as what mistakes were made when allocating previously approved anti-crisis packages. The published interim forecast of the US Congressional Budget Office says that the efficiency of the US will decrease by 11% in the 2nd quarter [37.7% year on year] amid a loss of about 26 million jobs. Data on inflation in Europe was published today, where a decrease from 0.7% to 0.3% was recorded, slightly lower than the forecasted 0.4%. Based on a preliminary assessment, the market is already ready for such figures, so market reaction is practically non-existent at the time of publication of the data. Further development Analyzing the current trading chart, we can see a local slowdown in the region of 1.0920 / 1.0965, which became a temporary refuge after a local rapprochement in the upper border of the main flat 1.0775 / 1.1000. Market participants will continue to focus in this 1.5-month corridor, which will lead to the completion of the boundaries set. The downward movement also remains to be the main goal of traders, but for it to conclude, the quotes need to overcome the level of 1.0775. The upper limit of the main flat is due to pressure on market participants, which will lead to a consistent downward movement in the direction of 1.0775. Meanwhile, in the area of 1.0920 / 1.0965, local positions may be opened to trigger a breakout on the established boundaries. Based on the information above, we derived these trading ideas: - Consider buy positions above 1.0965, towards 1.0990. - Consider selling positions below 1.0915, towards 1.0850-1.0775. Indicator analysis Analyzing the different sectors of timeframes (TF), we can see that the indicators of technical instruments signal a bullish mood, attributed to the concentration of trading forces in the upper limit of the flat. Volatility per week / Measurement of volatility: Month; Quarter; Year The measurement of volatility reflects the average daily fluctuation calculated by Month / Quarter / Year. (May 20 was built, taking into account the time of publication of the article) The current volatility is 45 points, which is 47% lower than the average daily value. The breakout of the variable corridor, inside the flat, will lead to a local burst of activity. Key levels Resistance zones: 1,1000 ***; 1.1080 **; 1,1180; 1.1300; 1.1440; 1.1550; 1.1650 *; 1.1720 **; 1.1850 **; 1,2100 Support areas: 1.0850 **; 1.0775 *; 1.0650 (1.0636); 1,0500 ***; 1.0350 **; 1,0000 ***. * Periodic level ** Range Level *** Psychological level The material has been provided by InstaForex Company - www.instaforex.com |
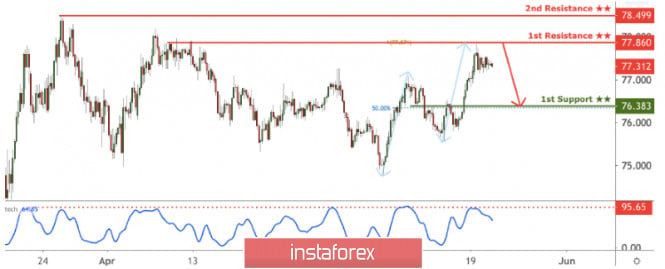
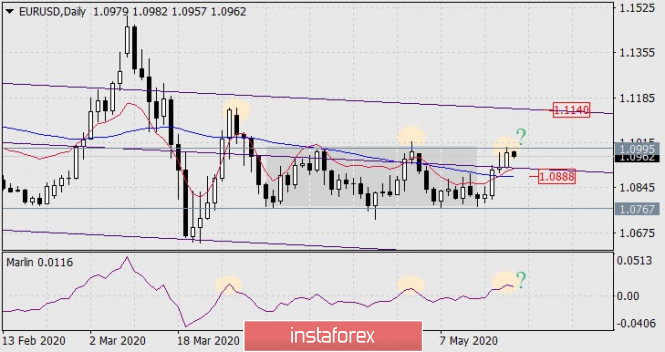
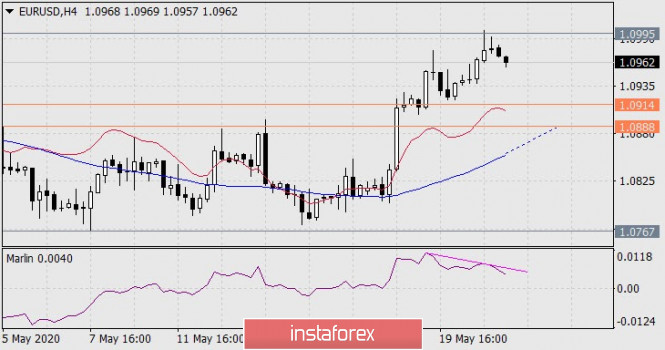
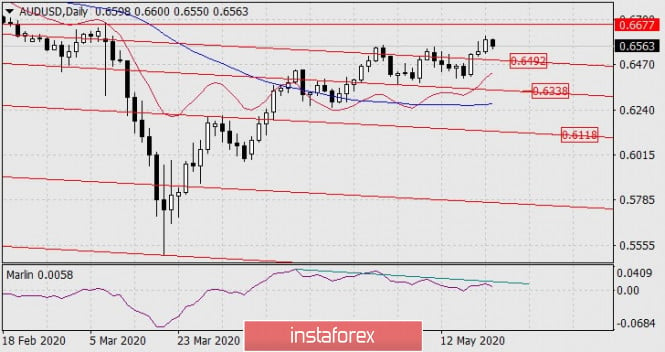
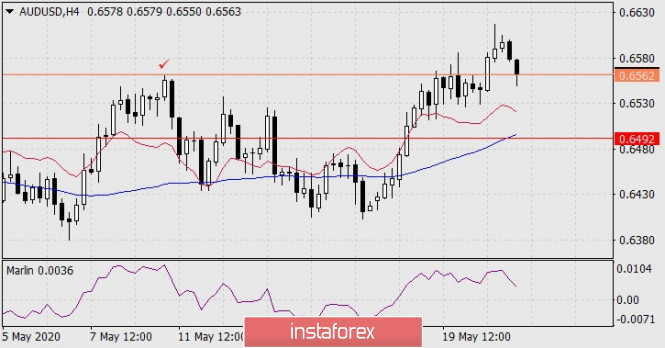
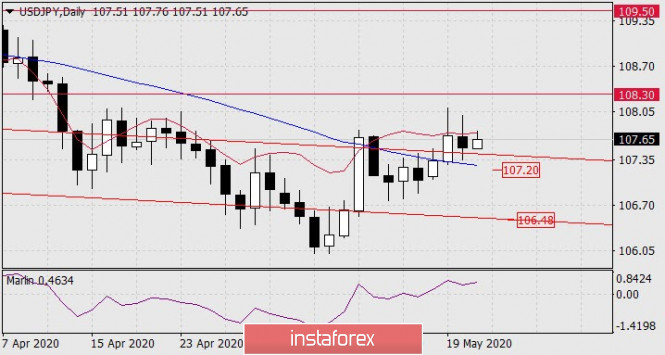
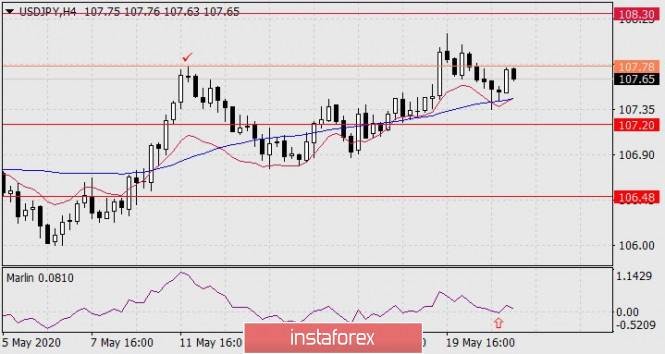
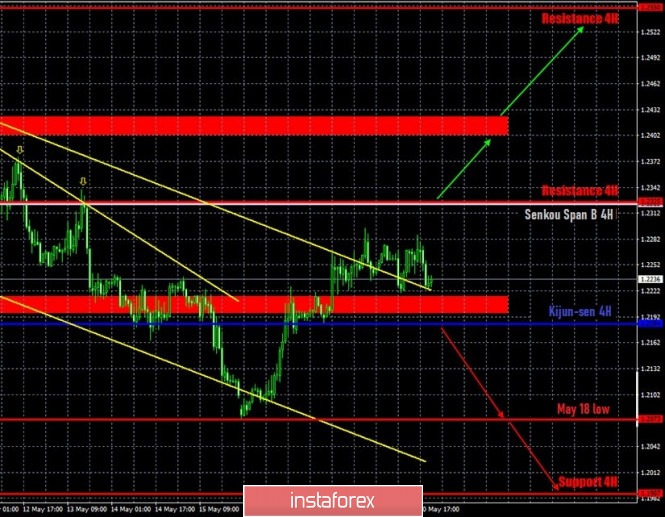
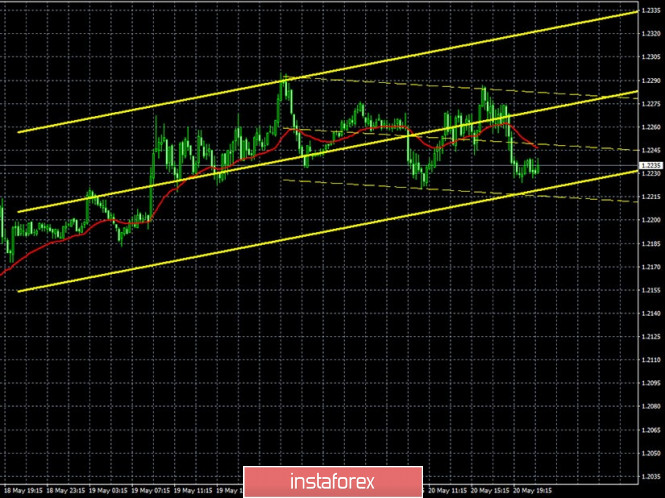
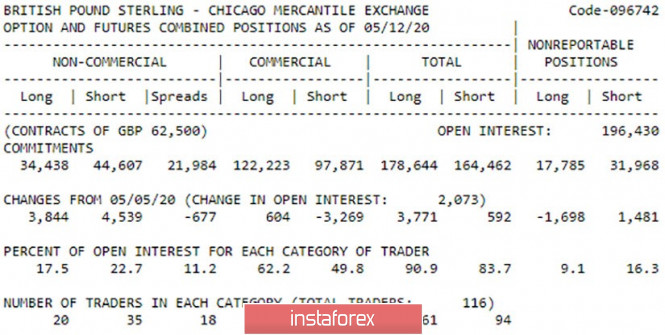
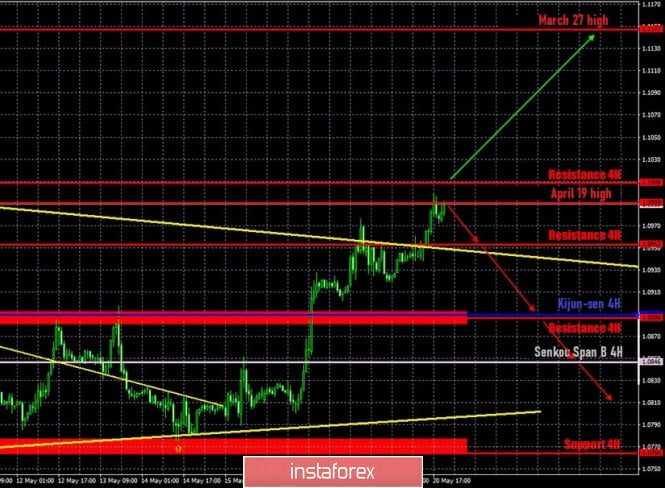
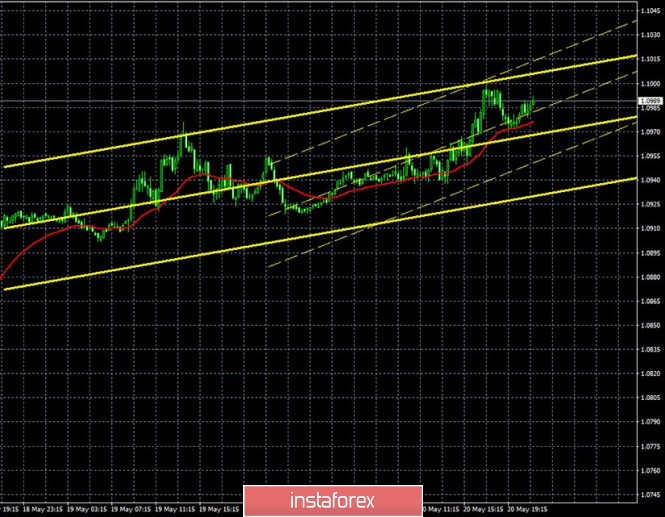
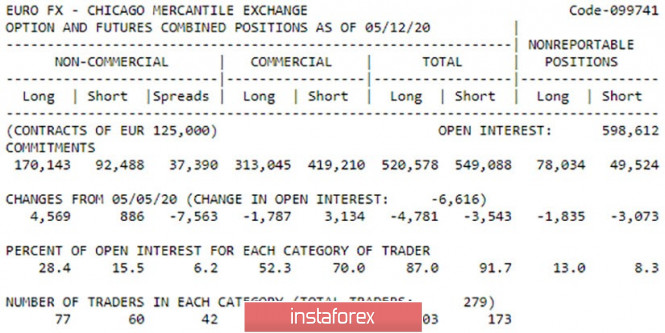
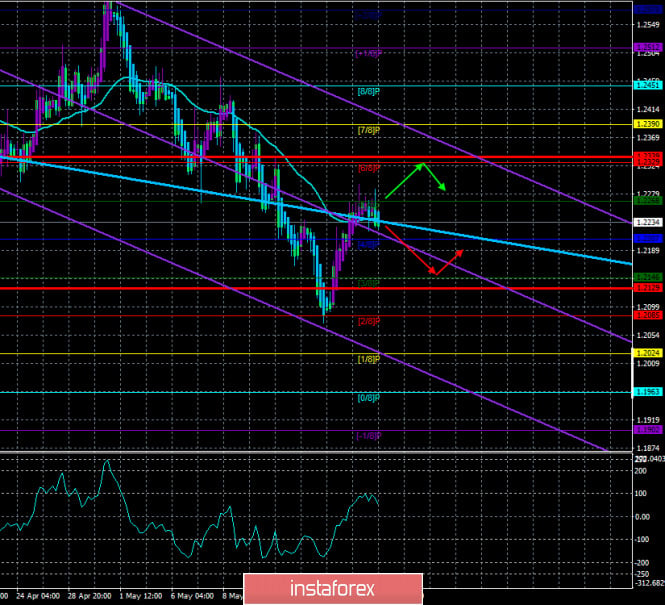
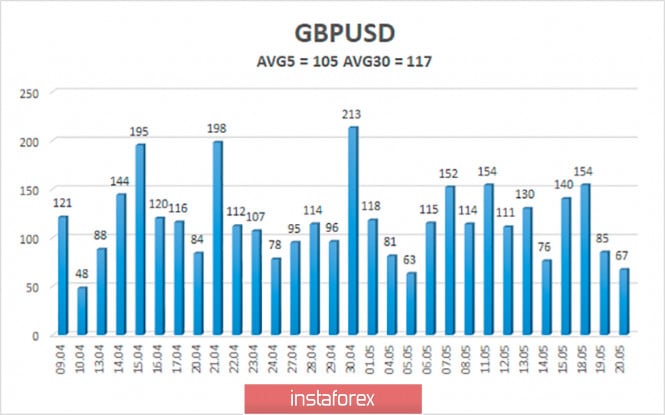
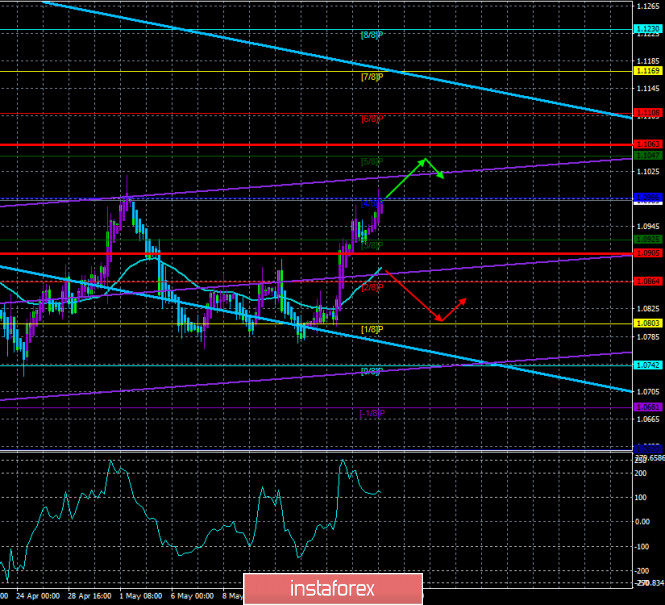
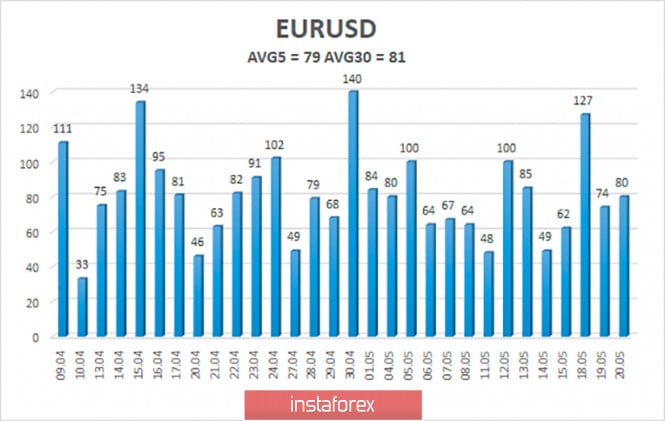


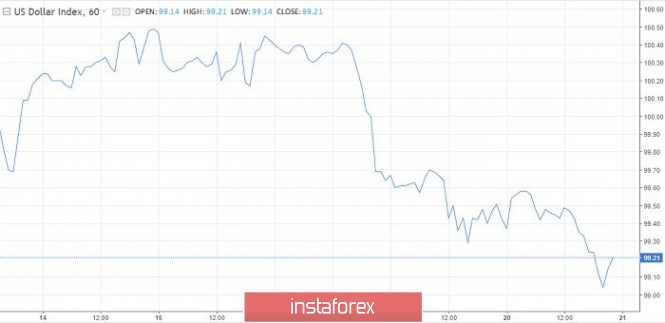
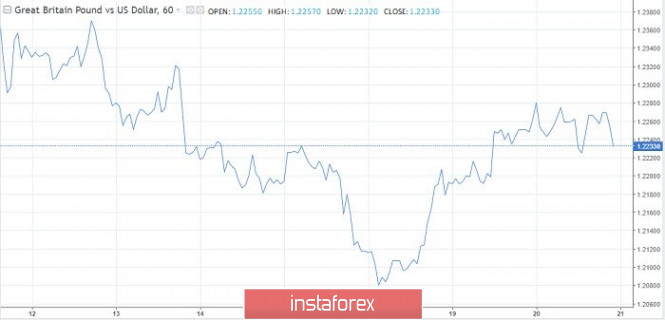

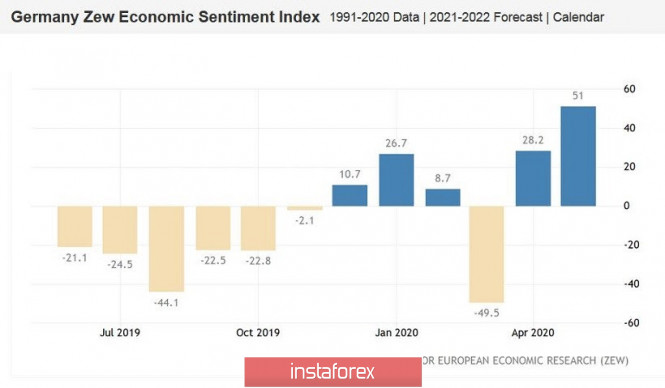
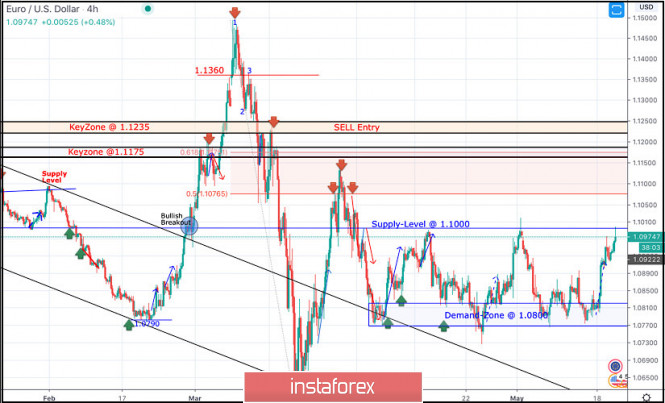
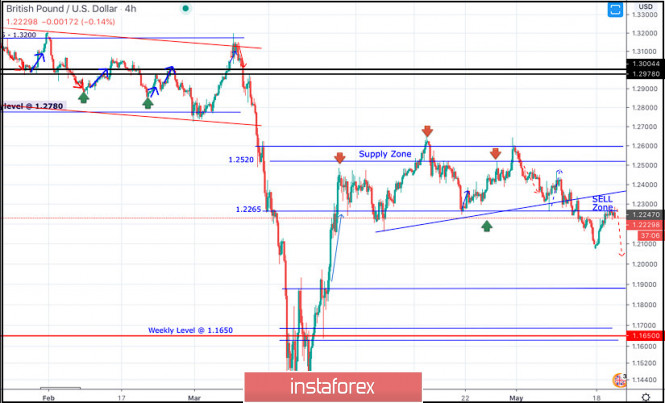

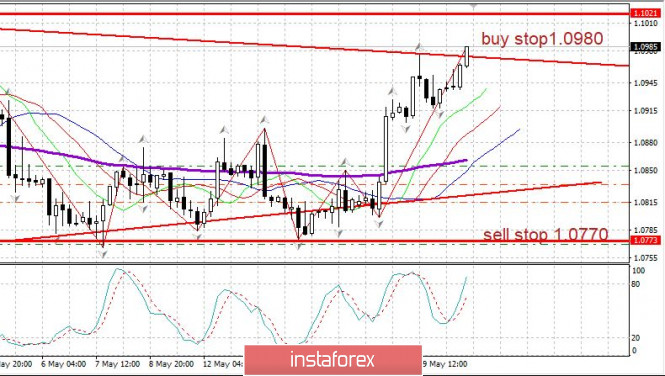
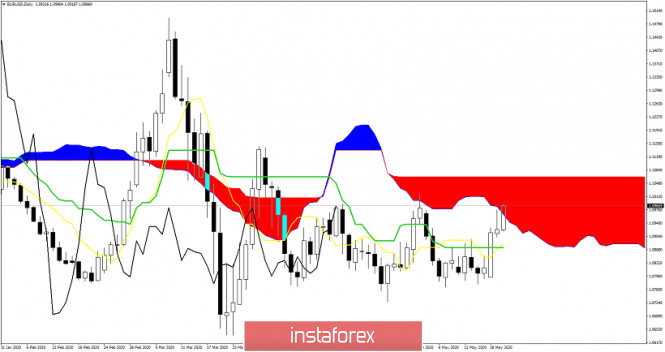
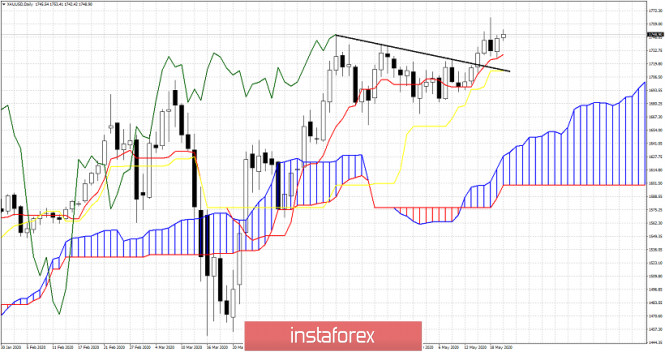
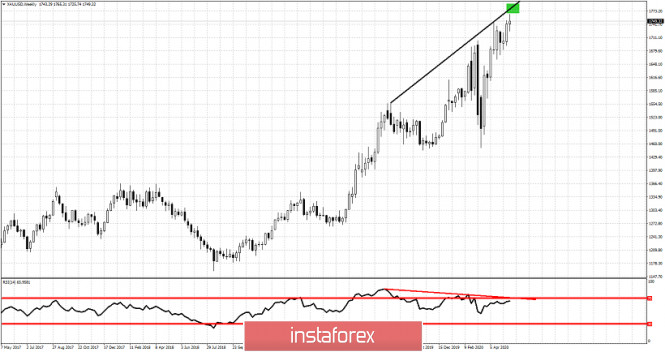


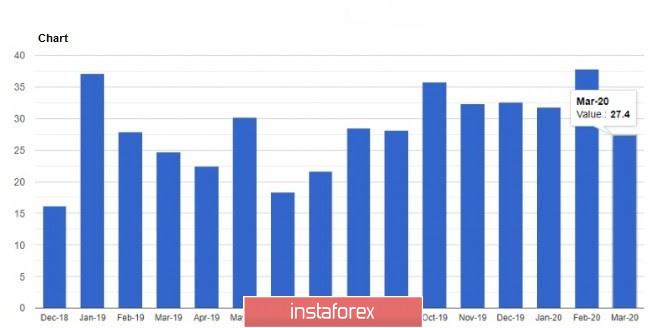
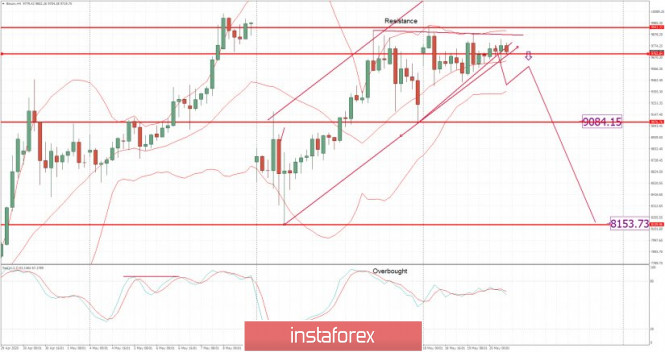
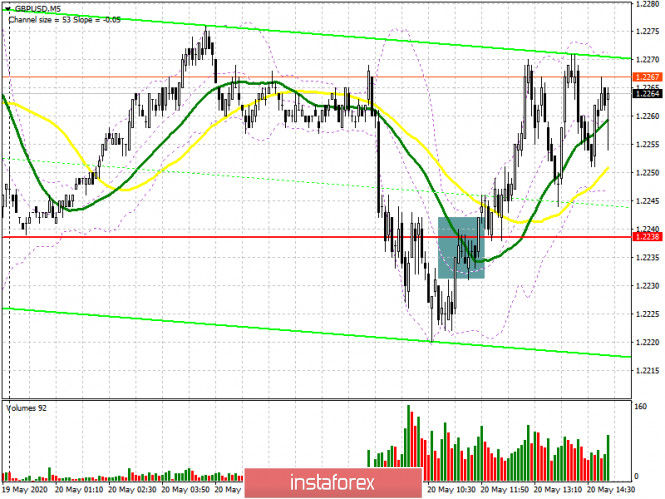
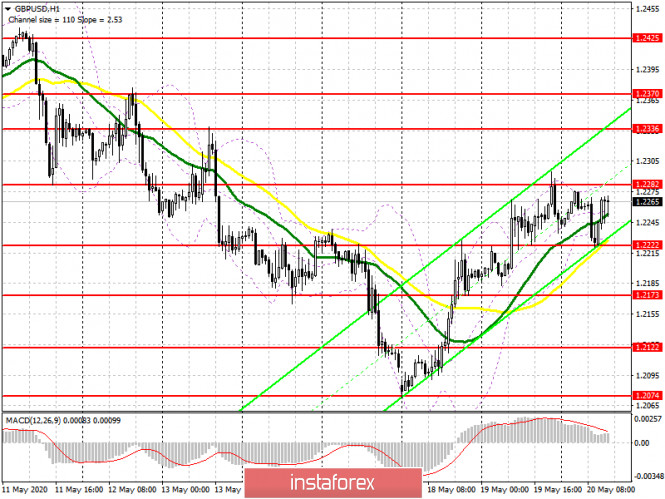
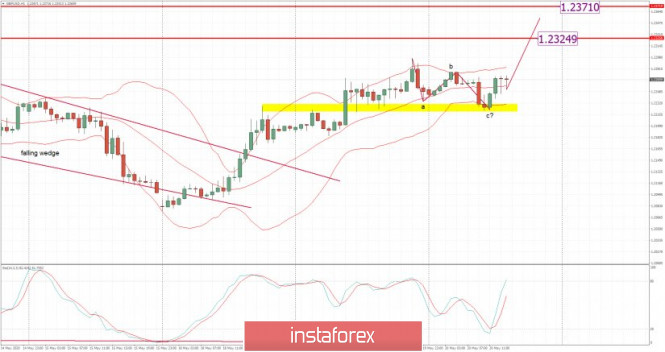
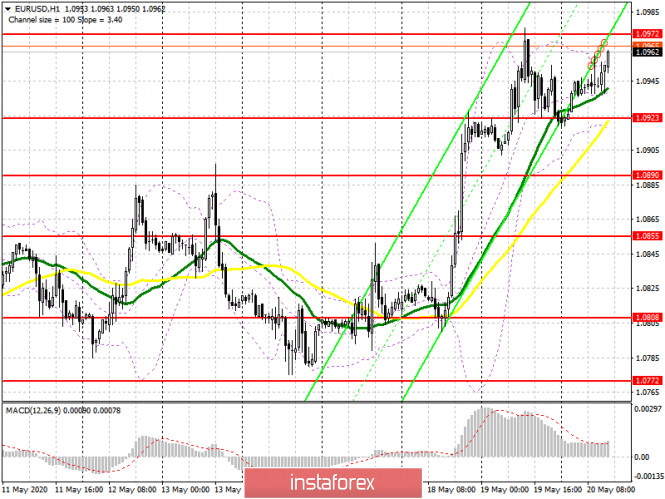
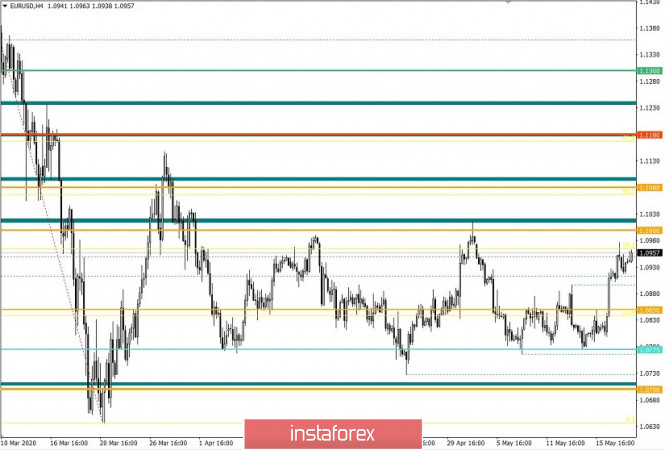
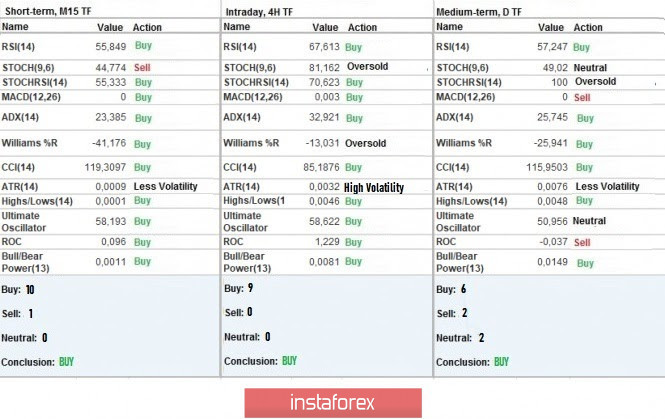
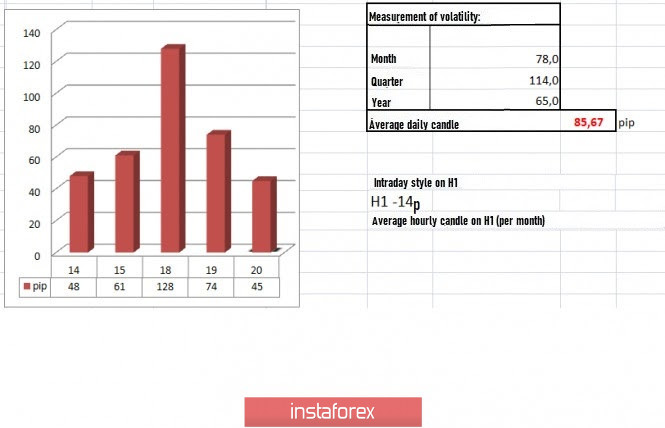
| You are subscribed to email updates from Forex analysis review. To stop receiving these emails, you may unsubscribe now. | Email delivery powered by Google |
| Google, 1600 Amphitheatre Parkway, Mountain View, CA 94043, United States | |
No comments:
Post a Comment