Forex analysis review |
- Short-term Ichimoku cloud indicator analysis of EURUSD
- Gold ends week lower but remains above key support
- #CL oil is too important to cost less than $20
- May 22, 2020 : EUR/USD Intraday technical analysis and trade recommendations.
- May 22, 2020 : GBP/USD Intraday technical analysis and trade recommendations.
- Comprehensive analysis of movement options for #USDX vs EUR/USD, GBP/USD, and USD/JPY (Daily) on May 26, 2020
- Pound ready to retest $ 1.20
- Precious metals found support
- US-China conflict disturbs stock markets
- Oil market began to sag
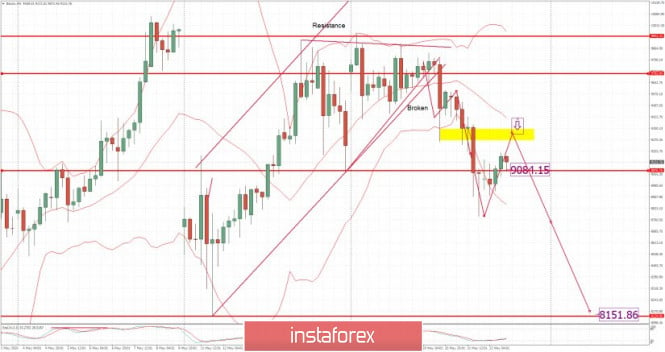
- BTC analysis for May 22,.2020 - First downward target at the price of $9.085 has been reched. Potential for test of second
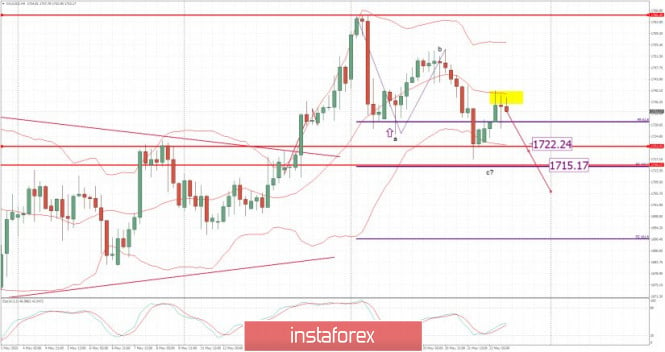
- Analysis of Gold for May 22,.2020 - Resistance at the price of $1.740 is on the test. Watc hfor potential rototation downside
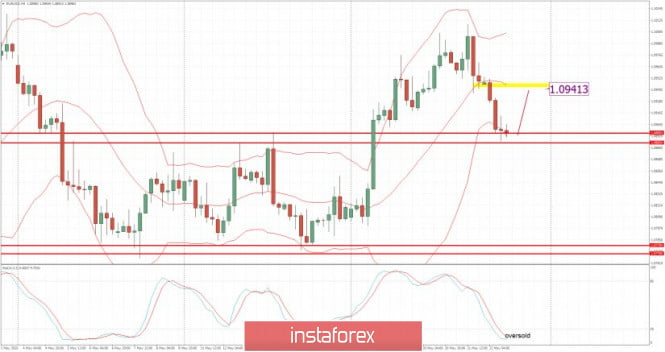
- EUR/USD analysis for May 22, 2020 - Rejection of the support at the price of 1.0890. Upside movement is expected towards
- Euro hold its side
- Trading recommendations for the GBP/USD pair on May 22, 2020
- GBP/USD: plan for the American session on May 22 (analysis of morning deals). Bears put pressure on the pound and trying
- EUR/USD: plan for the American session on May 22 (analysis of morning deals). The euro continued to fall before the ECB minutes.
- Analysis and forecast for EUR/USD on May 22, 2020
- EUR/USD: Euro rally stopped; hopes for a rapid recovery in the global economy were not enough
- Analysis and forecast for EUR/GBP on May 22, 2020
- Trading plan for EUR/USD on May 22, 2020. A third wave of COVID-19 is brewing in Brazil, India and Peru. The situation in
- Trader's diary for May 22, 2020
- USD/CHF Tide Was Turned!
- Instaforex Daily Analysis - 22nd May 2020
- Analysis and forecast for USD/CAD on May 22, 2020
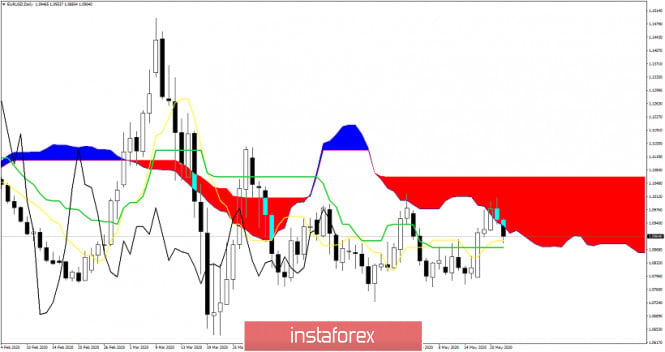
| Short-term Ichimoku cloud indicator analysis of EURUSD Posted: 22 May 2020 12:27 PM PDT EURUSD has broken below the Daily Kumo (cloud) today and has stopped its decline right above the tenkan-sen.The inability to break above the Daily Kumo combined with the break below the cloud is a bearish sign. If this is followed by a close below the kijun-sen at 1.0870 then bulls are in trouble.
|
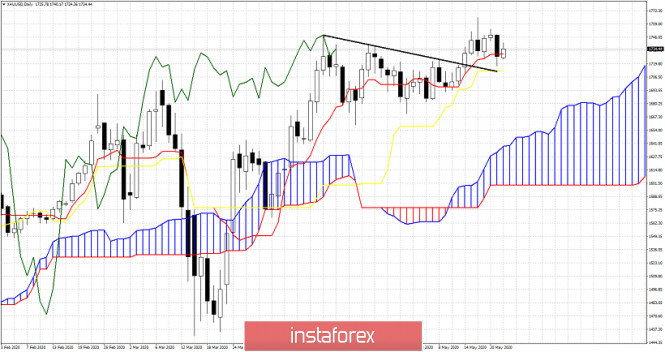
| Gold ends week lower but remains above key support Posted: 22 May 2020 12:20 PM PDT Gold price tried to close above $1,750 this week but price came back towards $1,720-10 support. Although our short-term outlook for a move towards $1,770-80 partially played out, we remain cautious as the weekly chart shows warning signs. Although it was expected for Gold price to move above $1,750 after breaking above $1,720, Gold price in the area of $1,750 is oversold while at the same time the RSI is diverging. Traders should not ignore this.
In Ichimoku cloud terms Gold price remains above key short-term support indicators. The tenkan-sen has risen to $1,729 while the kijun-sen support is at $1,712. As long as price is above these two levels, short-term trend remains bullish and we continue to expect price to reach $1,770-80. Failure to hold these two levels will increase the chances for a pull back towards $1,650. The material has been provided by InstaForex Company - www.instaforex.com |
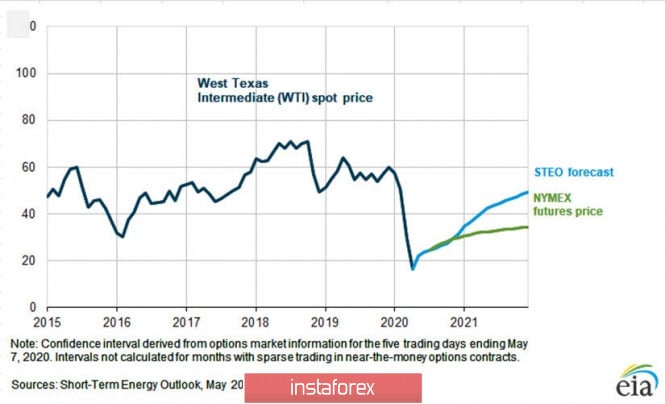
| #CL oil is too important to cost less than $20 Posted: 22 May 2020 11:09 AM PDT Dear colleagues. The fall of oil quotes into the negative zone caused a serious commotion not only on world exchanges and the information space, but also in the minds of investors. What until recently was unbelievable has become a reality. However, negative prices cannot be the norm, and on the eve of the car season, oil experienced a rapid recovery and now has good chances to gain a foothold at current values and possibly increase. Saudi Arabia, which decided to fight on two fronts, suffered a crushing defeat. Initially, it was believed that Russia had declared a price war to the whole world, having decided to withdraw from the OPEC+ deal, but the actions of the Saudis aimed at squeezing out the Russian market share in Europe and at the same time squeezing American shale producers on their territory enraged the executive and US legislature. Crown Prince Muhammad bin Salman, who had previously had a lot of things to do, fell out of favor with the Donald Trump administration, who threatened the Royal House of Saudi with refusal of military support and other punishments, up to the arrest of accounts and property. Thus, the agreement between the US and Saudi Arabia, concluded back in the distant 45th year of the last century, ceased to exist. At the end of World War II, U.S. President Franklin Delano Roosevelt and King of Saudi Arabia Abdel Aziz entered into an agreement assuming that the United States would receive the necessary amount of oil, guaranteeing the security of the Saudi ruling house in return. However, the kingdom violated this treaty at least three times, which happened in 1973, 2016 and 2020. In 1973, during the Arab-Israeli war of Yom Kippur, the Saudis put pressure on OPEC members and the countries that joined them to impose an embargo on oil supplies to the United States, Britain, Japan, Canada and the Netherlands. Then, by March 1974, the price of oil had quadrupled, rising from $3 to $12 per barrel, and despite the truce that followed, seeds of distrust between the allies were sown, which did not prevent them from actively cooperating. Since then, the United States has dreamed of getting rid of energy dependence, and when the American shale industry began working with natural gas in 2006, they got a window of opportunity that they took advantage of. In 2010, the development of oil sands began, which by the end of the decade made the United States a world leader in producing oil and liquefied gas, in a relatively short time, turning the country from an importer to an exporter of energy resources. Thanks to daily oil production of 13.5 million barrels, the United States took first place in the world in production, most of which, namely 60-70%, accounted for shale producers. Having freed itself from oil dependence, America finally got the opportunity to impose sanctions against objectionable oil producing countries such as Iran and Venezuela, without fearing for its own energy security. Given this geopolitical component, we can safely assume that, having a printing press at its disposal, the United States will never capitulate to oil quotes in a war. Therefore, it is not surprising that the actions of Crown Prince Salman, who was encroaching on the holy, caused the wrath of the US establishment, and the main culprit of the oil crash was the country's royal house-gas stations. However, the Saudis, as they say, bit the bit. The Saudi sheikhs did not understand or perhaps did not take seriously the warnings coming from Washington. In early April, they sent an armada of oil tankers to the United States, which was perceived by the White House as a direct threat to the US economy and security, while the country struggled with the COVID-19 epidemic. The US shale industry was too important to be ruined. US politicians simply cannot allow OPEC to manipulate oil prices, which are critical for the kingdom. According to some reports, the price of oil required by Saudi Arabia to fulfill budgetary obligations is at least $84 per barrel, while Russia needs $42. The problem of the Saudis is that they also started a price war in the year of the presidential election, when the US administration faces a dilemma: where, on the one hand, the shale industry, which provides up to 10% of GDP, and on the other hand, US consumer spending. Where every cent of the gallon of fuel costs takes $1 billion out of citizens' pockets. Thus, the Trump administration cannot allow an increase in oil prices above $70, but nobody is going to bankrupt the shale industry to please the Saudi sheikhs either. At the most difficult moment, as usual, speculators came to the aid of oil prices, read - private investors. Even before the price of WTI oil became negative, ordinary citizens of the country began to invest in the United States Oil - USO stock exchange fund, which is one of the main holders of futures contracts on the CME exchange. By mid-May, the number of long positions of Money Manger, which are the main buyers of oil, increased by 85%, to 373,000 contracts, which became the highest value since October 2018. This served as a driver for the rapid recovery of oil quotes, which in May reached $35 for the WTI #CL grade. Brent oil quotes soared even higher. Naturally, recovery is never straightforward, and before the price of oil enters a stable trajectory, quotes may decline under the influence of market negative factors. In this regard, after such a rapid growth, we can very well expect the correction of WTI #CL oil to the level of $29 or even $25. However, it is unlikely that we should again assume a deep drop in oil prices below $ 20. Figure 1: Short-term WTI Oil Price Forecast In its short-term energy forecast published last week, the US Energy Information Agency - USEIA suggested that 2020 Brent crude oil prices would reach $34 per barrel. The EIA expects that prices will average $23 per barrel in the second quarter of 2020, and then increase to $32 in the second half of the year. The EIA predicts that Brent crude oil prices will rise to an average of $48 per barrel in 2021, as the decline in global oil reserves will put increasing pressure on quotes. Pointing to great uncertainty, the agency suggests the restoration of the price of WTI varieties to the level of $34 only in December 2020. At the same time, speaking about the current oil production in the US, the US EIA assumes a drop in production of only 800,000 barrels per day, which, as we understand it, cannot have a significant impact on shale oil. At the same time, not long ago, there was an opinion in the markets that the break-even price for US shale producers should be about $70 per barrel. However, for promising wells, the cost price can be as low as $30-35, and with the development of technologies it can become even lower. On the whole, very little time will pass, and if prices reach a stable growth area above $30, the US shale industry will quickly recover. Two or three months is enough for everything to work, as before. In terms of price levels, $25-30 is enough for the industry to come to life. Now the shale oil market is entering a phase of mergers and acquisitions when large producers such as Exxon, Chevron, BP, Shell and Total, begin to acquire small producers and integrate them into their business model. At the same time, the US is not limited by OPEC++ agreements and can continue to capture markets, relying on a geopolitical strategy of domination, creating problems for its competitors. Be careful and cautious, follow the rules of money management. Let the coronavirus pass us! The material has been provided by InstaForex Company - www.instaforex.com |
| May 22, 2020 : EUR/USD Intraday technical analysis and trade recommendations. Posted: 22 May 2020 10:47 AM PDT
Few weeks ago, the EURUSD pair has expressed remarkable bullish recovery around the newly-established bottom around 1.0650. Bullish engulfing H4 candlesticks as well as the recently-demonstrated ascending bottoms indicated a high probability bullish pullback at least towards 1.0980 and 1.1075 (Fibo Level 50%). Around the price zone between (1.1075-1.1150), a bearish Head & Shoulders pattern was demonstrated. That's why, Further bearish decline was demonstrated towards 1.0800 where the nearest demand level to be considered was located near the backside of the broken channel (1.0800-1.0750). Evident signs of Bullish rejection have been manifested around the price zone of (1.0800-1.0750) leading to the recent bullish spike up to 1.0990. The short-term technical bullish outlook remains valid as long as bullish persistence is maintained above the recently-established Demand Zone around 1.0770. On May 1, Lack of bullish momentum around 1.1000 lead to another bearish decline towards the depicted price zone around 1.0800. However, the price zone of (1.0815 - 1.0775) has been standing as a prominent Demand Zone providing quite good bullish support for the pair so far. Currently, bullish breakout above 1.1000 is needed to enhance further bullish advancement towards 1.1075 and 1.1175. On the other hand, any bearish breakdown below 1.0770 should be marked as an early Exit signal for all short-term BUY trades. Trade recommendations : Intraday traders are advised to wait for bullish breakout above 1.1000 as a valid BUY signal. T/P levels to be located around 1.1075 then 1.1175 if sufficient bullish momentum is maintained while S/L to be located below 1.0950. The material has been provided by InstaForex Company - www.instaforex.com |
| May 22, 2020 : GBP/USD Intraday technical analysis and trade recommendations. Posted: 22 May 2020 10:34 AM PDT
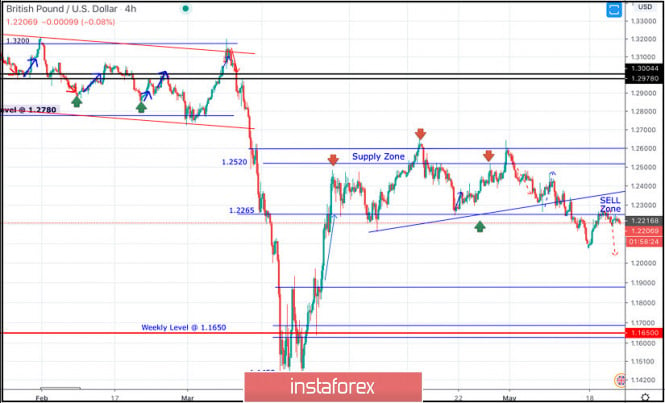
Recently, Bullish persistence above 1.2265 has enhanced another bullish movement up to the price levels of 1.2520-1.2590 where significant bearish rejection as well as a quick bearish decline were previously demonstrated (In the period between 14th - 21 April). Currently, Atypical Bearish Head & Shoulders reversal pattern may be in progress. The pair was recently demonstrating the right Shoulder of the pattern. Hence, Bearish persistence below 1.2265 (Reversal Pattern Neckline) was needed to confirm the pattern. Thus, enhance another bearish movement towards 1.2100, 1.2000 then 1.1920. By the end of Last Week, Intraday traders were advised to wait for bearish pullback towards the price levels of 1.2300-1.2280 where a low-risk short-term BUY trade could be taken. The recently demonstrated Lower High around 1.2440 endangered the previously-mentioned short-term bullish scenario. That's why, the price zone of 1.2300-1.2280 failed to provide enough bullish support for the pair. Thus, the suggested short-term BUY trade was invalidated shortly after. The current bearish breakdown below 1.2265 should be taken into consideration as it confirms the previously-mentioned reversal-top pattern. Hence, further bearish decline would eventually be enabled towards 1.2020 as a projection target for the reversal pattern. Currently, the price zone of 1.2265-1.2300 (Backside of the broken Uptrend) stands as a recently-established SUPPLY-Zone to offer bearish rejection and a valid SELL Entry for the pair in the short-term. Trade recommendations : Intraday traders can consider the current bullish pullback towards 1.2265-1.2300 as a valid SELL Entry. T/P level to be located around 1.2150, 1.2100 and 1.2000 while S/L should be placed above 1.2350. The material has been provided by InstaForex Company - www.instaforex.com |
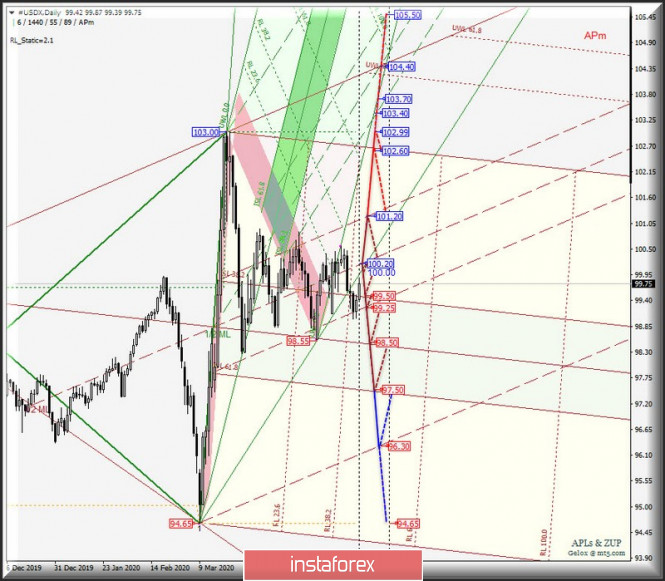
| Posted: 22 May 2020 09:34 AM PDT Minor operational scale (Daily) What threatens the last week of May and the beginning of summer with the main currency instruments? Development options for the movement #USDX vs EUR/USD, GBP/USD, and USD/JPY (Daily) on May 26, 2020. ____________________ US dollar index From May 26, 2020, the movement of the dollar index (#USDX) will continue to be determined by working out the boundaries of the 1/2 Median Line channel (101.20-100.20-99.25) of the Minor operational scale - details of movement within this channel are shown on the animated chart. A breakout of the lower border of the channel 1/2 Median Line Minor - support level of 99.25 - will confirm the further development of the movement of the dollar index in the equilibrium zone (99.50-98.50-97.50) of the Minor operational scale fork with the prospect of achieving the ultimate Shiff Line Minor (96.30). The breakdown of the upper border of the channel 1/2 Median Line of the Minor operational scale fork - resistance 101.20 - will be important to the continuation of the upward movement #USDX to the starting line SSL (102.60) of the Minor operational scale fork and a maximum of 102.99. The layout of the #USDX movement options from May 26, 2020 is shown on the animated chart.
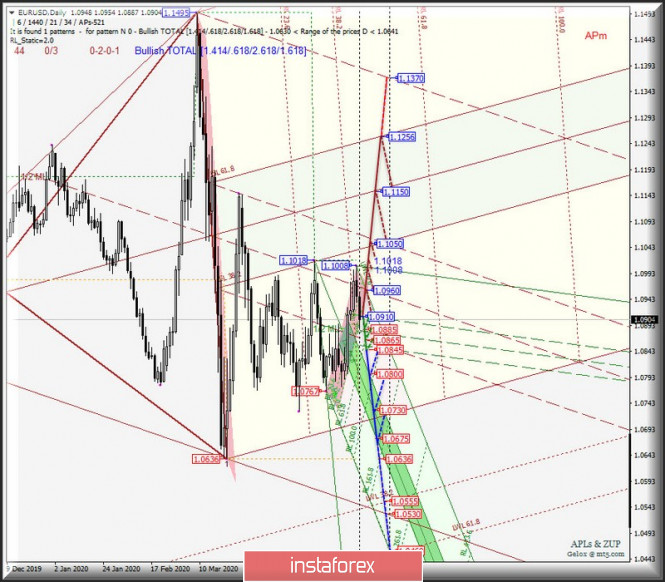
____________________ Euro vs US dollar From May 26, 2020, the single European currency EUR/USD will continue to develop the movement depending on the development and direction of breakdown of the channel boundaries 1/2 Median Line (1.0910-1.0885-1.0845) of the Minuette operational scale forks - details are shown in the animated chart. If the upper limit of the 1/2 Median Line channel is broken, the Minute - resistance level of 1.0910 - the further development of the movement of the single European currency will occur within the borders of the 1/2 Median Line channel (1.0865-1.0960-1.1050) and equilibrium zones (1.1050-1.1150-1.1256) of the Minor operational scale fork. If the support level of 1.0845 breaks at the lower border of the channel 1/2 Median Line Minute, the downward movement of EUR/USD can be continued to the borders of the equilibrium zone (1.0800-1.0730 - 1.0675) of the Minuette operational scale fork. Options for EUR/USD movement from May 26, 2020, depending on the processing of the channel 1/2ML Minute are shown on the animated chart.
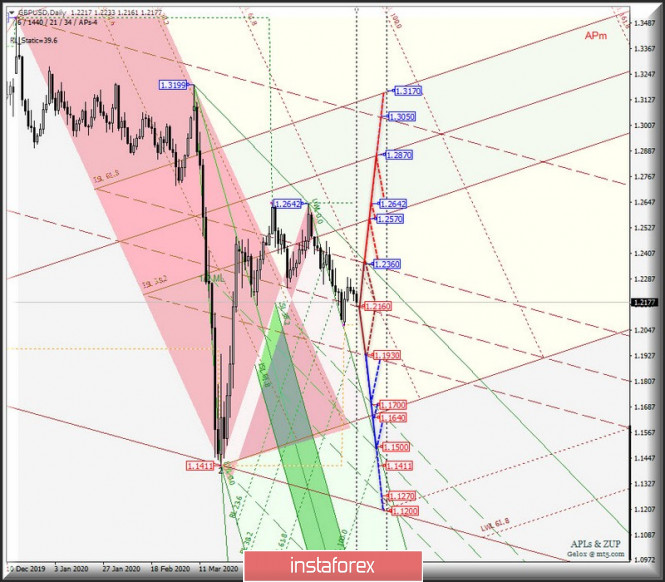
____________________ Great Britain pound vs US dollar The development of the movement of Her Majesty's currency GBP/USD from May 26, 2020 will be due to the development and direction of the breakdown of the boundaries of the 1/2 Median Line channel (1.2360-1.2160-1.1930) of the Minor operational scale fork - marking of movement within this equilibrium zone is shown in the animated chart. When the upper border of the channel is broken 1/2 Median Line Minor - resistance level 1.2360 - the movement of Her Majesty's currency can be continued to the borders of the equilibrium zone (1.2570-1.2870-1.3170) of the Minor operational scale fork. If there will be a breakdown of the lower border of the channel 1/2 Median Line in the Minor operational scale - support level 1.1930 - then the downward movement of GBP/USD can be continued to the borders of the channel 1/2 Median Line (1.1700-1.1500-1.1270) of the Minuette operational scale fork. From May 26, 2020, we look at the GBP/USD movement options on the animated chart.
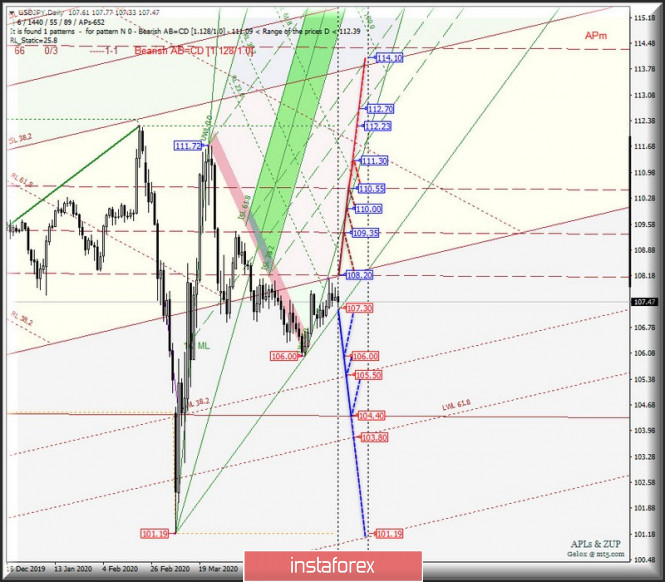
____________________ US dollar vs Japanese yen Range development and breakdown direction:
Breakdown of the LTL control line of the Minuette operational scale fork -support level 107.30 - an option to continue the development of the downward movement of the currency of the "Land of the Rising Sun" to the goals:
If the resistance level of 108.20 is broken, the USD/JPY movement will continue in the 1/2 Median Line channel (108.20-109.35-110.55) of the Minor operational scale fork with the prospect of reaching the boundaries of the 1/2 Median Line channel (111.30-112.70-114.10) of the Minuette operational scale fork. The markup of the USD/JPY movement options from May 26, 2020 is shown on the animated chart.
____________________ The review is compiled without taking into account the news background, the opening of trading sessions of the main financial centers, and is not a guide to action (placing "sell" or "buy" orders). Formula for calculating the dollar index: USDX = 50.14348112 * USDEUR0.576 * USDJPY0.136 * USDGBP0.119 * USDCAD0.091 * USDSEK0.042 * USDCHF0.036. Where the power coefficients correspond to the weights of currencies in the basket: Euro - 57.6 %; Yen - 13.6 %; Pound - 11.9 %; Canadian dollar - 9.1 %; Swedish Krona - 4.2 %; Swiss franc - 3.6 %. The first coefficient in the formula brings the index value to 100 on the starting date - March 1973 when the main currencies began to be freely quoted relative to each other. The material has been provided by InstaForex Company - www.instaforex.com |
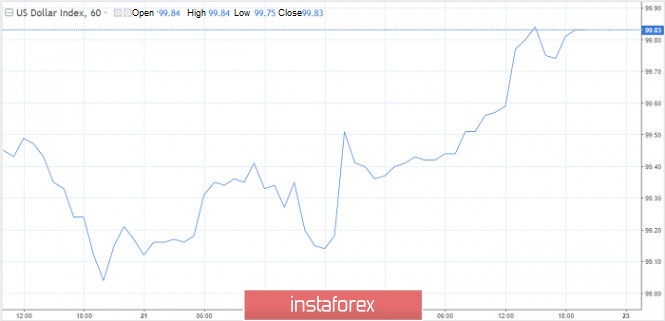
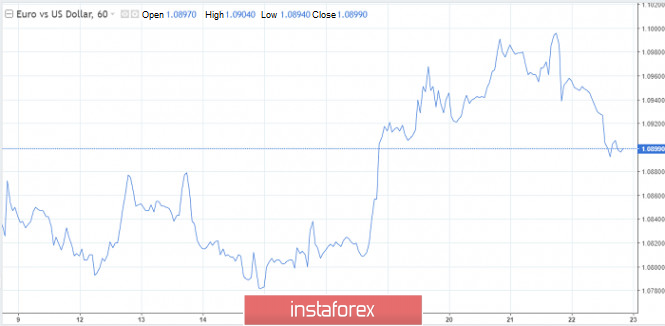
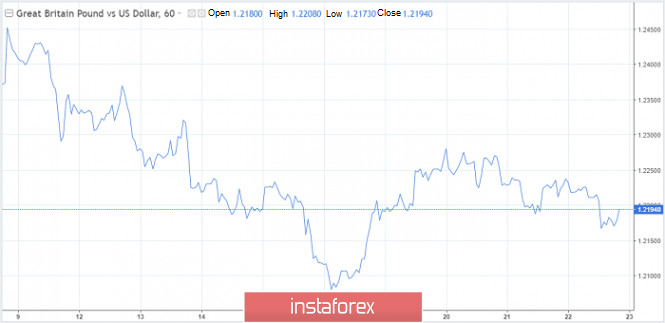
| Posted: 22 May 2020 08:17 AM PDT The US dollar again had the opportunity to take advantage of its protective functions, and China helped in this, which introduced an injection of reality into the markets while angering the US. As the US-China conflict continues to boil, the price of the dollar begins to rise. On Friday, it strengthened quite well to a basket of competitors, gaining back some of its losses. At US trading, its rate against major competitors rose by 0.5% and buyers tried to push the dollar index above the psychological mark of 100. USDX Tensions between the US and China will continue, at least in the short term, and the dollar will go up especially in relation to currencies such as the euro, the pound, and the offshore yuan. Nevertheless, a trade deal between large partners will be reached sooner or later, since it is in the interests of both parties, they give a cautious forecast at Mizuho Bank. The rapid buildup of financial assistance from the United States draws not in favor of the US dollar itself. Such support for a pandemic-affected economy could lead to dollar devaluation and fluctuations in other markets. Meanwhile, the euro, which came under pressure from a strengthening dollar, could not stay near the key level of $ 1.10. This forced traders to review long positions in the euro. EUR / USD Meanwhile, the forecast for the pound remains unchanged. The trend is down and nothing else. Regular market talks about QE and lowering rates in the UK to negative values seem to turn into realistic expectations. The Bank of England intends to take this step since the April rate cut from 0.75% to 0.1% did not bring the desired results. It is worth paying attention to the fact that the head of the Central Bank of England, Andrew Bailey, who was an opponent of negative rates, suddenly changed its perspective. Bailey made it clear to the markets that such an opportunity is being discussed and a negative rate has the right to life. Against this background, the pound is expected to further decline. In the short term, the GBP / USD pair is set to retake the level of 1.20. GBP / USD An additional negative for the pound is that Britain will not extend the transition period. Pressure on sterling will increase in anticipation of the expiration in June of the deadline for extending the Brexit transition period, predicted by Bank of America. Most tangibly, it can sink to the euro, Swiss franc, and Japanese yen. It is possible that the British currency will face a sharp narrowing of profitability spreads between the UK and other G10 countries. This is due to the fact that the Bank of England is seriously considering the introduction of negative interest rates in the country. The material has been provided by InstaForex Company - www.instaforex.com |
| Posted: 22 May 2020 07:48 AM PDT
The precious metals market has experienced positive dynamics today against the backdrop of the conflict that is growing between the United States of America and China. Investors were under pressure and decided to turn to a safer sector which is the gold market. However, today's support, most likely, will not save the precious metal from falling in the weekly indicator. Recall that during the current week, gold was under serious pressure from positive statistics on the growth of key economic indicators, which in turn followed the lifting of quarantine measures related to the COVID-19 pandemic. This morning, on the trading floors, the price of gold rose by 0.84% and reached the level of $ 1,736.45 per troy ounce. However, yesterday it closed with a loss of 1.4%, which, of course, has not yet been compensated for today. The metal support level was at $ 1,715.30 per troy ounce, and the resistance level was at $ 1,775.80, respectively. Nevertheless, fundamental indicators continue to provide good support to gold. So, an increase in production activity began to be recorded in the European countries, as well as the US. Yesterday's PMI data were higher than the previous ones. The tension between the world's largest economies, the United States and China, adds fuel to the fire. As the conflict escalates, the price of precious metals will increase, because market participants in such an uncertain situation will want to preserve their assets. Other precious metals at today's auction so far showed multidirectional dynamics. Thus, silver futures for July delivery rose in price at Asian trading by 0.63%, which allowed the precious metal to gain a foothold at around 17.473 dollars per troy ounce. This is contrary to what happened in European trading which slowed down by 0.25% and began to cost 17.02 dollars per troy ounce. Palladium also reduces its value by 1.91% and falls to the mark of 1 975.06 dollars per ounce. The price of platinum creeps down 0.6%, which pushes it to the level of 827.41 dollars. Copper futures for July delivery are also negative with value reduced to $ 2,377 per pound, indicating a decrease of 2.26%. The material has been provided by InstaForex Company - www.instaforex.com |
| US-China conflict disturbs stock markets Posted: 22 May 2020 07:47 AM PDT
The European stock market began with a negative on Friday. Major stock indexes show a reduction in their positions against the backdrop of an escalation of tension between the US and China. This new tension was due to the intention of the Chinese authorities to ratify the bill on ensuring the national security of Hong Kong. The Stoxx Europe 600 largest enterprises index began to decline in the morning, and so far its decline has reached 1.46%, which brought it to the level of 335.29 points. The UK FTSE 100 index fell by 1.71%, German DAX by 1.14%, and France's CAC Index by 1.08%. Indices from Italy and Spain lost the least so far, the FTSE MIB fell by -0.63% while the IBEX 35 fell by -0.60%. As for corporate news, the most serious drop was recorded in the banking sector. HSBC Holdings fell by 5.1%, Standard Chartered fell 4.4%, and Prudential immediately dropped 7.9%. Lloyds Banking Group recorded a decline of 1.2% after an unexpected problem with the payment of planned bonuses to management. Securities of Deutsche Lufthansa AG, on the contrary, showed growth by 1.6%. This is due to the news about the possible transfer of a 25% stake plus 1 share in the hands of WSF in exchange for financial assistance totaling approximately 9 billion euros. Market participants were impressed by what was happening in China. Today it became known that the government is considering a bill that should ban separatist activities, support the fight against terrorism, and also eliminate external influence. The US government responded to this immediately by putting forward a document with the expansion of sanctions against China. Among other things, the moment was very exciting that many Chinese companies in the near future can leave the American stock exchanges due to a ban by the US authorities. Thus, China will lose the opportunity to attract investors from America, which in itself is a serious threat to the economy. In addition, statistics were released this morning that reflected the fall in the UK consumer confidence index this month. To date, it has taken the lowest mark in the last ten years. This becomes evidence that the removal of quarantine measures related to the COVID-19 pandemic could not protect consumers from pessimism in the market. AT present, the index has declined to 34 points compared with data two days ago with a decline of 33 points. Stock indices in the Asia-Pacific region also remain in the red zone which is mainly also due to the conflict between the USA and China. The Hong Kong stock market showed the most significant reduction. This is not surprising since the news about the national security law excited investors. Japan's Nikkei 225 index fell by 0.9%, while the Topix index fell by 1%. The corporate sector recorded multidirectional dynamics. Securities of SoftBank Group Corp. increase in value by 3% which are followed by shares of Advantest Corp., with an increase of 1.2%. The largest electronics manufacturer Sony, by contrast, lost 0.4%. China's Shanghai Composite Index shows a decline of 1.9%, while the Hong Kong index is rapidly collapsing by 5.4%. The South Korean Kospi Index is also negative which lost 1.7%. The same trend can be seen in the corporate market Samsung Electronics Co. which fell by 2.6%, the largest car manufacturer Hyundai Motor also fell by 3.1%. Australia's S & P / ASX 200 Index is down by 1%. At the same time, shares of the largest mining companies BHP and Rio Tinto are getting cheaper by 0.9% and 2.4%, respectively. The black bar also lays on the US stock market, which reflects a general downward trend. Here, too, the conflict of interests between China and the United States was taken seriously. However, the indices were suspended for some time, not knowing which side to choose. Nevertheless, after some hesitation, they slowly began to go into the red zone. Here investors were inspired by the news about the opening of the economies of individual states after quarantine measures. However, this optimism was very uncertain against the background of low economic indicators. The Dow Jones Industrial Average index closed yesterday at around 24,474.12 points, which reflected a decline of 0.41%, or 101.78 points, respectively. The S&P 500 index also fell by 0.78% which is equivalent to 23.10 points. Presently, its level is 2,948.51 points. The Nasdaq Composite Index fell too by 0.97%, or 90.90 points, which drove it to a level of 9,284.88 points. Despite this trend, there are those who have succeeded a little in bidding. For example, the S&P 500 index, which showed a positive trend of 3%, may finish the week in positive territory. In addition, the Dow index also rose by 3.3%, which allowed it to become the leader in maximum weekly growth. So far, there has been no news that could seriously support the stock markets in Europe, Asia, and America. The material has been provided by InstaForex Company - www.instaforex.com |
| Posted: 22 May 2020 07:47 AM PDT
This morning, the price of crude oil showed a negative correction. The main news played by market participants was the decision of the PRC authorities to refrain from setting benchmarks for economic growth this year. This step made investors think that under the influence of the COVID-19 pandemic, the demand for hydrocarbons will be quite low among the world's second-largest consumer of oil. Thus, futures of Brent crude on the London Stock Exchange fell immediately this morning by 6.02%, which is about 2.14 dollars lower and reached the level of 33.89 dollars per barrel. Yesterday's trading reflected the growth of futures for delivery in July by 0.9% (or 0.31 dollars), they stopped at 36.09 dollars per barrel, which is the highest value since mid-March. Futures prices for WTI crude oil at auction in New York fell even further by 7.43%, or 2.52 dollars, which pushed them to the line of 31.4 dollars per barrel. Thursday's trading, on the contrary, went up with the closing price at 1.3%, equivalent to $ 0.43, which sent them to the level of $ 33.92 per barrel. In general, the current month was very successful for WTI crude oil, it was able to make a tremendous rise of 80%. Brent crude oil was also in a big plus with an increase of 43%. The main factors of growth were increased demand, opportunities for economic recovery at a faster pace, and a decrease in oil production in OPEC countries. Analysts argue that the rejection of benchmarks in the Chinese economy is a signal that attention to investment in infrastructure will decrease, and this, in turn, is nothing more than a negative indicator for black gold. In general, this news indicates that the state cannot yet fully assess the consequences of the influence of some external factors on the economy. The main factor, of course, is the coronavirus pandemic. Thus, China is no longer the driving force behind the global economy and is becoming an observer. Moreover, the growing tension between the two economic giants - the United States and China - is forcing the latter to decide on its own defense. China intends to sign laws that are designed to guard the national security of Hong Kong. And this doesn't favor the US, which also affected oil quotes. The US authorities, however, also did not lose time in vain and finally submitted a document that describes all the sanctions against Chinese officials and organizations, which should monitor the implementation of national security legislation in Hong Kong. According to this bill, a fine will be obtained for working with these organizations. Thus, today's trends are associated with geopolitical issues, which are accompanied by an increase in demand for crude oil, as well as a decrease in refining in countries that are leading oil producers. Recall that yesterday, oil recorded the highest value over the past six weeks. However, today it became clear that the negative in the economy has put so much pressure, which nevertheless forced prices to move down. Most experts believe that the tension between the US and China severely limits the movement of WTI oil and makes it a victim in this war. In the event of continuous conflict, exacerbated by new details, which, for example, include the introduction of reciprocal duties, then the hope of a quick recovery in the global economy will melt. And if the escalation of tension becomes an occasion for a complete rejection of economic relations in these countries, the situation will become a stalemate. Of course, such risks cannot but have a serious impact on oil market participants who, on the eve of the weekend, prefer to limit their deals. The material has been provided by InstaForex Company - www.instaforex.com |
| Posted: 22 May 2020 07:30 AM PDT BTC News:
With central banks across the world pumping billions of dollars into the economy through monetary and fiscal policies, never has the need for a central bank digital currency [CBDC] been more clearer. As CBDCs only increase in popularity given its current use-case, how will the advent of centralized digital currencies affect the world of decentralized currencies, particularly Bitcoin? report stablecoins "And equally we will be able to put the brakes on in some parts of the country while not having to do so in other parts." Technical analysis: Trading recommendation: The material has been provided by InstaForex Company - www.instaforex.com |
| Posted: 22 May 2020 07:23 AM PDT Corona virus summary:
Downing Street did not rule out London emerging from the lockdown sooner than other parts of the country. Asked whether the capital could see measures eased quicker, the prime minister's official spokesman said: "As we are able to gather more data and have better surveillance of a rate of infection in different parts of the country then we will be able to lift measures quicker in some parts of the country than in others. "And equally we will be able to put the brakes on in some parts of the country while not having to do so in other parts." Technical analysis: Trading recommendation: The material has been provided by InstaForex Company - www.instaforex.com |
| Posted: 22 May 2020 07:16 AM PDT Corona virus summary:
Tax revenues in Germany fell by a quarter last month, compared with a year earlier, as Europe's largest economy faced its most severe recession since the second world war. The central government and the 16 federal states pulled in about 39bn euros in April, 25.3% less than the same month in 2019. Technical analysis: EUR/USD has been trading downwards. The price tested and rejected of the support at the price of 1,0990. Due to rejection of the strgon support, my advice is to watch for buying opportunities. Trading recommendation: Watch for buying opportunities near the support at 1,0890. I see potential for the test of the recent swing low on the 4H time-frame at 1,0940. Stochastic oscillator is showing oversold condition,which is confirming my bullish view Key support level is set at the price of 1,0885 The material has been provided by InstaForex Company - www.instaforex.com |
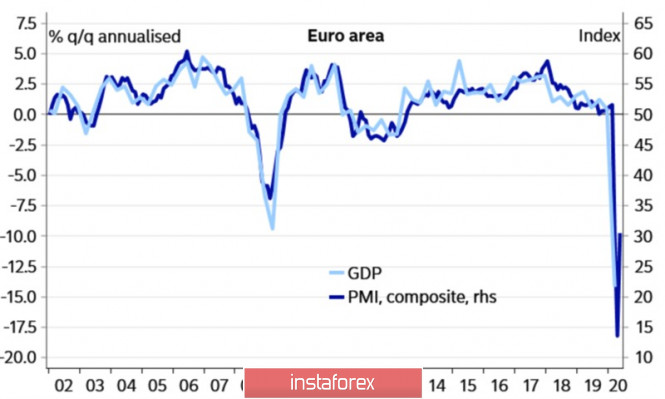
| Posted: 22 May 2020 05:11 AM PDT Despite the fact that the EUR/USD pair managed to close the almost week of May in the positive zone, an unpleasant residue remained. At the end of the five-day week, investors remembered that the coronavirus vaccine was still being tested, and not the fact that they would be successful; that business activity in the eurozone remains depressed. that Donald Trump continues to threaten China; that without a rapid recovery in global GDP, it is too early to get rid of the US dollar. The euro is growing due to the fact that a bad diagnosis has not been confirmed. Many waited for new import duties against China after accusing the White House of allegedly laboratory origin of COVID-19, but tariffs are still in place. The bears of the EUR/USD relied on a split in the eurozone and on the restriction of capabilities of the ECB by the German Constitutional Court, but the German and French project to create a fund to help eurozone countries affected by a pandemic allows us to talk about preserving the integrity of the currency bloc. As, however, is Christine Lagarde's statement about the lack of accountability of Central banks to the governments. The European regulator will continue to support Italy and other states included in the Old World. The project of Angela Merkel and Emmanuel Macron can be compared with the statement of the former head of the ECB, Mario Draghi, about his readiness to do everything possible to save the euro. The issuer of the bonds will be the European Commission, a first-class borrower whose debt yield is higher than, for example, in Germany. It will be about an emission of about € 150 billion over three years. The guarantor will be the European budget, the lion's share of the resources of which are formed at the expense of the Germans. Moreover, the support is provided to the Eurozone, but its current state is slightly disappointing. The composite PMI may have risen from 13.6 to 30.5 in May, but it remains below the critical mark of 50, indicating a decline in GDP. Dynamics of European GDP and business activity
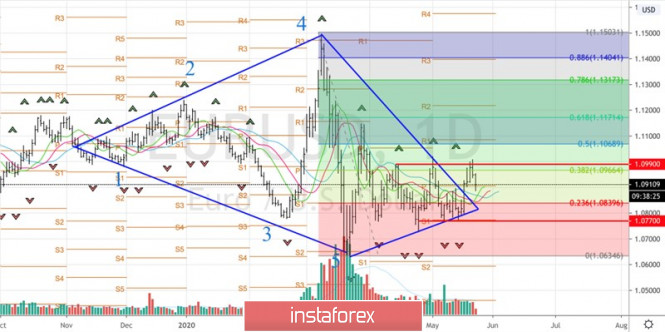
On the other hand, Markit draws attention to a significant reduction in employment and notes that it may take years to restore the eurozone economy. In my opinion, not everything is so critical. In the absence of trade wars and the widespread use of the coronavirus vaccine, one can count on the rapid growth of global GDP. The first to wake up from a pandemic is China, an important EU trading partner and a major consumer of raw materials. In 2018-2019, the slowdown in its economy against the backdrop of a conflict with the United States had an extremely negative effect on export-oriented Europe. Counting on the EUR/USD rally makes no sense without a vaccine and a recovery in global GDP. Uncertainty in politics and the economy will support high demand for the US dollar. In this regard, this currency will have a new trump card as the US presidential election approaches. Technically, despite the quotes of EUR/USD going beyond the Rhombus pattern, the bulls could not break above 1.1, which indicates their weakness. At present, the "Splash and Shelf" pattern is relevant with a consolidation range of 1.077-1.099. A breakthrough of the upper border of the "shelf" will allow you to buy euros, while breaking through the bottom will allow you to sell. Daily chart for EUR/USD
|
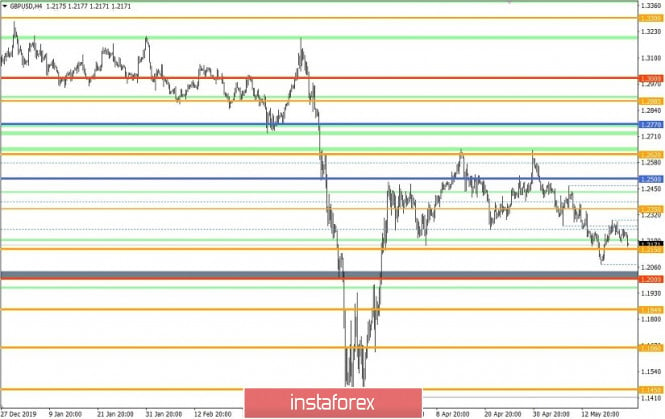
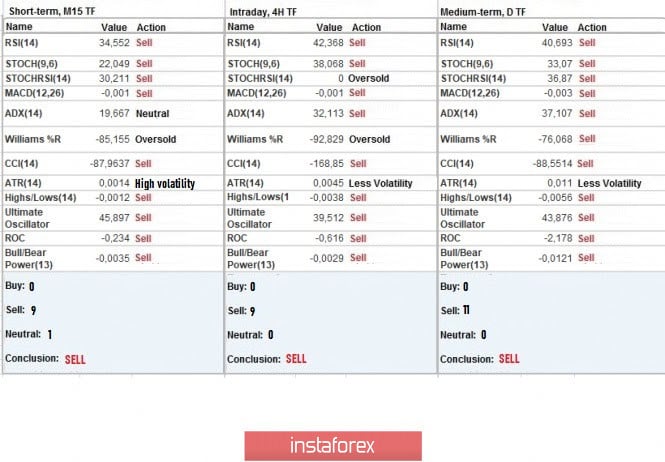
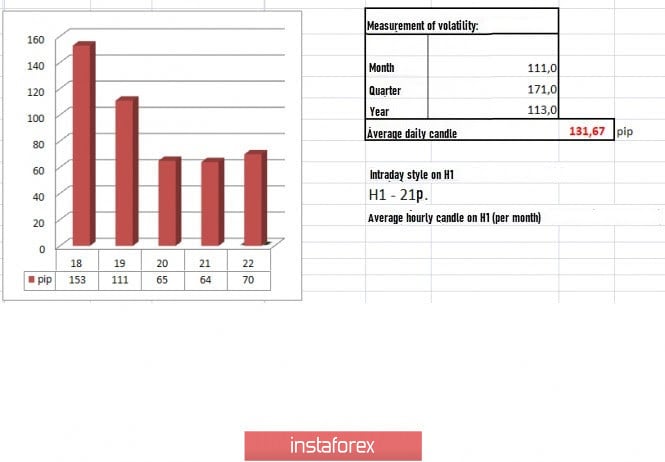
| Trading recommendations for the GBP/USD pair on May 22, 2020 Posted: 22 May 2020 04:59 AM PDT From the point of view of complex analysis, we can see a gradual recovery process, which market participants have already expected. The current trading week is almost ending. Over the past days, the quote managed to form a course, from the alternating support point towards the area of the interaction of trading forces 1.2240 / 1.2280, to which a slowdown was recorded. After which, in the daily chart, activity of traders fell and coincided with the area of interaction of trade forces, which became a signal of sorts that the quotes are ready for a recovery. In medium-term trading, decreasing the quotes is still the main goal, the signal of which is the course on May 1, which formed a flat for one and a half month and restored the quote 46% relative to movement on March 20 to April 14. The levels that must be reached to resume the downward movement are 1.2000, 1.1850, 1.1660 and base 1.1411 / 1.1450. As discussed in the previous review, traders are waiting for the recovery process that will occur after overcoming the area 1.2150 / 1.2180. In terms of volatility, the indicator recorded a value lower than yesterday (from 65 points to 64 points), which is the same as the value recorded before for 28 trading days in a row. This means that accumulation has reached an extremely high level, and a sharp jump on volatility may be observed in the near future. Looking at the daily chart, we can see a slowdown in activity, which may have served as a platform for the market participants to normalize their emotional mood. The news published yesterday contained the preliminary data on business activity in the UK, the contents of which revealed an increase in the index of services sector from 13.40 to 27.80, higher than the forecasted 25.00. In the manufacturing sector, the data also turned out better than expected, as the index increased from 32.60 to 40.60. Such results pulled the composite business activity index up from 13.80 to 28.90. Previous forecasts expect a decrease in the PMIs, but the data published show a pretty significant improvement. The pound rose because of the improving UK PMI data. A similar data was published in the afternoon, where the US service sector saw an increase from 26.70 to 36.90, much better than the forecasted 30.00. In the manufacturing sector, PMI increased from 36.10 to 39.80, also higher than the forecasted 38.00. Composite business activity also grew from 27.00 to 36.40. If we look onto the movement of the GBP / USD pair, we can say that the market reaction to the US PMI data is extremely sluggish. The weekly report on US unemployment was also published. Another anti-record was set by repeated applications, which determined to 25,073,000, worse than the number of initial applications, which has been decreasing for a week, and gained to 2,438,000. Meanwhile, the Bank of England published an analysis regarding the impact of the coronavirus in the UK economy. According to the report, quarantine measures affected almost all areas of the economy. Retail sales in March dropped by 80% compared to the same period last year, businesses such as restaurants have completely stopped operating, and the tour industry is going through one of the worst times. Flights departing from UK airports also fell by about 90%, and trips within the country by rail almost stopped. Bus trips were also reduced by 80%, and cars were reduced by about 60%. The April data in UK retail sales was published today. According to the report, the index declined from -5.8% to -22.6%, the most significant decline recorded in 25 years. The pound weakened due to such terrible statistics. The upcoming trading week will begin with a day off in the UK and the United States. No other important occasion is expected, except the release of data on US unemployment and US GDP on Thursday. Do not be discouraged though, as the external background is still high, and market participants almost constantly focus on such news. The most interesting events that will happen next week are displayed below: (UTC + 1) Monday, May 25 US - Memorial Day UK - Bank holidays Tuesday May 26 US 14:00 - S&P / CS composite housing price index with seasonal adjustments (Mar) US 15:00 - New home sales (Apr) Thursday, May 28 US 13:30 - weekly report on applications of unemployment benefits US 13:30 - preliminary data for 1st quarter GDP US 13:30 - orders for durable goods (Apr) US 15:00 - index of pending sales in the real estate market (April) Friday May 29 US 13:30 - preliminary data on wholesale sales (Apr) Further development Analyzing the current trading chart, we can see that the candle has already passed yesterday's low, which led to the convergence of prices in the area of 1.2150–1.2180. Such movement may lead to a decline, since the recovery process has not yet been fully achieved. If we refer to the two-day slowdown, we can say that activity may safely increase soon, and the update of May 18's low is just a matter of time. The area of 1.2150 / 1.2180 will locally delay the quote, but not for long, since the movement has already been set and only a consolidation below 1.2140 remains, in order to continue the movement of the quotes to May 18's low. Based on the above information, we derived these trading recommendations: - Open sell positions to set off a rebound. Like what was instructed in the previous review, take profit from the area of 1.2180-1.2150, and then wait for a consolidation below 1.2140 to push the quotes to the value of 1.2080 or possibly to the psychological level of 1.2000. - In local transactions, open buy positions in the area of 1.2150 / 1.2180 to push the quotes above 1.2190, towards 1.2230. Indicator analysis Analyzing the different sectors of the timeframes (TF), we can see that hourly and daily periods retain a sell signal, which confirms the intention of market participants to restore the movement. Volatility per week / Measurement of volatility: Month; Quarter Year The measurement of volatility reflects the average daily fluctuation, calculated by Month / Quarter / Year. (May 22 was built, taking into account the time of publication of the article) Volatility is currently 70 points, which is much higher than dynamics of the last two days. Thus, we can assume that accumulation serves as a catalyst of acceleration in volatility. Key levels Resistance Zones: 1.2250; 1.2350 **; 1.2500; 1.2620; 1.2725 *; 1.2770 **; 1.2885 *; 1.3000; 1.3170 **; 1.3300 **; 1.3600; 1.3850; 1.4000 ***; 1.4350 **. Support areas: 1.2150 **; 1.2000 *** (1.1957); 1.1850; 1.1660; 1.1450 (1.1411); 1.1300; 1,1000; 1,0800; 1,0500; 1,0000. * Periodic level ** Range Level *** Psychological level **** The article is built on the principle of conducting a transaction, with daily adjustments The material has been provided by InstaForex Company - www.instaforex.com |
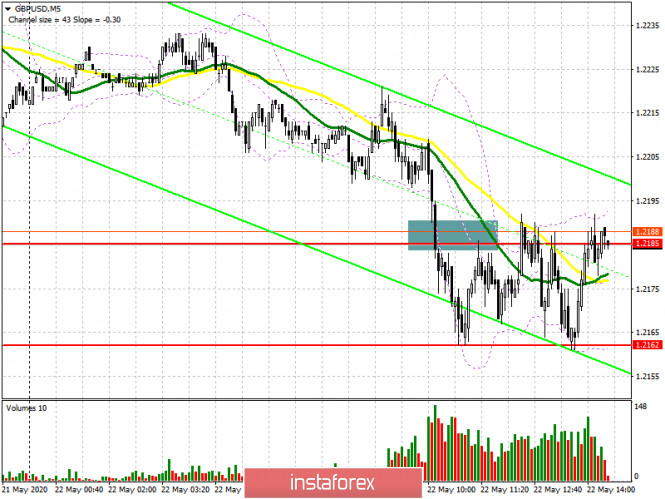
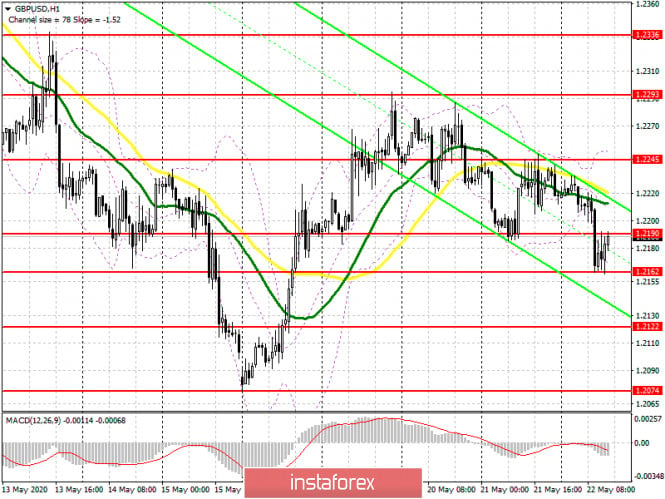
| Posted: 22 May 2020 04:45 AM PDT To open long positions on GBPUSD, you need: In the first half of the day, I paid attention to the possibility of continuing the downward correction in the pair and the breakdown of support at 1.2185, which happened. If you look at the 5-minute chart, you will see how the bears easily achieved a breakdown of this support and gained a foothold under it. A repeated test of this level from the bottom up was a good signal to open short positions in the continuation of the bearish trend. However, at the time of writing, there was no serious movement down the pound, and each time the bears had problems around the low of 1.2162, which now acts as a kind of support at the moment. The task of the bulls for the second half of the day is to consolidate above the resistance of 1.2190, which may lead to a larger upward correction to the maximum area of 1.2245, where I recommend fixing the profits. A repeated decline to the minimum of 1.2162 will certainly lead to its breakdown, so it is best to look for new long positions after updating the larger level of 1.2122 in the expectation of correction of 30-35 points within the day.
To open short positions on GBPUSD, you need: The task of sellers for the second half of the day is to hold the pair below the resistance of 1.2190. Although there is no strong hope for a downward movement of the pound from this level, as long as trading is conducted under this range, the bearish momentum will continue. A repeated test of the minimum of 1.2162 will probably lead to a larger sale of GBP/USD to the support area of 1.2122, and then to the test of the May minimum of 1.2074, where I recommend fixing the profits. In the scenario of a larger upward correction above the level of 1.2190, it is best to return to short positions on the pound today only for a rebound from yesterday's high in the area of 1.2245.
Signals of indicators: Moving averages Trading is conducted below the 30 and 50 daily averages, which indicates the superiority of the pound sellers in the market. Note: The period and prices of moving averages are considered by the author on the hourly chart H1 and differ from the general definition of the classic daily moving averages on the daily chart D1. Bollinger Bands In the case of an upward correction, the area of 1.2245 will act as a resistance, from which you can open short positions immediately for a rebound. Description of indicators
|
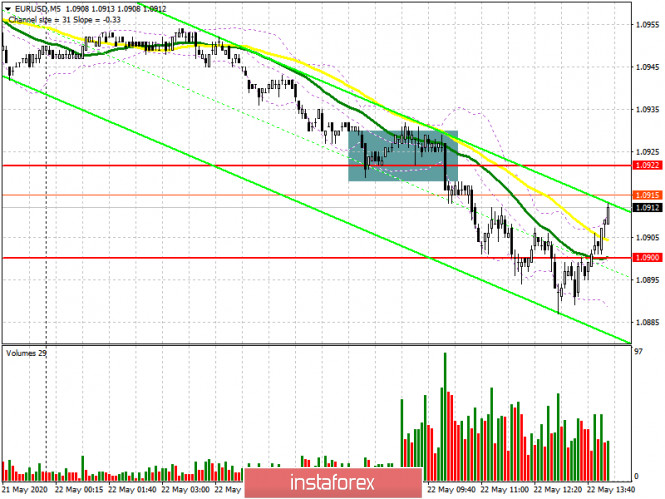
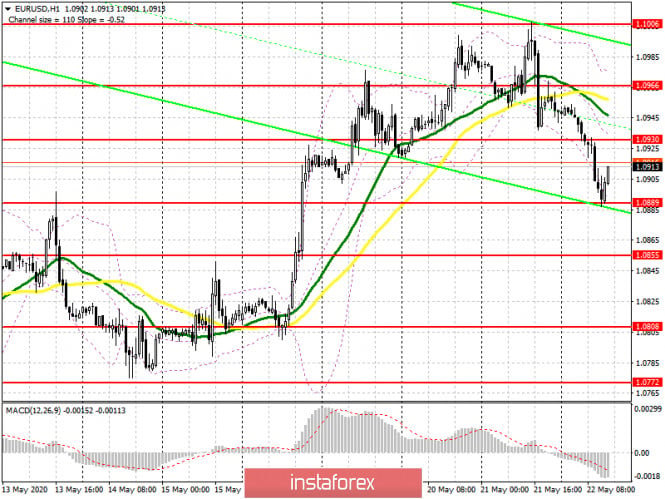
| Posted: 22 May 2020 04:43 AM PDT To open long positions on EURUSD, you need: The pressure on the euro remained at the beginning of the European session on Friday, and if you remember my morning forecast, I recommended opening short positions when the level of 1.0922 is retested or after it is fixed below it, which happened. On the 5-minute chart, we clearly see that there was no major rebound from the support of 1.0922, and on the second test, the bears achieved a further decline in the euro to the minimum of 1.0900, where I recommended fixing the profits. At the moment, a new low of 1.0889 has been formed, which the bulls need to protect in the afternoon during the publication of the minutes of the April meeting of the European Central Bank. Only the formation of a false breakout there will be a signal to open long positions. Otherwise, I recommend buying EUR/USD now only for a rebound from the minimum of 1.0855. An equally important task for the bulls will be to break through and close the week above the resistance of 1.0930, which will maintain an upward trend in the market. If this fails, the pressure on the euro will only increase at the beginning of next week.
To open short positions on EURUSD, you need: Sellers have coped with the morning task perfectly and are still in control of the market. A small correction after updating the low of 1.0900, from where I recommended opening long positions in the first half of the day, may lead to a resistance test of 1.0930, which will be an excellent signal for a return to the market of large sellers who are able to break the low of the day around 1.0889 today. This scenario will lead to a larger sale of EUR/USD in the area of the minimum 1.0855, where I recommend fixing the profits. If there is no activity from sellers after the resistance test of 1.0930, it is best to postpone short positions until the 1.0966 high is updated, in the expectation of a downward movement of 25-30 points by the end of the day. It is not yet clear how the market will behave during the publication of the European Central Bank's minutes, but it will most likely be possible to observe a slight strengthening of the euro.
Signals indicators: Moving averages Trading is below the 30 and 50 daily moving averages, which indicates a continuation of the downward trend in the short term. Note: The period and prices of moving averages are considered by the author on the hourly chart H1 and differ from the general definition of the classic daily moving averages on the daily chart D1. Bollinger Bands In the case of an upward correction in the second half of the day, the average border of the indicator around 1.0935 will act as a resistance, and you can sell the euro immediately on a rebound after testing the upper border in the area of 1.0975. Description of indicators
|
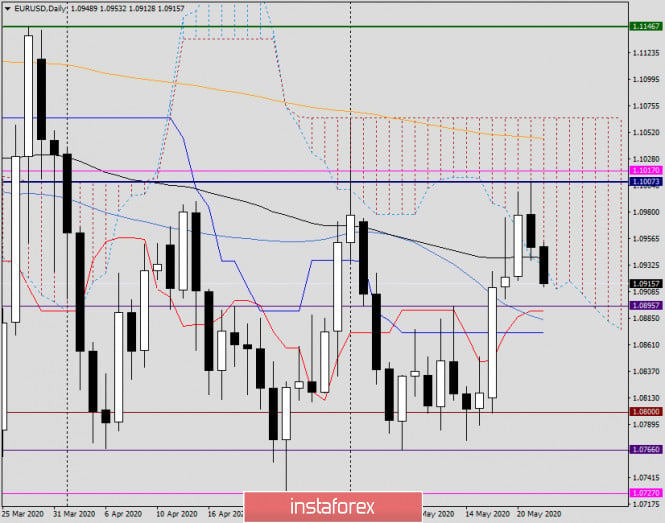
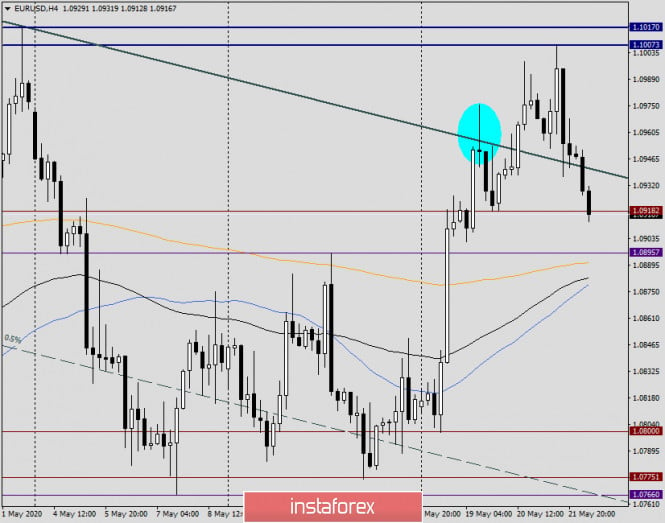
| Analysis and forecast for EUR/USD on May 22, 2020 Posted: 22 May 2020 04:09 AM PDT Greetings, dear colleagues! Let's try to forecast the prospects for closing the week and sum up some interim results. However, to begin with, I would like to note that yesterday's business activity indices in the manufacturing and services sectors in both the Eurozone and the US exceeded the expectations of economists and came out in the green zone. Today, there are very few events that can affect the price dynamics of the main currency pair on the Forex market. Except for the ECB's monetary policy report, which will be published at 12:30 London time. In this regard, the EUR/USD pair is likely to be affected by technical factors, as well as news and (or) comments related to the already sore topic of COVID-19. Daily
As can be seen from the daily chart, at the end of the current five-day period, the euro/dollar pair is ready to make a correction to its previous growth. This possibility is indicated by yesterday's candle, which can be characterized as a "shooting star" model. Euro bulls failed to close three consecutive daily sessions above the 89 exponential moving average (black), which calls into question the validity of the breakdown of this exponent. Also yesterday, the iconic technical and psychological level of 1.1000 was tested for a breakdown, but the players failed to raise the quote above 1.1008. Today will be extremely important. The minimum task for EUR/USD bulls will be to keep the price within the cloud of the Ichimoku indicator and not let it fall out of it down. The ideal option would be to close today and the entire week above 1.1000, but the task is extremely difficult, especially in the absence of a serious driver for growth. Bears need to build on yesterday's success and start playing back the "shooting star" reversal model of candle analysis. If they succeed, the quote may fall to the area of 1.0895-1.0875, where the broken resistance level, the Tenkan line, 50 simple moving average, and Kijun. In my opinion, the pair can find good support in the selected area and turn back to the north. If this does not happen, the upward momentum can be considered completed and adjusted for further downward dynamics of the main currency pair. I believe that passing and fixing above 1.1000 will be a kind of moment of truth. Many believe that the US dollar maintains a leading position in the foreign exchange market in the context of the COVID-19 pandemic. Moreover, the "American" is in demand both as the main reserve currency of the world and as a safe-haven currency. I will write more about this in an article that will be published on Monday. H4
We see that after the price seems to have fixed above the gray resistance line of 1.1146-1.11017, the pair returns under this line. This is a negative signal for players to increase, because if three consecutive candles are fixed under the line, its breakdown will have to be recognized as false and sales will be considered on the rollback to the grayline. However, it is not a fact that this will become clear today, and entering the market shortly before it closes is not the best trading idea. However, for those who want to trade today, we will consider both options. I can recommend risky and aggressive purchases from the current price of 1.0925. It is less risky to buy a pair after a short-term decline in the price zone of 1.0895-1.0880. However, this position is relevant only if the euro/dollar is not fixed under another very important level of 1.0900. Regarding sales, I have already noted their possibility on a pullback to the gray resistance line, if the pair is fixed under it. You should think about opening positions at more attractive prices after rising to the price area of 1.0990-1.1015, but only if there is a reversal bearish candle or a model consisting of several candles. In conclusion, I would like to remind you that today is the end of the week, so I do not recommend setting big goals and moving positions to Monday. This is a risky undertaking. Good luck! The material has been provided by InstaForex Company - www.instaforex.com |
| EUR/USD: Euro rally stopped; hopes for a rapid recovery in the global economy were not enough Posted: 22 May 2020 03:58 AM PDT The EUR/USD pair managed to rise above the level of 1.10 for the first time since the beginning of May. However, the attempt of the "bulls" to develop a further upward movement was unsuccessful. As a result, the main currency pair could not stay at the local maximum of 1.1008 and pulled back to 1.0900. According to the head of the US Treasury, Steven Mnuchin, the US economy will become great once again in 2021. However, judging by the decline in the S&P 500 index, investors are still inclined to be guided by the principle of "trust, but verify." The number of applications for unemployment benefits in the United States, filed between May 10 and 16, amounted to 2.4 million. The indicator is gradually declining from its peak level of almost 7 million, recorded at the end of March. At the same time, the number of Americans receiving benefits for the week increased from 22.5 million to 25.1 million. Although business activity in the country has moved away from the bottom of April, it continues to remain depressed. This allows us to doubt the V-shaped recovery of the US economy. Meanwhile, the situation in the eurozone does not look the best. According to IHS Markit, the composite PMI index of the currency block grew from 13.6 to 30.5 points in May. However, jobs in the region continue to decline rapidly, even despite the best efforts of national governments to maintain them. At the same time, fears associated with coronavirus will continue to suppress consumer activity in the Old World, and a decrease in demand is forcing employers to lay off employees. According to the Capital Economics's forecast, Eurozone GDP may decline by 20% in the second quarter. The main factor supporting the single European currency this week is the news regarding negotiations within the EU to create a new fund to save the region's economy. However, the impact of this event on the market is gradually weakening. Firstly, it is not yet clear whether the EU countries will be able to agree. Secondly, this fund is likely to begin to operate no earlier than 2021. It is obvious that the European economy needs more operational intervention and support, as evidenced by data published this week on economic activity in the EU as a whole and in individual countries in particular. The weaknesses of the American and European economies hinder the growth of stock indices and stimulate the demand for defensive assets. The dollar is supported by increased tension in relations between Washington and Beijing, as well as the latter's unwillingness to set a goal for the growth of national GDP in 2020. For the first time in more than a quarter of a century, China decided to abandon the target. According to experts, this indicates a high level of uncertainty in the economy even after the end of strict quarantine. China's cautious mood weakens the hope that after universal self-isolation, the country's economy will evenly recover. This is bad news for the export-oriented economy of the eurozone and for the single European currency. The chief economic adviser to US President Larry Kudlow, on the other hand, claims that the agreements reached at the end of January between the United States and China in the field of trade have not undergone any changes, but China must be punished for the pandemic. In turn, the owner of the White House, Donald Trump, said that if the PRC introduces legislation restricting rights and freedoms in Hong Kong, the United States can respond harshly. Apparently, without the COVID-19 vaccine, it is not worth counting on a rapid recovery of global GDP and the exit of EUR/USD beyond the medium-term consolidation range of 1.0650 - 1.1150. The material has been provided by InstaForex Company - www.instaforex.com |
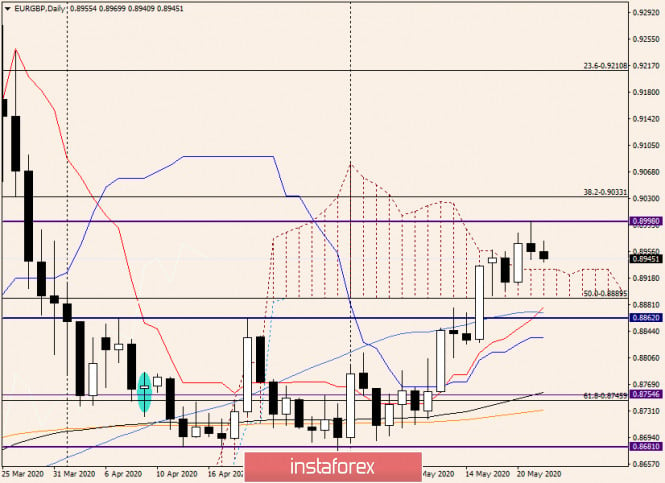
| Analysis and forecast for EUR/GBP on May 22, 2020 Posted: 22 May 2020 03:19 AM PDT Hello! After the impressive growth that the euro/pound cross-rate showed last week, the current five-day trading at the time of writing does not give an idea of the obvious direction of the price. It would seem that the single European currency should have been supported by the news that Germany and France agreed to create a 500 billion euro bailout fund for countries affected by COVID-19. In turn, the British currency could be pressured by the news that the Bank of England is considering the introduction of negative interest rates. Even despite today's weak data on retail sales in the UK, the pound paired with the single European currency feels quite confident and even signals a possible strengthening. Daily
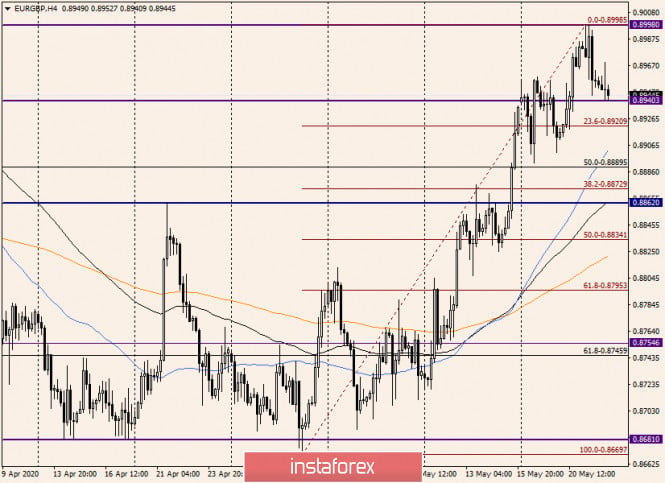
This signal was yesterday's daily candle "shooting star", which appeared under a strong technical level of 0.8998, that is, directly under the most important psychological mark of 0.9000. In itself, the reversal model of candle analysis, and even formed under such a significant mark, in theory, can not remain unnoticed by market participants. And indeed, at the moment of writing this review, the euro/pound cross shows a decline, although it is still quite modest. If the downward trend continues, the pair will fall to the previously broken upper border of the Ichimoku indicator cloud, which passes at 0.8930. Closing today's trading within the cloud will create technical prerequisites for continuing the downward trend. However, it is quite possible that the upper border of the cloud will be strong support and will turn the euro/pound up. On the daily chart, the current situation is not quite clear, but given yesterday's reversal candle, I am more inclined to assume a downward scenario. H4
After the quote stopped right below the mark of 0.9000, the probability of a correction, or perhaps a reversal of EUR/GBP, is also seen in this timeframe. I stretched the Fibonacci grid to the rise of 0.8670-0.8998 and suggest that you monitor the behavior of the price near the first two pullback levels: 23.6 and 38.2. If bullish models of Japanese candlesticks appear here, it is highly likely that the EUR/GBP correction can be considered completed and the bullish trend can be expected to resume. This means that in this situation, you need to prepare for cross purchases. A deeper correction and departure below the strong technical level of 0.8860, where the 89 exponential moving average is also located, will most likely signal the presence of serious sellers. H1
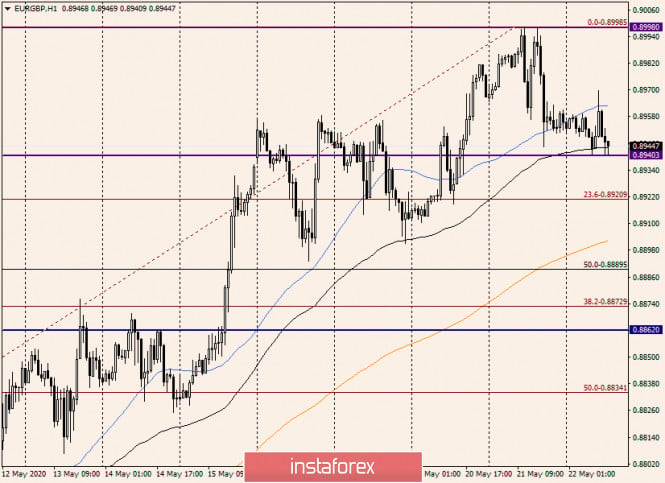
The hourly chart shows an even more pronounced upward trend, but the pair has stalled between 50 MA and 89 EMA. I believe that the current direction of the euro/pound will depend on the true breakdown of one of these moves. Since the current situation is uncertain, I will indicate recommendations for both scenarios. I recommend considering purchases after updating today's highs at 0.8970, but with small goals. Remember that the important mark of 0.9000 is higher, and it is not necessary to move the position to Monday. Purchases at more attractive prices are considered risky, starting from the current values of 0.8949. To open sales, a bearish candle must appear at 50 MA. Another option for opening short positions will be a breakout of the support of 0.8940. In this case, we sell either at the breakout level or after its breakdown on the pullback. That's all for now. Good luck! The material has been provided by InstaForex Company - www.instaforex.com |
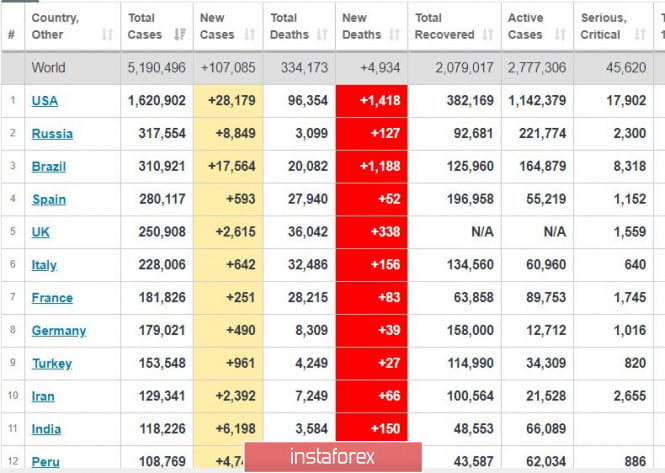
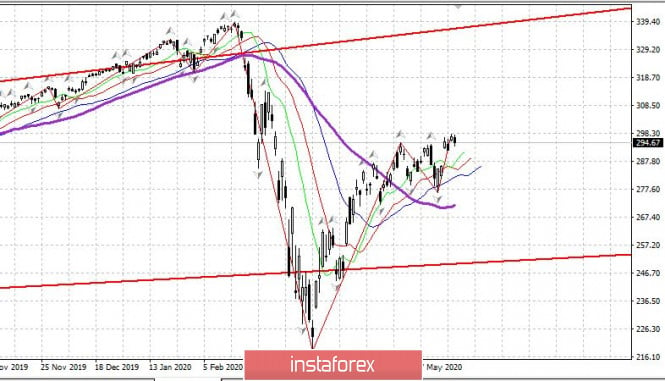
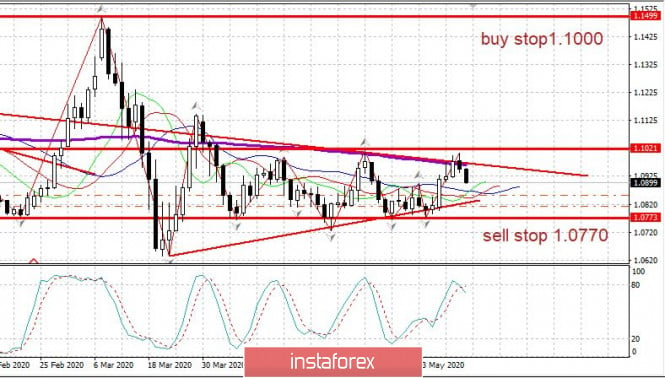
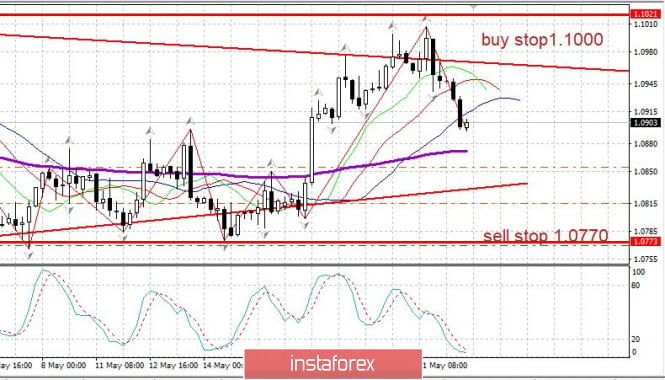
| Posted: 22 May 2020 03:18 AM PDT Coronavirus updates from around the world: 1. In the US, the daily increase of new cases rose to 28 thousand. The number of deaths is about 1,400 per day. Such is the result of a premature easing of quarantine measures. 2. A third wave of the pandemic is brewing. Brazil recorded a huge increase in new cases at about 17 thousand per day, with deaths at about 1,200 per day. A potentially dangerous situation is seen in India, as the country records about 6 thousand new cases, much higher than the figures before. Given the size of India as well as its population, the situation may lead to a disaster. Meanwhile, Europe continues to open. The US remains launching its economy as well. S&P 500 daily chart. The index has no potential growth. The number of unemployed reached 25 million in the United States, with about 2.4 million new applications for unemployment benefits. Business activity indices are also terrible. The Philadelphia index turned out to be minus 40, with leading indicators at minus 4%. Sell positions may be opened in the US market at current prices. EUR/USD: The plan of increasing the pair will most likely fail. Keep holding buy positions from 1.0855. Stop at a breakeven. Open sell positions from 1.0770. Buy positions may also be opened from 1.1000. The material has been provided by InstaForex Company - www.instaforex.com |
| Trader's diary for May 22, 2020 Posted: 22 May 2020 03:01 AM PDT
EURUSD: Seemingly, there has been a cancellation or maybe only a delay with the upward trend. You may keep purchases from 1.0855 with stops at breakeven. Buy from 1.1000. Sell from 1.0770. Probably, around next week we will see new levels for entry. The material has been provided by InstaForex Company - www.instaforex.com |
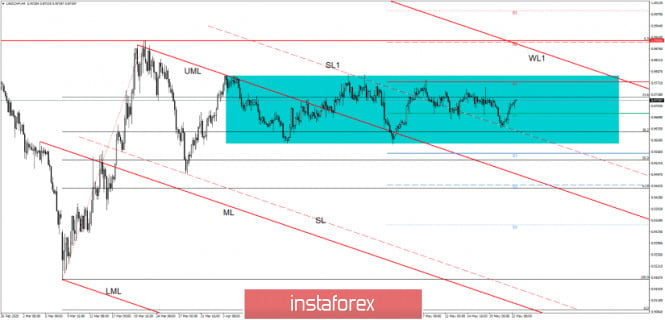
| Posted: 22 May 2020 02:59 AM PDT USD/CHF is trading at 0.9720 and the outlook is somehow bullish as the USD is boosted by the USDX's rally. The currency pair is still located within an extended range, but the bulls seem to be strong enough to lead the price towards new highs in the weeks to come. The pair increases after the last US data, the Flash Manufacturing PMI, and the Flash Services PMI have produced a big surprise, adding more buyers on this pair. USD/CHF has decreased in the short term only because the dollar index was into a minor correction.
The current sideways movement is obvious on the H4 chart, USD/CHF has found strong support on the outside sliding line (SL1) of the major descending pitchfork and now has jumped above the PP (0.9680) level. The failure to approach and reach the S1 (0.9560) level, or to stabilize below the Pivot Point (0.9680) has signaled an increase towards the R1 (0.9775) level. Technically, USD/CHF is still expected to increase and approach the 0.9900 level after the failure to reach the median line (ML) and after the valid breakout from the descending pitchfork.
USD/CHF is almost to reach the 23.6% resistance, a valid breakout will confirm a further increase at least till the R1 (0.9775) level. The support is seen at the PP (0.9680) level and lower at the sliding line (SL1). The pair could increase towards the 0.9794 range resistance after the failure to approach again the 0.9591 pattern's support. A valid breakout above the R1 (0.9775) could bring a buying opportunity, the next targets are seen at the first warning line (WL1) and higher at the 0.9900 level. The upside breakout from the extended range, above 0.9794, will suggest a broader increase towards the 1.0 psychological level. We could search for selling opportunities if USD/CHF registers only false breakouts above the near-term resistance levels, or if the price registers another lower low. The material has been provided by InstaForex Company - www.instaforex.com |
| Instaforex Daily Analysis - 22nd May 2020 Posted: 22 May 2020 02:52 AM PDT Today we take a look at EURUSD and see how we are going to play the bounce! We use Fibonacci retracements, extensions, support/resistance, momentum and trend lines to identify trading opportunities in this exciting pair today! The material has been provided by InstaForex Company - www.instaforex.com |
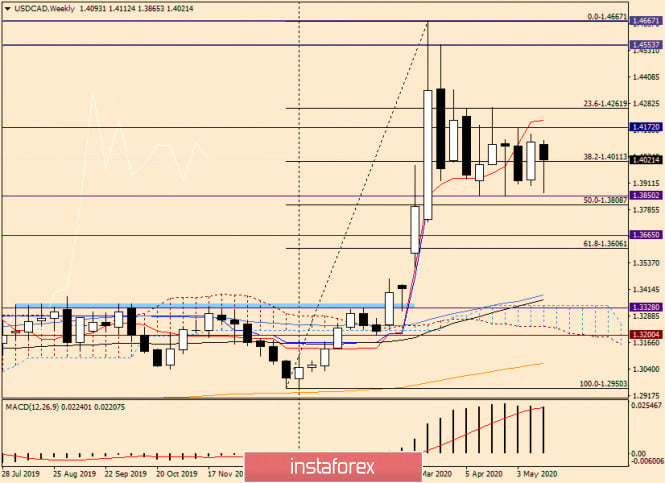
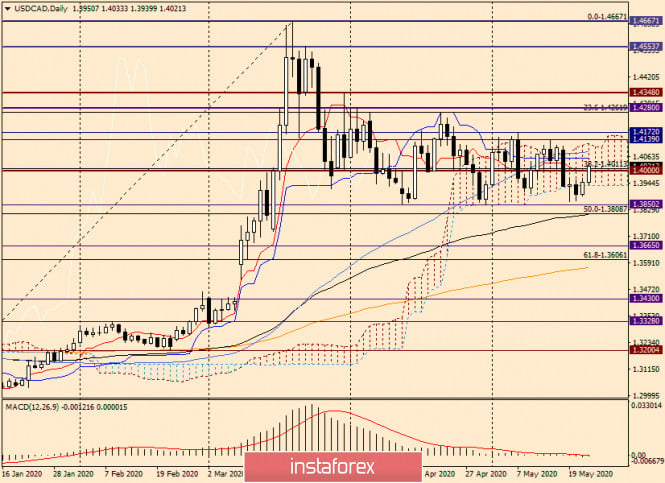
| Analysis and forecast for USD/CAD on May 22, 2020 Posted: 22 May 2020 02:48 AM PDT Good day, dear traders! Before proceeding to the charts of the USD/CAD currency pair, let me tell you some interesting facts about the balance of the Fed. As you know, the COVID-19 epidemic and its negative consequences for the American economy forced the Chairman of the Federal Reserve System (FRS) Jerome Powell to start a large-scale injection of liquidity, for which the printing press was launched at the maximum capacity. As a result, the Federal Reserve's balance sheet has almost doubled over the past six months, from $ 4 trillion to $ 7 trillion. An unprecedented number! However, recently, bond purchases have fallen to the region of six billion dollars a month, while the March figure for purchases of mortgage and Treasury bonds was 120 billion. However, experts suggest that this is a temporary measure and soon the US Central Bank will have to evade the volume of the quantitative easing program. Well, we'll wait and see. And today, at 13:30 (London time), reports on retail sales will be received from Canada. The forecasts are disappointing. The March figure is expected to be minus 10%, and retail sales excluding cars are expected to be minus 5%. Weekly
In the meantime, the US dollar paired with its Canadian namesake feels quite confident and is rapidly reducing the losses incurred during the current weekly trading. The current weekly candle has a fairly long lower shadow, which indicates the weakness of the bears and the inability to continue the pressure on the price. If the bulls manage to raise the exchange rate to the opening price of 1.4093, and even more so to move into positive territory, next week we can reasonably expect continued strengthening of the exchange rate. The breakout of sellers' resistance at 1.4172, the break of the Tenkan line (1.4203) of the Ichimoku indicator, and the mandatory passage of strong resistance around 1.4264 will finally convince the bulls of the strength of USD/CAD. The bearish scenario will regain its relevance after breaking the strong support level of 1.3850. At the moment, as we can see, the "Canadian" is trading around the middle of the range of 1.4172-1.3850 and even a little closer to its upper border. Daily
On the daily chart, the pair failed to gain a foothold under the lower border of the Ichimoku cloud and closed yesterday's trading within it. Today, at the end of this article, USD/CAD shows an impressive strengthening and is trading above the most important psychological level of 1.4000. However, next, the bulls on the instrument will face the Kijun line (1.4056) and the 50 simple moving average, which runs at 1.4086. In case of passing these barriers, for further growth, you need to go up from the Ichimoku cloud, and then break through the resistance at 1.4139 and 1.4172. Judging by the current price dynamics, it is unlikely that the pair will lose all of today's growth and finish trading under the lower border of the cloud. Statistics from Canada on retail sales are quite capable of influencing the course of trading in USD/CAD, but not to the extent that it turns everything upside down. H1
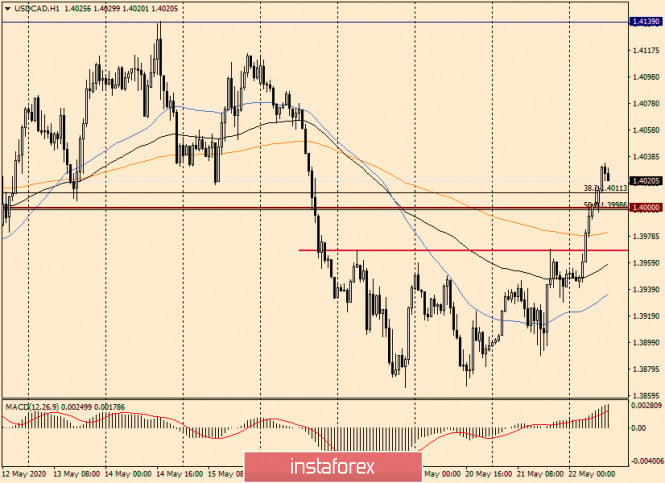
An interesting picture is observed on the hourly timeframe. After forming the "Triple bottom" technical analysis reversal pattern, the pair broke through the red neckline and headed up. According to the classic scheme, in such cases, we wait for a pullback to the broken neckline and open purchases. However, the rise was strong, and the quote went much higher, so I would not expect a pullback to the broken red neckline. I believe that a corrective pullback to the price zone of 1.4015-1.4000 will be sufficient reason to open long positions on USD/CAD. Sales will become relevant if reversal candle patterns appear on the hourly or 4-hour charts at the peak of growth. In this case, you can try shorting, but with small goals, solely based on the correction. At the moment, the USD/CAD pair is clearly bullish. Good luck! The material has been provided by InstaForex Company - www.instaforex.com |
| You are subscribed to email updates from Forex analysis review. To stop receiving these emails, you may unsubscribe now. | Email delivery powered by Google |
| Google, 1600 Amphitheatre Parkway, Mountain View, CA 94043, United States | |








No comments:
Post a Comment