Forex analysis review |
- USDCAD reacting below descending trendline resistance!
- Forecast for AUD/USD on May 5, 2020
- Forecast for USD/JPY on May 5, 2020
- Overview of the GBP/USD pair. May 5. The UK is calling on countries around the world to join forces to create a vaccine against
- Overview of the EUR/USD pair. May 5. US intelligence agencies have found evidence of China's guilt before the world public.
- EUR/USD and GBP/USD. Results of May 4. Conflict between the US and China will escalate after the end of the epidemic, and
- May 4, 2020 : GBP/USD Intraday technical analysis and trade recommendations.
- Short-term Ichimoku cloud indicator analysis of Gold
- Short-term Ichimoku cloud indicator analysis of EURUSD
- May 4, 2020 : EUR/USD Intraday technical analysis and trade recommendations.
- EURUSD: Italy continues to pull the Eurozone down. The weak production activity creates additional problems
- Comprehensive analysis of movement options for AUD/USD & USD/CAD & NZD/USD (Daily) in May 2020
- Evening review for May 4, 2020. EURUSD
- US Jobs report, Bank of England meeting, and important events that lie ahead the week
- EUR/USD analysis and forecast for May 4, 2020.
- EUR/USD: plan for the US session on May 4 (analysis of morning deals). Bulls are desperately resisting, but the pressure
- GBP/USD: plan for the US session on May 4 (analysis of morning deals). The pound continues to slide down
- EUR/USD analysis for 05.04.2020 - Bull flag pattern in play. Watch for buying opportunities with the upwrad target at 1.0980
- Analysis for Gold 05.04.2020 - First target reached at the price of $1.693 but still strong momentum and potential for test
- BTC analysis for 05.04.2020 - Potential for the downside movement on the BTC towrads the level at $7.820
- Trading plan for EUR/USD for May 04, 2020
- Pound is offseason
- Analysis of EUR/USD and GBP/USD for May 4. Investigation of a virus leak in China may lead to a new conflict with America
- Analysis and forecast for GBP/USD on May 4, 2020
- Instaforex Daily Analysis - 4th May 2020
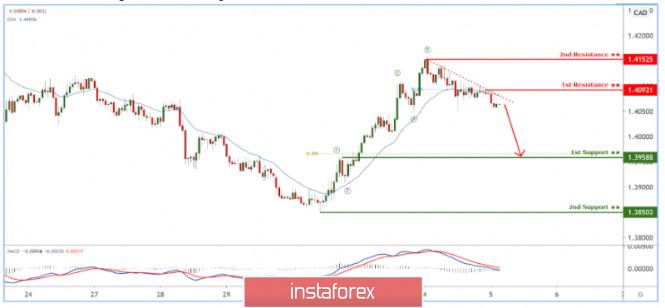
| USDCAD reacting below descending trendline resistance! Posted: 04 May 2020 08:19 PM PDT
Trading Recommendation Entry: 1.40920 Reason for Entry: descending trendline resistance, 38.2% Fibonacci retracement Take Profit : 1.39588 Reason for Take Profit: 61.8% Fibonacci retracement Stop Loss: 1.41525 Reason for Stop loss: Graphical swing high The material has been provided by InstaForex Company - www.instaforex.com |
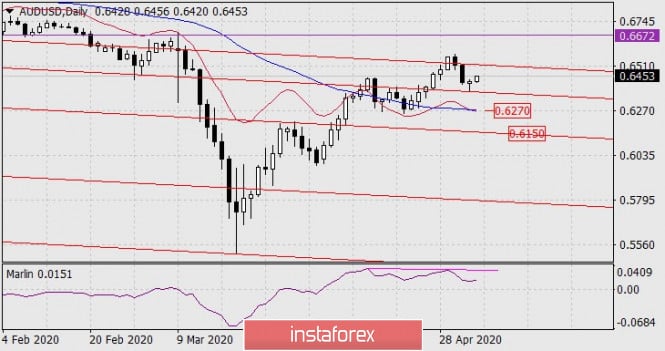
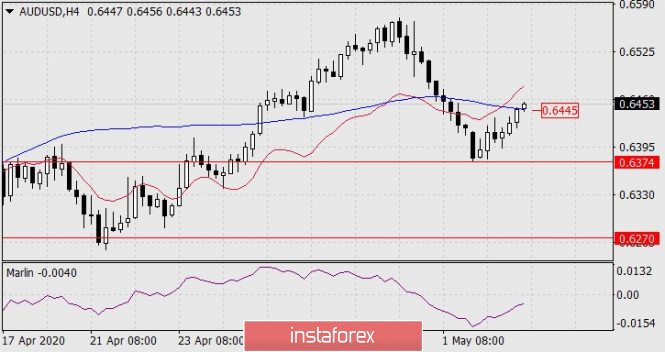
| Forecast for AUD/USD on May 5, 2020 Posted: 04 May 2020 07:58 PM PDT AUD/USD The Australian dollar worked out the support for the nearest line of the price channel and reflected from it, forming a correction from the fall since April 30. The divergence on the Marlin oscillator continues to act, we expect the price to fall. The first target of the bears is the MACD line at around 0.6270. The second target is determined by the embedded line of the price channel of 0.6150. The price has overcome the resistance of the MACD line on the four-hour chart, but the signal line of the Marlin oscillator located in the negative trend zone retains high chances of the price to turn above the MACD line. A direct signal for opening sales is when the price leaves the Monday low of 0.6374. The material has been provided by InstaForex Company - www.instaforex.com |
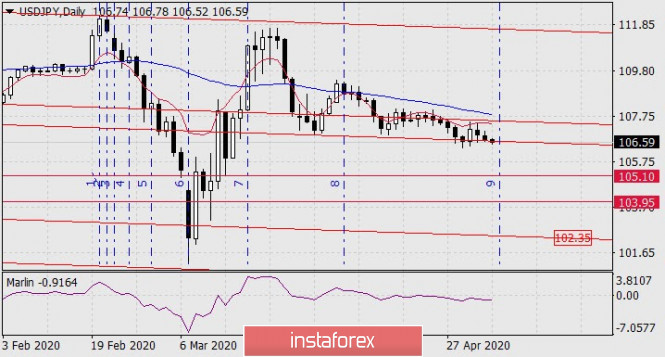
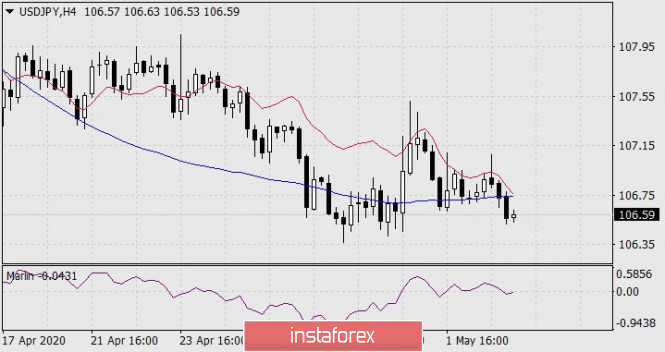
| Forecast for USD/JPY on May 5, 2020 Posted: 04 May 2020 07:58 PM PDT USD/JPY The USD/JPY quote once again approached the support of the embedded line of the price channel on Monday and the price went under it again this morning. Most likely, this downward movement is working, since tomorrow's candlestick will coincide with the 9th line of the Fibonacci time zone and will receive a strong acceleration down. The immediate goal of the yen is the 105.10 level, behind it is the 103.95 level. The price has consolidated below the MACD line on the H4 chart, the Marlin oscillator has penetrated into the zone of negative values, into the bearish zone. We are waiting for the falling sentiment on the USD/JPY to proceed further. On the practical side, it is possible to open short positions at current prices with a stop loss of 107.15. |
| Posted: 04 May 2020 05:24 PM PDT 4-hour timeframe
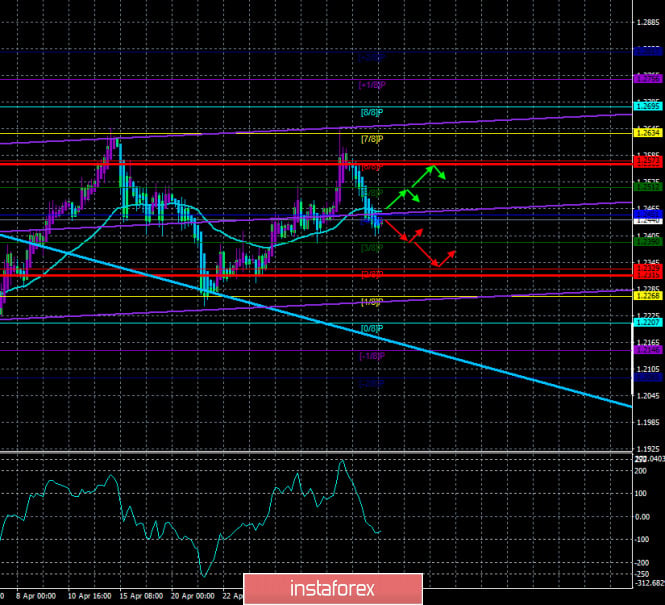
Technical details: Higher linear regression channel: direction - downward. Lower linear regression channel: direction - sideways. Moving average (20; smoothed) - sideways. CCI: -58.7810 The British pound started the new trading week with consolidation below the moving average line. Thus, the trend has changed to a downward one and short positions are now relevant. There was no major news from the UK on Monday. We can only note the fact that the rate of spread of "coronavirus" in the Nebula remains quite high. However, traders are now more interested in the technical picture and the overall geopolitical situation in the world. We believe that China and the United States are on the verge of a new conflict, which this time may not just be a trade conflict. Accordingly, we can expect anything from these two countries now. And the demand for the US dollar is growing at the beginning of the week, as traders flee from risky assets. The spread of "coronavirus" disease in the UK, if it is decreasing, then at a very low rate. Over the past day, 4,339 new cases of infection were recorded, which is only a few hundred less than the day before. Now the UK is "chasing" Italy and Spain, where 211,000 and 217,000 cases of "coronavirus" have been recorded, but in both these countries there is a decrease in the growth rate of disease, and quarantine measures are beginning to weaken. Thus, until May 26, when, according to preliminary information, London will begin to relax measures in the Foggy Albion, Britain can reach the net second place in the world for infection with the "Chinese infection". This is the price for not taking the epidemic seriously. By the way, the closest friend of the ruler of Great Britain Boris Johnson - Donald trump - leads the country, which is in first place in the world in terms of mortality and morbidity of "coronavirus". It is not surprising that in such circumstances, London is most interested in creating a vaccine as quickly as possible. Prime Minister Johnson considers this an issue of global significance and calls on all countries of the world to unite. "To win the battle against the virus, we need to work together to create an invulnerable shield that protects citizens. This can only be achieved by producing the vaccine on an industrial scale. The faster we join forces and share our experience, the faster scientists will succeed. The race to create a vaccine to fight this virus is not a competition between countries, but the most important task of our lives. We are talking about the confrontation between humanity and the virus, this is a common problem of all mankind, and together we will win," Johnson said. It is reported that the UK is ready to invest about 388 million pounds to fight the COVID-2019 virus. This money will have to go to purchase and conduct tests, as well as to develop a vaccine. A so-called donor conference will be held today to raise about 7.5 billion euros to provide every corner of the world with a vaccine that will be sold at affordable and fair prices. At least, this is what the head of the European Commission, Ursula von der Leyen, said. The conference will be attended by the Melinda and Bill Gates Foundation, WHO, and various other charitable foundations and organizations. The event is also supported by the top officials of Germany, France, and Italy - Angela Merkel, Emmanuel Macron, and Giuseppe Conte. On the second trading day of the week, only one macroeconomic report is planned in the UK – business activity in the service sector, which has a "smart" forecast of 12.3. Similar indicators will be released in the afternoon in the United States. We believe that all these three reports will be ignored by traders, as these figures are not particularly important for the UK economy or the US economy at the moment. An absolutely true proposition that the "coronavirus" will not be able to win any business activity or economic activity will not grow. Therefore, the goals of the health sector are now in the first place. And these goals are the same for the whole world. All the most interesting things for the British pound are planned for the second half of the week. That is when the Bank of England will hold a meeting, after summing up the results of which traders will be able to draw new conclusions. In the meantime, the situation in the currency market remains calm, and participants are more interested in the general fundamental background, which does not have a special impact on the market. The technical picture, as we have said many times before, remains the most important for analyzing and predicting the movement of the pound/dollar currency pair. On Monday, the pair's quotes were fixed below the moving average line, so the trend is now changed to a downward one. If we do not take into account the quarantine, the crisis, and the epidemic, we would say that the upward trend that began on March 20 is over. This is evidenced by a fairly large number of technical factors, the most important of which is the rebound from the Murray level of "7/8"-1.2634 twice. However, after the end of one trend, we often wait for the beginning of another. At this time, the downward trend may not start. On the weekend for the euro/dollar pair, we assumed that the quotes still began to consolidate, but not in a narrow channel, but in a fairly wide one (about 250 points). Approximately the same pattern can be observed for GBP/USD in the coming weeks, and the side channel is already clearly visible. It can be limited by the level of 1.2637 from above and by the area of 1.2207-1.2265 from below. Thus, its width will be about 400 points, but in the future, the channel may narrow. The main reason for the possible absence of a trend in the near future is the lack of support for one of the currencies by the macroeconomic or fundamental background, as well as the lack of panic in the market when both backgrounds do not matter at all. Therefore, we cannot now conclude that the US dollar or, conversely, the pound will become more expensive. The lower channel of linear regression has turned sideways, which already indicates that there is no trend in the medium term. In general, we would recommend that traders do not expect strong growth of any currency in the near future.
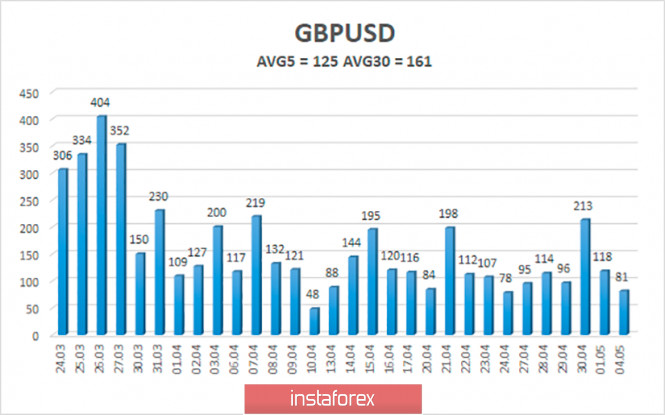
The average volatility of the GBP/USD pair has started to decline again and is currently 125 points. For the pound, this is not too much. The main thing is not to start a new trend of increasing volatility, which may mean a new panic in the market. On Tuesday, May 5, we expect movement inside the channel, limited by the levels of 1.2315 and 1.2565. A reversal of the Heiken Ashi indicator upward will indicate a round of an already ascending correction. Nearest support levels: S1 – 1.2390 S2 – 1.2329 S3 – 1.2268 Nearest resistance levels: R1 – 1.2451 R2 – 1.2512 R3 – 1.2573 Trading recommendations: The GBP/USD pair continues to move down on the 4-hour timeframe. Thus, traders are now recommended to sell the pound with the goals of 1.2390 and 1.2329 and keep the shorts open until the Heiken Ashi indicator turns upward. It is recommended to buy the pound/dollar pair again not earlier than the reverse price fixing above the moving average with the first goals of 1.2512 and 1.2565. Explanation of the illustrations: The highest linear regression channel is the blue unidirectional lines. The lowest linear regression channel is the purple unidirectional lines. CCI - blue line in the indicator window. Moving average (20; smoothed) - blue line on the price chart. Murray levels - multi-colored horizontal stripes. Heiken Ashi is an indicator that colors bars in blue or purple. Possible variants of the price movement: Red and green arrows. The material has been provided by InstaForex Company - www.instaforex.com |
| Posted: 04 May 2020 05:24 PM PDT 4-hour timeframe
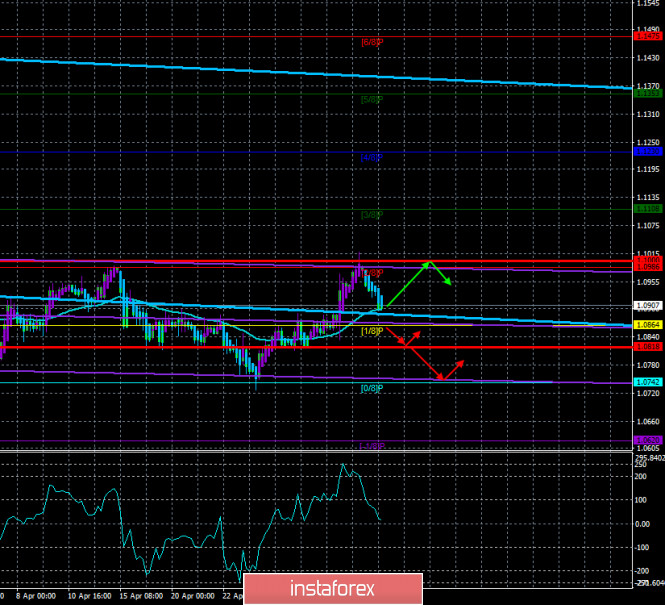
Technical details: Higher linear regression channel: direction - sideways. Lower linear regression channel: direction - sideways. Moving average (20; smoothed) - sideways. CCI: 10.4497 The EUR/USD currency pair starts in a downward correction on Tuesday, May 5. The day before, the euro/dollar pair worked out the moving average line, so it keeps the chances of resuming the upward movement. However, we believe that after overcoming the moving average, the pair will rush to the Murray level of "0/8"-1.0742, which is also the lower border of the side channel. We also note that the lower channel of linear regression is directed sideways, while the higher channel turns down, which also increases the probability of overcoming the moving average line. Also, the US dollar may be in demand due to the heat of passions between China and the US, and in such cases, the US currency is often in demand as the most secure, according to investors and traders. Meanwhile, the United States led by Donald Trump, who already feels that the chances of winning the election in November 2020 are rapidly falling, continue to "investigate" the leak of "coronavirus" from a Chinese laboratory in Wuhan. We deliberately put the word "investigation" in quotation marks, because in fact, no ordinary citizen can say with certainty whether there is any investigation at all. The White House can say anything and show no evidence of it. In fact, in most cases, Donald Trump and his supporters do so. Thus, we have little doubt that Washington will find evidence of anything in China. It is clear that the whole world, including the United States, is suffering from the "Chinese" pandemic. Even if the virus broke free completely by accident and there was no malicious intent or deliberate concealment of the facts on the part of Beijing, in any case, China is to blame for the leak of the infection, due to which the whole world is now suffering. Therefore, it is also possible to understand all the countries of the world that are now making claims to the Chinese side. The economies of all countries have suffered, and a series of bankruptcies of airlines and oil companies is expected, not to mention small and medium-sized businesses. Thus, Washington has the right to make claims. And no one will ever know the truth. No one will ever know whether the virus escaped from the Wuhan laboratory by accident or whether it was deliberately spread, whether the Chinese rulers were hiding and are now hiding the real scale of infection and mortality? And the most important question is, what is the current situation with the pandemic in China? Despite the fact that China has done a great job in quarantining and localizing the virus, it is very difficult to believe that in recent months there have been no new cases of infection. And according to official information, this is exactly the case. Donald Trump is considering the introduction of new sanctions and duties against China seriously. In one of the regular interviews that Trump gives out every day, he hinted that raising trade duties is one of the tools in negotiations with Beijing. "We all play a difficult game: chess or poker... It's not checkers, that's what I'll tell you," Trump said, hinting that China will be held accountable to the full extent of American laws. At the same time, the US special services conducted an investigation and concluded that China in early January really hid the scale of the epidemic and the high degree of contagion of the new virus in order to more easily purchase medical protection and necessary medicines. US intelligence agencies concluded that China reduced exports of some medical products in January and increased its imports while hiding and denying these facts. In turn, Secretary of State Michael Pompeo said that China deliberately misinformed the West. "This is a classic attempt at Communist disinformation," Mr. Pompeo said. "Beijing has done everything possible to prevent Western countries from learning in time about the true scale of the epidemic, or about the health threat posed by coronavirus infection." Pompeo also said that China has denied the West access to American doctors and specialists to the data and location of the new virus. So they're not going to cooperate. Thus, whether it is true or not, the United States already formally have the evidence on their hands. Now it is the turn for sanctions or, more simply, retaliatory actions. From our point of view, relations between China and the United States are now becoming complicated many times. If China's economy has already begun to recover from the quarantine and epidemic, the US economy continues to fall and will begin to recover at best in the third quarter. Thus, the American economy will lose much more than the Chinese one. Considering the fact that before this, two years trade negotiations between Beijing and Washington were held, which, according to many experts, were primarily beneficial to America, China delivered a good retaliatory strike, though not only in the United States, but around the world. Based on all the above, we believe that as soon as the "coronavirus" epidemic ends, and it is still very early to talk about it, a new battle will begin, which may affect the most developed countries of the world. It will be called "confrontation with China". Especially if there is no second wave of the epidemic in the Middle Kingdom. Especially if the total loss of the economy in China is much smaller than that of their main competitors. It is possible that China will fall into an economic blockade if it does not want to voluntarily "pay damages" for its negligence or criminal negligence. Thus, unfortunately, the world economy is unlikely to return to a state of rest in the near future. On Tuesday, May 5, the European Union is scheduled to publish an economic growth forecast - a summary of forecasts for key economic indicators. And in the United States on this day, the publication of business activity indices in the service sector according to the Markit and ISM versions is planned. The service sector is expected to decline from 52.5 to 32 points in May according to ISM and 27 points according to Markit. However, from our point of view, these figures do not matter now. They are in any case talking about the strongest decline in the service sector. Thus, we believe that market participants will ignore them, which means that today will again be empty in terms of the macroeconomic background. News, as always, should be expected from Donald Trump and from America in general. And technical factors will remain in the first place in terms of the degree of influence on the currency market.
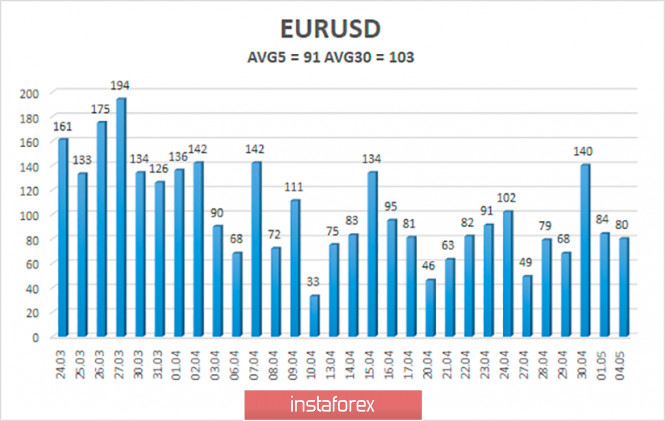
The volatility of the euro/dollar currency pair as of May 5 is 91 points. Thus, the indicator remains average in strength, close to high, and there is still no reason to expect a new wave of panic. Today, we expect quotes to move between the levels of 1.0818 and 1.1000. A reversal of the Heiken Ashi indicator upward may signal the end of a downward correction. Nearest support levels: S1 – 1.0864 S2 – 1.0742 S3 – 1.0620 Nearest resistance levels: R1 – 1.0986 R2 – 1.1108 R3 – 1.1230 Trading recommendations: The EUR/USD pair continues to be adjusted. Thus, traders are advised to open new purchases of Eurocurrency with targets at levels of 1.0986 and 1.1000, but only in case of a price rebound from moving. It is recommended to consider selling the euro/dollar pair no earlier than fixing the price below the moving average line with targets at 1.0818 and 1.0742. Explanation of the illustrations: The highest linear regression channel is the blue unidirectional lines. The lowest linear regression channel is the purple unidirectional lines. CCI - blue line in the indicator window. Moving average (20; smoothed) - blue line on the price chart. Murray levels - multi-colored horizontal stripes. Heiken Ashi is an indicator that colors bars in blue or purple. Possible variants of the price movement: Red and green arrows. The material has been provided by InstaForex Company - www.instaforex.com |
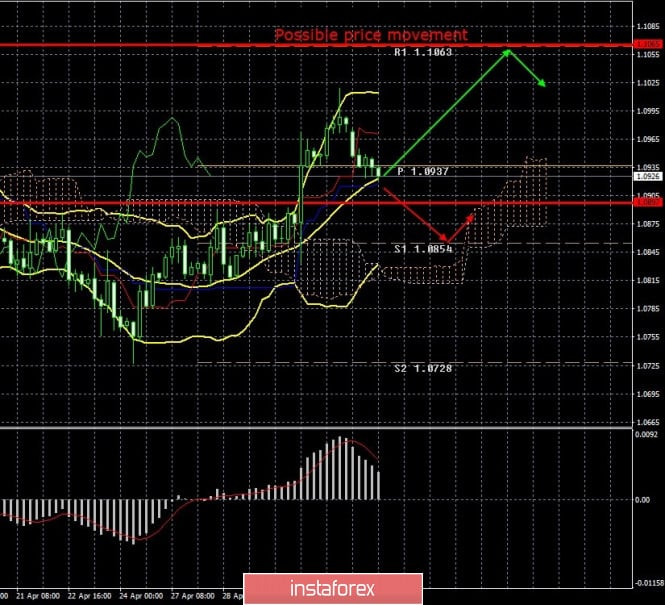
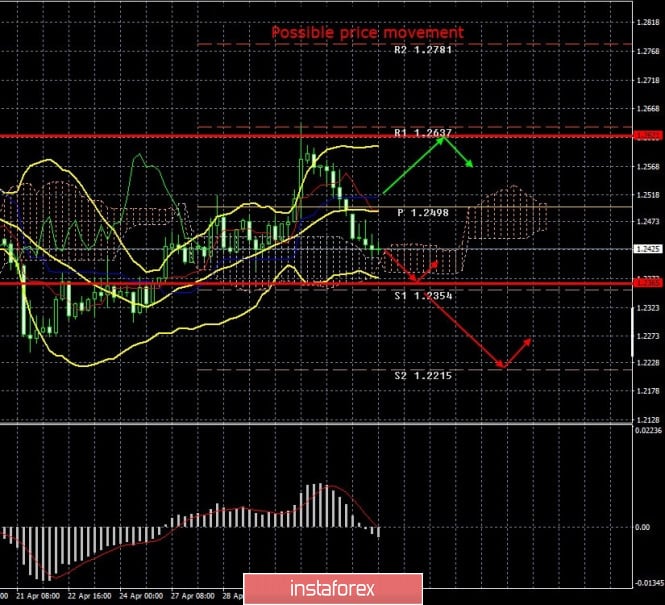
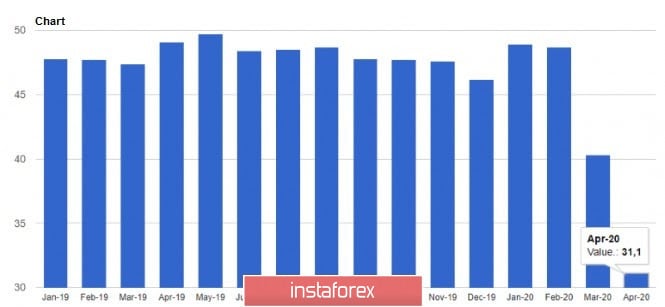
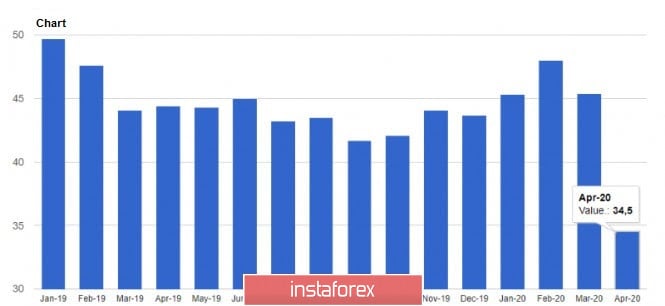
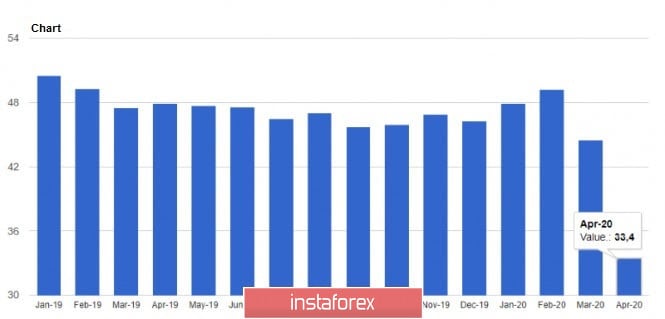
| Posted: 04 May 2020 01:20 PM PDT 4-hour timeframe Average volatility over the past five days: 84p (high). The EUR/USD pair was trading as it should be on Monday. As we expected in previous articles (published over the weekend), a downward correction began immediately after trade opened, which was justified by technical factors, and simply by the banal need to correct after a fairly strong growth of the euro/dollar pair. The technical factor is quite strong - working out the 1.0990 level, which is the previous high, as well as working out the psychological mark of 1.1000. Traders failed to overcome these two barriers, so a rebound and corrective movement followed. In fairness, it should be noted that there were no heavy arguments in favor of continuing the upward movement. We are more and more inclined towards the option of consolidating the pair in a wide side channel (250 points) with an upper border of about 1.1000 and a lower border of about 1.0750. At least, the recent weeks' movements are in this range. Moreover, the participants calmed down after a month of panic in the foreign exchange market, and now they need new reasons for trading in one direction or another. Considering the fact that all macroeconomic statistics and the fundamental background are ignored, then it means that technical factors are left, which just speak in favor of the movement in a wide side channel. Several reports unimportant in the current realities of the market were published in the European Union and the United States on Monday. Business activity indices in manufacturing sectors have become known in Europe today. The values are as follows: in Spain - 30.8, in Italy - 31.1, in Germany - 34.5, in France - 31.5, in general in the European Union - 33.4. Thus, all countries in terms of business activity in production are approximately at the same level. The values themselves did not impress traders at all, since it was already clear that they would collapse. However, compared to services, things are not very bad. In any case, a correction by the time this data is published has already begun and would continue in any case. So these reports had no effect. A report on production orders for March was published in the United States, which showed a decrease of 10.3% with a forecast of -9.7%. Considering the fact that both the euro and the pound continued to calm down after this publication, there is reason to believe that this report did not have any effect on the mood of traders. Traders in the current environment are much more interested in the question of what will happen after the epidemic can be overcome. Of course, this is still a long way off. There is no vaccine, but even when it is invented, it will take months to first produce it in the right quantities, and then to vaccinate the entire population of the planet. And we are also talking about poor African countries. Therefore, the end of the crisis and the epidemic in the near future should definitely not be expected. The best that the world can expect in the coming year is life in soft quarantine. However, most of us are still optimistic about the future, and therefore are interested in this issue. And the prospects for a world order after the end of the epidemic are very hopeless. Many developed countries of the world are already making claims to China regarding the spread of coronavirus. Suspicions that the COVID-2019 virus did not accidentally break free, and the Chinese government deliberately did not inform the whole world about the extent of the pandemic on its territory and the high threat of spread. The leaders of France and Germany have already spoken out. Well, about Donald Trump, who, thanks to China and its "gift", the chances of a re-election in November have significantly decreased, and there is nothing to say. The US president was determined to "get what he owed" from China. Now there is evidence that China deliberately hid important information about the virus, and also in every possible way delayed its publication in order to manage to purchase the necessary amount of medicines and medical remedies. According to Trump, these delays have led to the infection of the whole world. Trump also accuses China of not preventing the spread of the virus throughout the planet, as well as the World Health Organization that gave incorrect advice and generally failed the entire fight against the pandemic. "In my opinion, they (China) made a mistake and tried to hide it. They could not put out the fire on time. They stopped people who were traveling to China, but did not stop people who were traveling from China around the world," the US president said. As a result, Trump is seriously thinking about starting a new trade war with China. However, at the same time, China won't sit back and actually provokes the United States to answer its questions regarding the pandemic. In particular, through its print media, Beijing asks questions to Washington. For example: back in November 2019, U.S. intelligence officers informed the Pentagon and the White House that a new disease was spreading in the Chinese province of Wuhan. Later, the National Medical Information Center compiled a report describing the virus. Trump, according to reliable information, received reports on the virus for two months, but imposed a state of emergency only March 13. Why? 4-hour timeframe Average volatility over the past five days: 128p (high). The GBP/USD pair also continued to adjust on May 4, as we predicted during the weekend. A new signal for selling the Dead Cross from Ichimoku has formed today, so the trend for the pair has already changed downward. is approaching the Senkou Span B line, which lies very close to the volatility level of 1.2365 and the first support level of 1.2354. Thus, these three supports in total can become an insurmountable obstacle to a downward track. As for the macroeconomic background, there has not been a single important publication today in the UK. Therefore, even if traders had paid attention to the foundation now, nothing would have prevented the pound sterling from falling. As in the case of the euro, we believe that the GBP/USD pair may now begin to consolidate in a wide side channel (400 points). In addition, traders perfectly worked out the previous local high (about 1.2647) and rebounded off of it. Therefore, we also have the double top pattern at our disposal now. Recommendations for EUR/USD: For short positions: The EUR/USD pair started a corrective movement and could go below the critical Kijun-sen line after the pound on the 4-hour timeframe. Thus, you can consider selling the euro after consolidating the first goals of the support level of 1.0854 and the Senkou Span B line, but in small lots, so the Dead Cross is still weak. For long positions: Long positions will be relevant with the target resistance level of 1.1063 if there is a rebound from the Kijun-sen line. Recommendations for GBP/USD: For short positions: The pound dollar continues to move down. Thus, traders are advised to sell the British currency with the goals of the Senkou Span B line and the level of 1.2354, but in small lots, since the Dead Cross is still weak. For long positions: Purchases of the GBP/USD pair will again become relevant with the goal of 1.2621 not before consolidating the price back above the critical line. Explanation of illustrations: Ichimoku indicator: Tenkan-sen is the red line. Kijun-sen is the blue line. Senkou Span A - light brown dotted line. Senkou Span B - light purple dashed line. Chikou Span - green line. Bollinger Bands Indicator - 3 yellow lines. The MACD indicator is a red line and a histogram with white bars in the indicators window. Classic support / resistance levels - red and gray dashed lines with price symbols. Pivot level is a yellow solid line. Volatility levels are red solid lines. Possible price movements: Red and green arrows. The material has been provided by InstaForex Company - www.instaforex.com |
| May 4, 2020 : GBP/USD Intraday technical analysis and trade recommendations. Posted: 04 May 2020 09:35 AM PDT
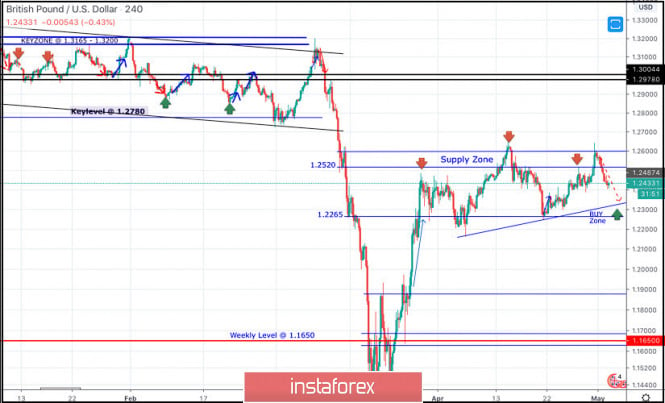
Recently, the GBPUSD has reached new LOW price levels around 1.1450, slightly below the solid Previous Weekly Low (1.1650) achieved in September 2016. That's when the pair looked very OVERSOLD around the price levels of 1.1450 where a double-bottom reversal pattern was demonstrated. Bullish breakout above 1.1900 invalidated the bearish scenario temporarily & enabled a quick bullish movement to occur towards 1.2260. Technical outlook remains bullish as long as bullish persistence is maintained above 1.1890-1.1900 (Double-Bottom Neckline) on the H4 Charts. Bullish persistence above 1.2265 has enhanced another bullish movement up to the price levels of 1.2520-1.2590 where significant bearish rejection as well as a quick bearish decline were previously demonstrated (In the period between 14th - 21 April). Currently, A Bearish Head & Shoulders reversal pattern may be in progress. The pair may be demonstrating the right shoulder of the pattern. Hence, Bearish persistence below 1.2265 (Reversal Pattern Neckline) was needed to enhance another bearish movement towards 1.2100, 1.2000 then 1.1920. However, the ongoing bullish price action is quite strong and this should be taken into consideration. That's why, any form of bullish breakout above 1.2600 brings more bullish momentum into the market. Conservative BUYERS should be waiting for bearish pullback towards the price levels of 1.2300-1.2360 where a low risk/reward BUY trade can be offered. Trade recommendations : Intraday traders were advised to look for bearish rejection around the SupplyZone (1.1550-1.2600) as a short-term SELL signal. T/P level to be located around 1.2450 then 1.2300 while S/L should be placed slightly above 1.2600. The material has been provided by InstaForex Company - www.instaforex.com |
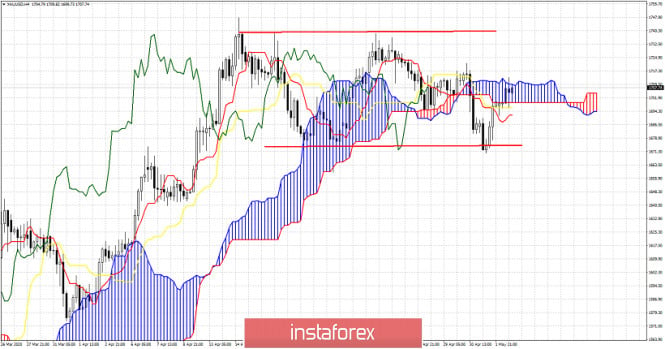
| Short-term Ichimoku cloud indicator analysis of Gold Posted: 04 May 2020 09:32 AM PDT Gold price is challenging important short-term Cloud resistance. After breaking below $1,700, Gold price bounced back towards the cloud resistance after touching the lower trading range boundary. A rejection at current levels and a move below $1,690 would be a very bearish sign.
Gold price continues to trade inside the trading range. Resistance is at $1,712-$1,720. As long as price is below this level, Gold is vulnerable to another sell off towards $1,630. Gold bulls need to recapture $1,720 for a move to $1,750-$1,800. Failure for bulls to hold above $1,690 will increase the chances of breaking below $1,669 recent low. The material has been provided by InstaForex Company - www.instaforex.com |
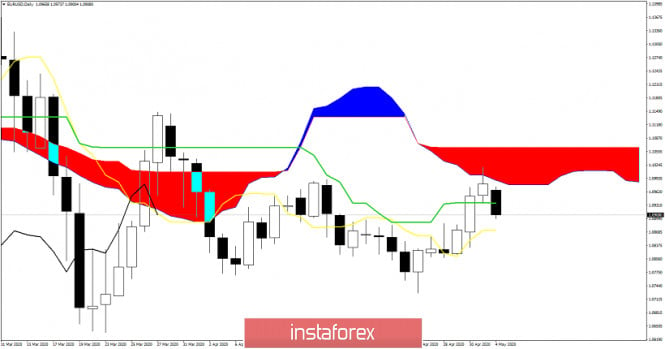
| Short-term Ichimoku cloud indicator analysis of EURUSD Posted: 04 May 2020 09:21 AM PDT EURUSD is getting rejected at the short-term cloud resistance area. Price reached our cloud target area and is now turning back. Price shows rejection signs and if we see more weakness below 1.09, we should consider this upward move as a counter trend bounce and we should expect price to continue lower below 1.07 over the coming weeks.
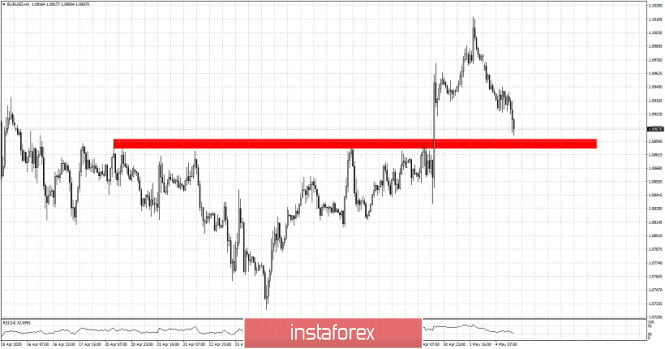
EURUSD had broken an inverted head and shoulders pattern to the upside. The neckline that was once resistance is now support. Price is now back testing the break out area. If price falls below the support area then I will take it as a bearish sign. If support area holds and price bounces, I will be expecting a move above 1.1030 over the coming sessions. The material has been provided by InstaForex Company - www.instaforex.com |
| May 4, 2020 : EUR/USD Intraday technical analysis and trade recommendations. Posted: 04 May 2020 09:19 AM PDT
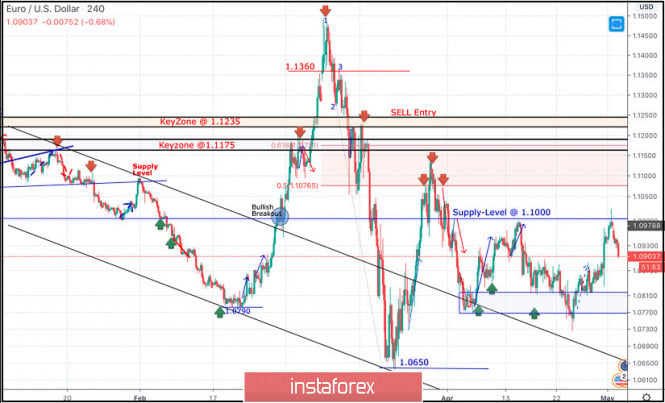
Few weeks ago, the EURUSD pair has expressed significant bullish recovery around the newly-established bottom around 1.0650. Bullish engulfing H4 candlesticks as well as the recently-demonstrated ascending bottoms indicated a high probability bullish pullback at least towards 1.0980 and 1.1075 (Fibonacci Level 50%). Key Supply-Levels in confluence with significant Fibonacci levels are located around 1.1075 (50% Fibonacci) and 1.1175 (61.8% Fibonacci) where bearish rejection was highly-expected upon the previous bullish pullback that took place on March 27. Thus, a bearish Head & Shoulders pattern was demonstrated around the price levels of (1.1000 - 1.1150). Further bearish decline was demonstrated towards 1.0800 where the nearest demand level to be considered was located near the backside of the broken channel (1.0800-1.0750). Recent signs of Bullish rejection have been manifested around the price zone of (1.0800-1.0750) leading to the recent bullish spike up to 1.0990. The short-term technical bullish outlook remains valid as long as bullish persistence is maintained above the recently-established ascending Bottom around 1.0770. Further bullish advancement is expected to pursue beyond 1.1000 towards 1.1175 where 61.8% Fibonacci Level is located. Despite the recent bearish decline, the price zone of (1.0815 - 1.0775) stood as a prominent Demand Zone which has been providing bullish support for the pair. Bullish breakout above 1.1000 is needed to enhance further bullish movement towards 1.1075 and probably 1.1150. On the other hand, Please note that bearish bearish persistence below the supply level around 1.1000 pauses the previously-mentioned bullish outlook. Trade recommendations : Intraday traders were advised to look for valid short-term BUY trades around the price zone of 1.0815 - 1.0775. S/L should be advanced to 1.0900 to secure profits while remaining T/P levels to be located around 1.1075 then 1.1175 if sufficient bullish momentum is maintained. The material has been provided by InstaForex Company - www.instaforex.com |
| Posted: 04 May 2020 07:46 AM PDT The final data on activity in the manufacturing sector of the Eurozone confirmed the complexity of the situation in which the economy is located. Due to the coronavirus pandemic, production fell in all countries at once, but Italy was most unlucky, were due to strict restrictive measures, production fell much more than in neighboring countries. According to a report by Markit, the purchasing managers' index (PMI) for the Italian manufacturing sector in April this year fell to 31.1 points, while in March it was at the level of 40.3 points. Economists had forecast a decline to a level of 30.0 points. France is not far from Italy, where the purchasing managers' index for the manufacturing sector in April was 31.5 points against 43.2 points in March, with the forecast of economists of 31.5 points. As for the Italian economy, today a report has been published at Citi Bank, according to which, with the current fiscal stimulus measures that the authorities promise to direct to mitigate the effects of the coronavirus pandemic, the growth of public debt in relation to GDP this year will increase immediately by 20 %, which will necessarily lead to the risk of lowering the credit rating, which was recently discussed in the world rating agencies S&P and Fitch. Therefore, it is not surprising that Italy is one of the first to advocate the introduction of nationwide bonds, which will lead to the generalization of the Eurozone's debt, allowing to shift its debt burden to the stronger northern EU countries. Activity declined the least in Germany, which is still trying to counteract the economic downturn on its own against the background of the coronavirus pandemic. According to the report, the purchasing managers' index (PMI) for Germany's manufacturing sector fell to 34.5 points in April from 45.4 points in March, with a forecast of 34.4 points. A sharp reduction in orders, disruption in logistics chains, as well as layoffs of employees of many manufacturing companies negatively affected activity in general, and it is still very early to say that the indicator has reached its bottom. Most likely, May will also be without much improvement, as the authorities are not in a hurry to cancel the quarantine measures and remove the restrictions imposed. For the Eurozone, the purchasing managers' index (PMI) for manufacturing also fell significantly, to 33.4 points in April from 44.5 points in March. Given that the data almost coincided with the preliminary indicators, this did not put much pressure on the European currency, but it was also not possible to return the demand for risky assets after the Asian market fall. Today, many traders focused on the report of the European Central Bank, whose analysts sharply lowered their forecasts for inflation and economic growth in the Eurozone in 2020. It is expected that inflation in the Eurozone in 2020 will be at the level of 0.4% against the January forecast of 1.2%. In 2021, the indicator is projected to gradually recover to the level of 1.2% and to 1.4% in 2022. As for real GDP, it forecasts a reduction of 5.5% against the January forecast of 1.1% growth. But by 2021, the increase will be more than 4.3%. As for the technical picture of the EURUSD pair, it remained unchanged. Given that there is no activity on the part of buyers of risky assets, as well as no growth in the resistance area of 1.0980, which was expected in the European session, it is likely that the pressure on the euro will continue. At the moment, it is best to consider buying risky assets only after a correction to the support of 1.0890 or from a larger minimum of 1.0840. The material has been provided by InstaForex Company - www.instaforex.com |
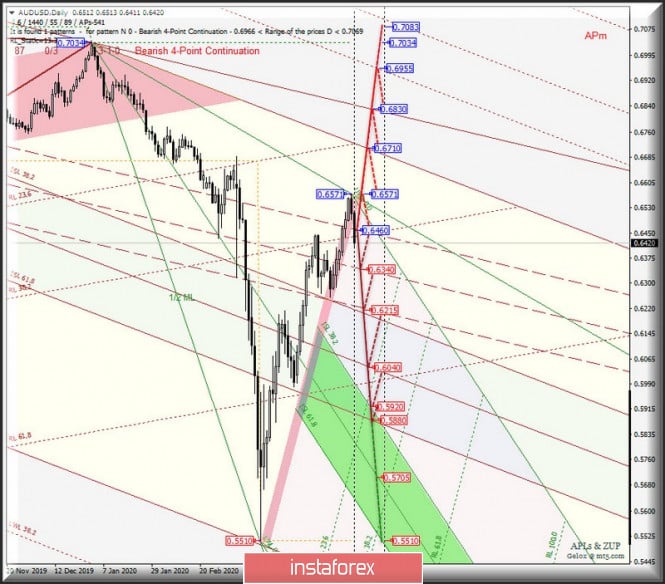
| Posted: 04 May 2020 07:31 AM PDT Minor operational scale (Daily) May - commodity currencies AUD/USD & USD/CAD & NZD/USD - options for the development of the movement from May 5, 2020. ____________________ Australian dollar vs US dollar In May 2020, the development of the movement of the Australian dollar AUD/USD will be due to the development and direction of the breakdown of the boundaries of the 1/2 Median Line channel (0.6460-0.6340-0.6215) of the Minor operational scale fork - the markup of movement inside this channel is presented on the animated graph. A breakdown of the lower border of the 1/2 medium Line Minor channel - the support level of 0.6215 - will determine the further movement of the Australian dollar already in the equilibrium zone (0.6215-0.6040-0.5880) of the Minor operational scale fork. If the upper limit of the 1/2 medium Line Minor channel is broken - the resistance level of 0.6460 - it will be possible to resume the upward movement of AUD/USD to the targets:
With the prospect of reaching the warning line UWL38. 2 Minor 0.6955. The markup of the AUD/USD movement options in May 2020 is shown on the animated chart.
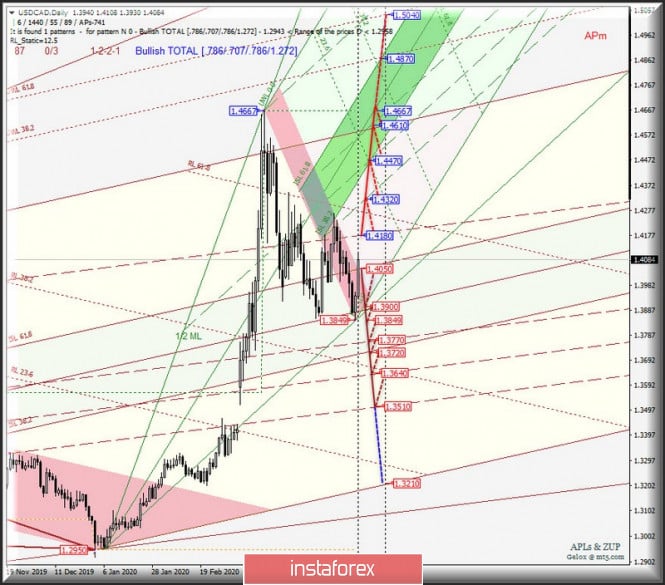
____________________ US dollar vs Canadian dollar The development of the movement of the Canadian dollar USD/CAD in May 2020 will be determined by the development and direction of the breakdown of the range:
A breakdown of the resistance level of 1.4180 on the final Shiff line Minor will determine the development of the USD/CAD movement to the borders of the 1/2 Median Line channel (1.4320-1.4470-1.4610) and equilibrium zones (1.4470-1.4667-1.4870) of the Minuette operational scale fork. If the support level of 1.4050 on ISL61.8 Minor - option of the movement of the Canadian dollar in the zone of equilibrium (1.4050-1.3900-1.3720) and channel 1/2 Median Line (1.3770-1.3640-1.3510) of the Minor operational scale fork. The markup of the USD/CAD movement options in May 2020 is shown on the animated chart.
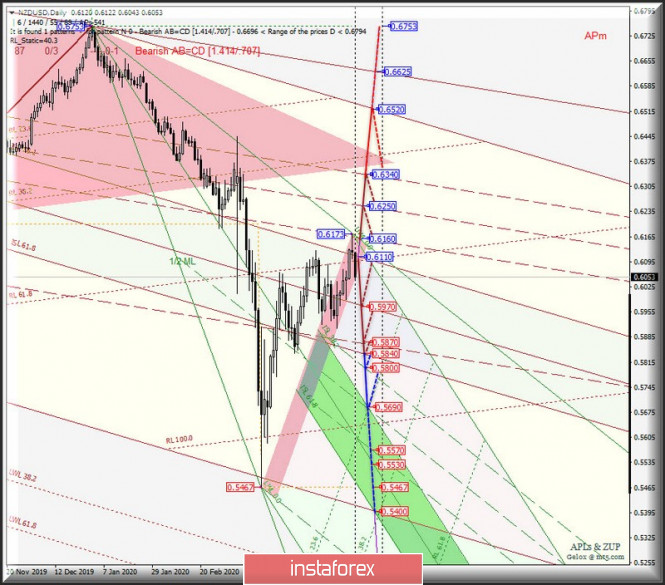
____________________ New Zealand dollar vs US dollar The development of the movement of the New Zealand dollar NZD/USD in May 2020 will also depend on the development and direction of the breakdown of the boundaries of the equilibrium zone (0.6110-0.5970-0.5840) of the Minor operational scale fork - the movement markings inside this zone are shown on the animated chart. Breakdown of the lower border of ISL61.8 equilibrium zone of the Minor operational scale fork - support level of 0.5840 - an option for the New Zealand dollar to reach the borders of the 1/2 Median Line channel (0.5800-0.5690-0.5557) of the Minuette operational scale fork. The breakdown of the top border ISL38.2 zone equilibrium of the Minor operational scale fork - resistance 0.6110 - the movement of NZD/USD can be continued to the boundaries of the channel 1/2 Median Line Minor (0.6160-0.6250-0.6340) of the achievement of the initial line SSL (0.6520) of the Minor operational scale fork. We look at the markup of the NZD/USD movement options in May 2020 on the animated chart.
____________________ The review is compiled without taking into account the news background, the opening of trading sessions of the main financial centers, and is not a guide to action (placing "sell" or "buy" orders). The material has been provided by InstaForex Company - www.instaforex.com |
| Evening review for May 4, 2020. EURUSD Posted: 04 May 2020 07:14 AM PDT
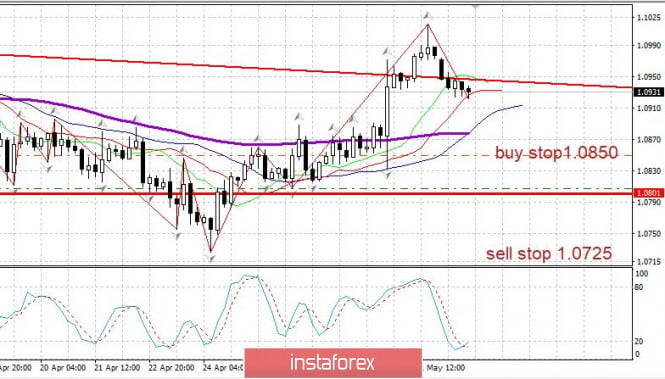
EURUSD faced a decline in the correction. For those who did not have time to buy euros from 1.0850, you can buy from 1.0930. Stop at 1.0850. You may keep purchases from 1.0850, the stop has been moved to breakeven. If the euro drops to 1.0850, the attempt to move up again the range will be canceled. If it reaches 1.0870 an upward trend is possible. Keep on observing. The material has been provided by InstaForex Company - www.instaforex.com |
| US Jobs report, Bank of England meeting, and important events that lie ahead the week Posted: 04 May 2020 06:14 AM PDT
One of the focus events of this week is the April US Jobs Report. The overall picture is expected to be appalling as the US Department of Labor is likely to report a loss of 21 million jobs. This happens after a 701 thousand job cut in March when the historic job growth ended. According to experts, the unemployment rate will jump to 16%. Over the past six weeks, more than 30 million Americans have applied for unemployment benefits in the United States. This is over 18% of the working population of the country. New data is likely to increase pressure on the states. Authorities may be forced to open enterprises, despite the fact that the number of cases of coronavirus infection at some points in the country continues to increase. According to the latest data, the number of registered cases has increased to more than 1.1 million, including about 65 thousand deaths. Meanwhile, governors in about half of the US states partially opened the economy over the weekend. Georgia and Texas are leading the way. Market traders will closely monitor progress in European countries, which are taking cautious steps to resume economic activity. From Monday, after a long quarantine, Italian factories and construction sites open. German schools, museums, churches will open their doors. The UK will work out its quarantine strategy in the coming days. Europe fears a second wave of infection. Given that the ECB expects the eurozone economy to fall in the second quarter by as much as 15%, the authorities will seek to resume economic activity. Trading problems If the second wave of the virus is still at the level of fears, then a new round of trade conflict between the US and China seems to be on the way, which spoils the mood of the markets. A new week began with a drop in risk appetite. Investors return to safe-haven assets and started to buy dollars. This trend may strengthen in the week. USD
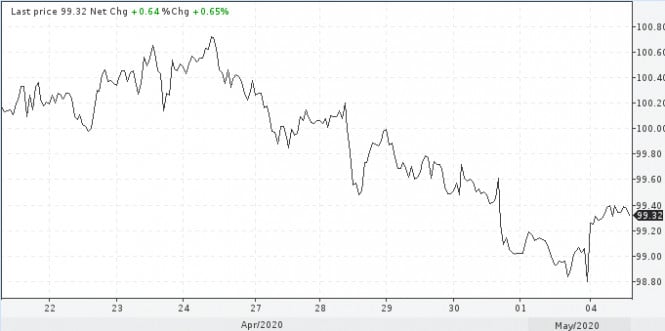
The US President accuses China of a man-made virus, and Washington is considering raising tariffs on goods from China to be one of the ways to punish for untimely informing the world about the threat of infection. It is not yet clear how much Donald Trump is willing to risk the failure of his trade deal with Beijing. It is possible that he will move from words to deeds, since the US presidential election is ahead, and his re-election in November is threatened by high mortality from coronavirus and economic damage. The flaring conflict between the United States and China will negatively affect the price of oil in the long run, which is already barely alive. After a 3-day growth on Monday, quotes again went to negative territory. This year, the Brent brand has lost almost 60% of its value and reached a 21-year low in April due to the pandemic which destroyed demand. On May 1, the OPEC + deal to reduce production came into force, however, analysts doubt that this will be enough in the current realities. As before, it will no longer be, and what will happen is unknown. So far, only one thing is clear, that is, high volatility in the oil market will continue. Brent
What to expect from the pound after a meeting of the Bank of England The Bank of England is unlikely to make changes in monetary policy, so traders will focus on the publication of a new economic forecast. In this regard, they will closely monitor the dynamics of the GBP / USD pair. At past auctions, the rate fell to 1.2508, losing about 80 points per day. Today, the pair continues to be under pressure, including amid the growing US dollar. This dynamics may continue until Thursday, when the British regulator holds its next meeting. Traders do not expect an improvement in the economic situation in the country. Data on activity in the service sector, which accounts for about 80% of national economic growth, will be presented on Tuesday. According to experts, the indicators will display a record drop by analogy with the industrial sector. If the forecast comes true, the Bank of England may go for additional measures of monetary stimulus and the pound will be under even greater pressure. GBP / USD
The factor of a long-term decline in the GBP / USD pair is still the prospect of an unswayed Brexit. Last week, negotiations between the EU and Britain was again stalled. The material has been provided by InstaForex Company - www.instaforex.com |
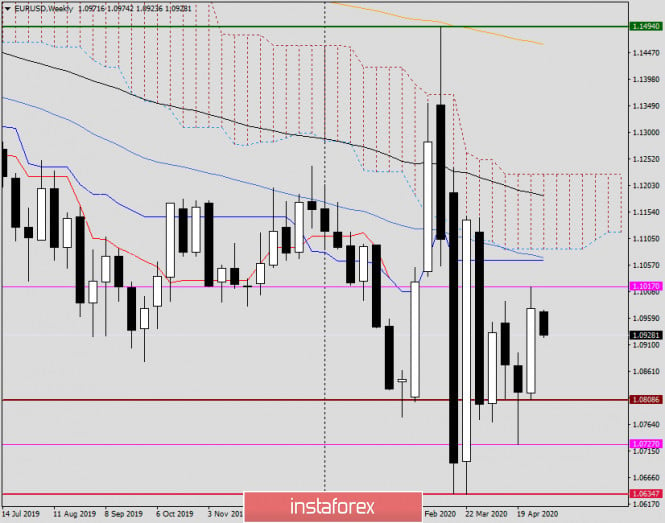
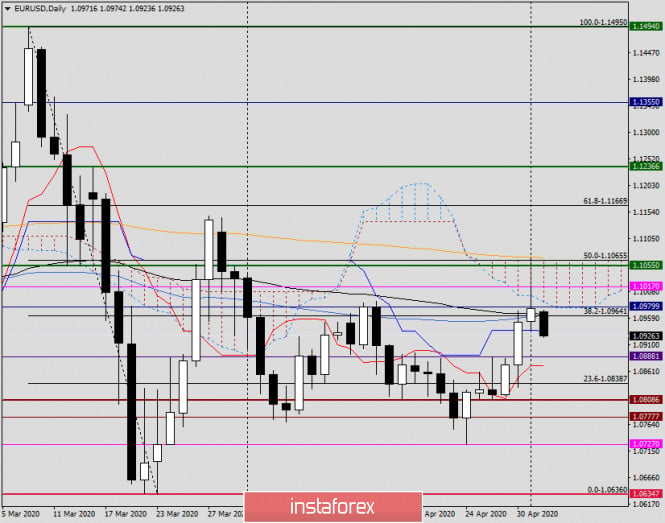
| EUR/USD analysis and forecast for May 4, 2020. Posted: 04 May 2020 04:54 AM PDT Hello everyone! The EUR/USD pair rallied for the past five trading days, the growth of which amounted to 1.46%. The week was not the best for the US dollar, as the instrument weakened against all its major competitors, and suffered the most losses in tandem with the single European currency. The article will analyze the technical picture of the EUR/USD pair, outline the main macroeconomic reports that may affect its price dynamics, and discuss the COVID-19, which continues to affect the mood of market participants. Continental Europe is preparing to lift its strict restrictive measures to gradually return to normal life. Construction companies and industrial enterprises in Italy are resuming work today, despite the fact that the country was the most affected by the coronavirus pandemic. Yesterday, 174 people died, which is the lowest recorded daily mortality rate in Italy since the introduction of quarantine. Prime Minister Boris Johnson, who previously contracted the coronavirus, is also considering lifting a number of restrictions in the UK. However, many virologists fear a re-outbreak of the pandemic, so it's quite early to relax and completely cancel all quarantine activities. The US, meanwhile, continues to blame China for misinforming and hiding the real extent and consequences of COVID-19. Following US President Donald Trump, US Secretary of State Mike Pompeo spoke in a similar vein. A lot of macroeconomic statistics will be published this week, the main event of which will be data on the US labor market, which will come out on May 8 at 13:30 (London time). Data on retail sales, the PMI index and other reports will come from the eurozone. The report on production orders in the US will come out today at 15:00 (London time). Weekly
As noted above, the EUR/USD pair rallied last week and closed at 1.0977. In addition, the pair tested the important technical and psychological level of 1.1000, setting maximum values at 1.1017. Continuation of the rally, as well as an update of the previous highs, will set the next targets for EUR/USD in the price area of 1.1065-1.1087, from which the Kijun line of the Ichimoku indicator, 50 SMA and the lower border of the Ichimoku cloud are located. A break of the 1.0808 support down, from which last week's lows are located, will indicate a bearish scenario, but judging by the technical picture, the quotes have every chance to continue rising, but much will depend on Friday's US labor market reports, which are the most important data that will put an end to trading on May 4-8. Daily
Trading on May 1 ended above 50 SMA and 89 EMA in the daily chart, as well as in the 38.2 level of the Fibonacci grid, which is stretched to a decline of 1.1495-1.0636. However, such cannot be considered a true breakdown of both movings and 38.2 Fibo, since one candle closed above is not enough for such judgment. At the end of this article, the pair is trading slightly down, correcting the previous growth. Conclusion and trading recommendations for the EUR / USD pair: Considering the previous weekly growth, closing price and the already tested break of the symbolic level of 1.1000, bullish mood will continue in the EUR/USD pair. If such assumption turns out to be true, the main trading idea for EUR/USD is to consider purchases after declines in the area of 1.0920-1.0880. Sales will be relevant if the corresponding candle signals appear on the daily, 4-hour and (or) hourly time frames, in the area of 1.0960-1.1000. The long upper shadow of Friday's candle does not exclude a downward scenario. Perhaps, after today's trading ends, clearer signals will be observed, and the trading ideas will be adjusted. Good luck! The material has been provided by InstaForex Company - www.instaforex.com |
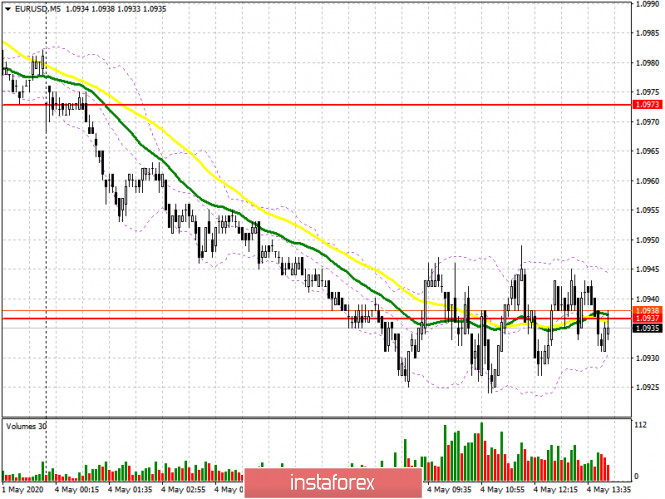
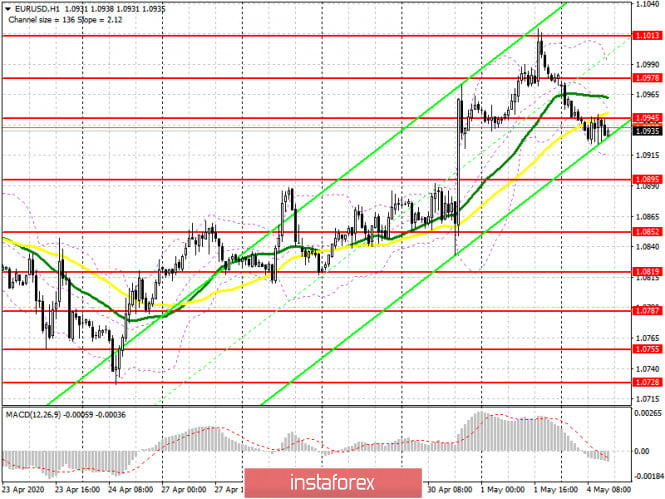
| Posted: 04 May 2020 04:51 AM PDT To open long positions on EURUSD, you need: In my morning forecast, I paid attention to the support level of 1.0937 and the probability of forming a false breakout, which would allow us to build a larger upward correction in the pair. However, after several unsuccessful attempts, which are visible on the 5-minute chart, and weak data on manufacturing activity in the Eurozone, it was not possible to return to the maximum of 1.0973. Now if we look at the hourly chart, by the beginning of North American trading, a new resistance of 1.0945 has already formed, which the bulls need to focus on. Only a break and consolidation above this level will allow you to get to a larger maximum of 1.0978 and then get to a larger resistance of 1.1013, where I recommend fixing the profits. If the pressure on EUR/USD continues, it is best to postpone long positions until the test of the minimum of 1.0895 or buy immediately for a rebound from the support of 1.0852 in the expectation of correction of 25-30 points within the day.
To open short positions on EURUSD, you need: Sellers continue to be active in the area of a new resistance of 1.0945, and while trading is below this level, the pressure on EUR/USD will remain, which will lead to an update of a new low of 1.0895, where I recommend fixing the profits. However, it will be possible to talk about a break in the upward trend in the euro from April 24 only after testing the minimum of 1.0852. If the bulls manage to get above the resistance of 1.0945, I recommend that you postpone short positions until the test of a larger level of 1.0978, again provided that a false breakout is formed there or sell EUR/USD immediately to rebound from the maximum of 1.1013. However, given the fact that no important fundamental statistics are scheduled for release in the second half of the day, trading may remain around the morning range of 1.0945.
Signals of indicators: Moving averages Trading is already below the 30 and 50 daily moving averages, but they have not yet crossed each other, which keeps the market on the side of buyers and does not exclude their active attempt to return in the second half of the day. Note: The period and prices of moving averages are considered by the author on the hourly chart H1 and differ from the general definition of the classic daily moving averages on the daily chart D1. Bollinger Bands A break in the lower border of the indicator around 1.0915 may lead to a larger sale of the European currency. The growth of the euro will be limited by the upper level of the indicator in the area of 1.0990, from where you can open short positions immediately on the rebound. Description of indicators
|
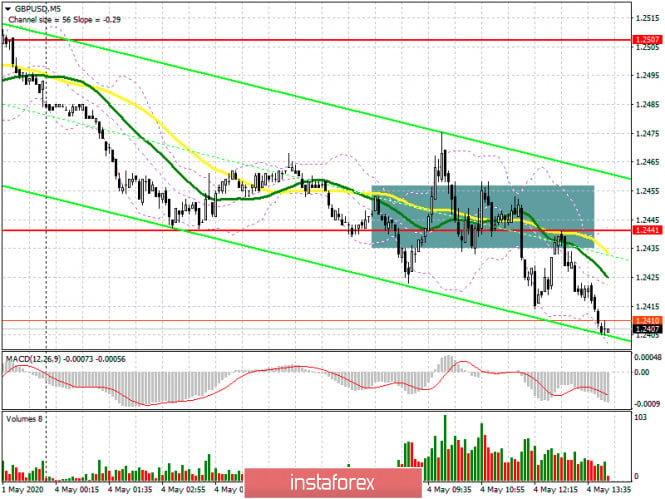
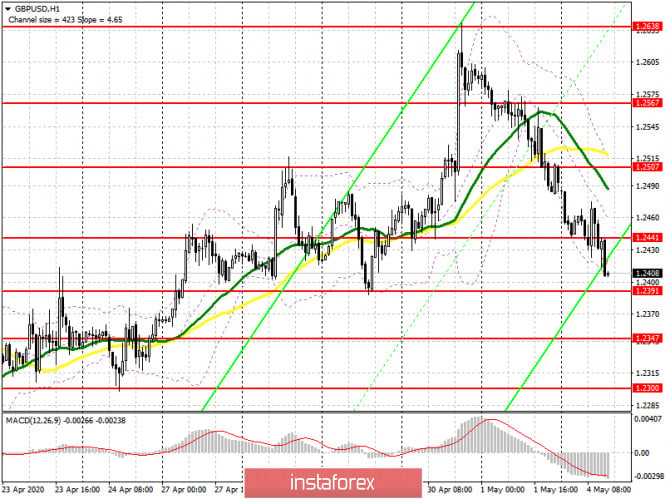
| Posted: 04 May 2020 04:51 AM PDT To open long positions on GBPUSD, you need: In the morning, everything happened exactly as I expected. The bulls tried to make a false breakout of the support of 1.2441 and build a larger upward correction, but nothing came of it. If you look at the 5-minute chart, you will see how, after a false breakdown and upward movement from the level of 1.2441, pound buyers tried several times to resume the pair's growth, but could not even update the correction maximum, which ultimately led the pair to return to the area of 1.2441 and further sale of GBP/USD. At the moment, the task of the bulls is to return to the resistance of 1.2441, since only in this case can we expect an upward correction to the resistance of 1.2507, where I recommend fixing the profits. However, it is best to postpone long positions until the decline to the support area of 1.2391, provided that a false breakout is formed there. But I recommend buying the pound immediately for a rebound from the minimum of 1.2347 in the expectation of correction of 30-40 points within the day.
To open short positions on GBPUSD, you need: Sellers coped perfectly with the morning task and after active purchases returned the pair to the level of 1.2441, the test of which from the bottom up (see the 5-minute chart) was a good signal to open short positions in the expectation of continuing the decline of the pound to the minimum of 1.2391, where the pair is now aiming. A break in this range will quickly push GBP/USD to the next area of 1.2347, where I recommend fixing the profits. If the bulls make another attempt to regain the resistance of 1.2441, and this cannot be excluded, since in the second half of the day there is no expected release of important fundamental statistics, then it is best to return to short positions only for a rebound from the daily maximum in the area of 1.2507, where the moving averages are located. Also, do not forget that the sellers managed to break the upward trend formed on April 21, and closing the day below the level of 1.2441 will only increase the pressure on the pair.
Signals of indicators: Moving averages Trading is below the 30 and 50 daily averages, which indicates the formation of a new bear market. Note: The period and prices of moving averages are considered by the author on the hourly chart H1 and differ from the general definition of the classic daily moving averages on the daily chart D1. Bollinger Bands A break in the lower border of the indicator around 1.2415 will increase the pressure on the pound. Growth will be limited by the upper level of the indicator in the area of 1.2507, from where you can sell immediately on the rebound. Description of indicators
|
| Posted: 04 May 2020 04:46 AM PDT Corona virus summary:
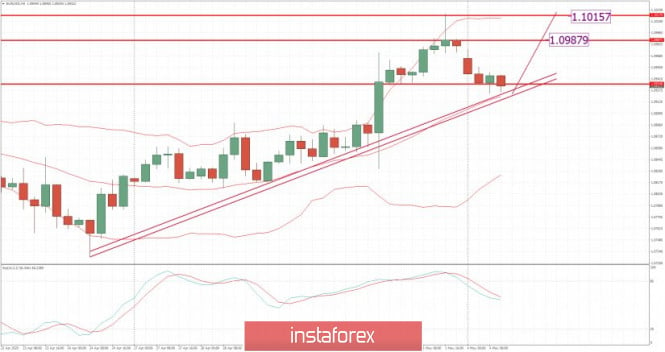
More than 10 times as many people in Germany have likely been infected with the coronavirus than the number of confirmed cases, researchers from the University of Bonn have concluded from a field trial in one of the worst hit towns. The preliminary study results, which have yet to be peer reviewed for publication in a scientific journal, serve as a reminder of the dangers of infection by unidentified carriers of the virus, some of whom show no symptoms, the researchers said. The readings come as Germany took further steps on Monday to ease restrictions, with museums, hairdressers, churches and more car factories reopening under strict conditions. Technical analysis: EUR/USD has been trading downwards. The price tested and rejected of the solid support at the price of 1,0925, which is sign that there is potential for the new push higher. Trading recommendation: Watch for buying opportunities on the EUR. The 4H time-frame is sugesting that there is room for the upside cycle due to the bull flag pattern in play and rejection of the middle Bollinger line. Upward targets are set at the price of 1,0987 and 1,1015 Resistance levels are set at the price of 1,0987 and 1,1015. Support level is set at the price of 1,0925 The material has been provided by InstaForex Company - www.instaforex.com |
| Posted: 04 May 2020 04:31 AM PDT Corona virus summary:
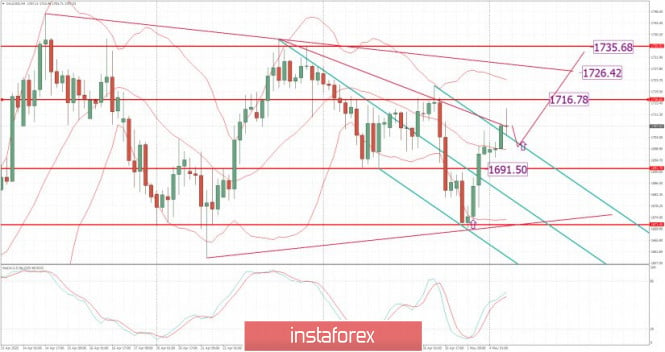
US officials believe China hid virus's severity to hoard medical supplies. An intelligence report by US Department of Homeland Security, obtained by AP, claims China covered up the extent of the coronavirus outbreak and how contagious the disease is to stock up on medical supplies needed to respond to it. The report follows claims by US defence secretary Mark Esper that Russia and China are taking advantage of the coronavirus emergency to put their interests forward in Europe.Technical analysis: Trading recommendation: Watch for buying opportunities on the Gold on the dips using the intraday frames like 15/30 minutes. The next upward targets are set at the price of $1,716, $1,715 and $1,735. Stochastic is showing that bullish cycle is present with no indication for any reversal yet... Resistance levels are set at the price of 1,716, $1,715 and $1,735. Support levelsare set at $1,704 and $1,691 The material has been provided by InstaForex Company - www.instaforex.com |
| Posted: 04 May 2020 04:20 AM PDT Corona virus summary:
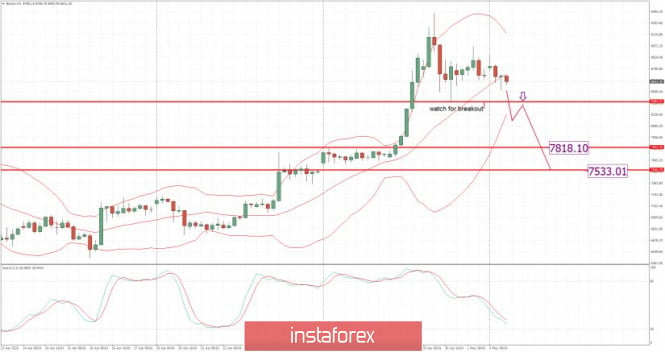
Japan extends the country's national state of emergency to May 31Japan's prime minister Shinzo Abe said on Monday he had decided to extend the country's national state of emergency to May 31, Reuters reports. Abe will consider lifting the state of emergency without waiting for its 31 May expiration if experts decide that is possible based on detailed analysis of regional infection trends, he said at the start of a meeting of the government's coronavirus task force. Technical analysis: BTC has been trading sideways at the price of $8,740. I still see potential for the downside movement towards the level at the price of $7,800 Trading recommendation: Watch for potential breakout of the pivot support at $8,385 to confirm further downside movement. In case of the downside breakout, watch for selling opportunities with the targets at $7,820 and $7,533. Resistance levels are set at the price of $9,060 and $9,460 Support levelsare set at $8,385, $7,820 and $7,533 The material has been provided by InstaForex Company - www.instaforex.com |
| Trading plan for EUR/USD for May 04, 2020 Posted: 04 May 2020 04:15 AM PDT
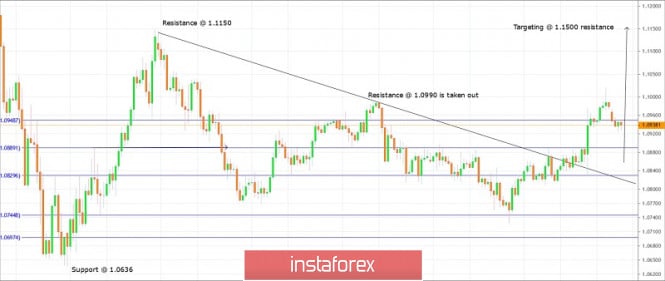
Technical outlook: EUR/USD had rallied through 1.1019 highs last week before pulling back lower again. An intermediary resistance at 1.0990 levels has been taken out as well and hence a corrective drop was expected. Please note that recent upswing is between 1.0730 and 1.1019 respectively and the fibonacci 0.618 retracement is seen towards 1.0837 levels. A drop to those levels would attract good support and EUR/USD may resume its rally towards 1.1500 thereafter. Further, EUR/USD can drop to test the back side of resistance trend line below 1.0800 levels, which should act as support now. A bullish reversal there remains high probability for the next leg higher towards 1.15/1.16. Trading plan: Remain long, stop below 1.0636, target is 1.1500 Good luck! The material has been provided by InstaForex Company - www.instaforex.com |
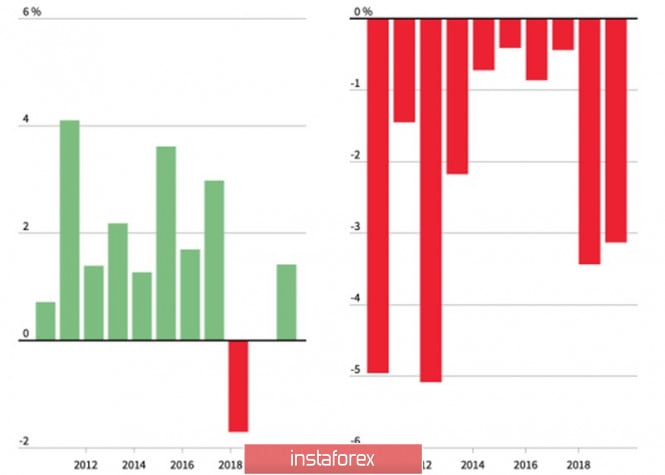
| Posted: 04 May 2020 04:03 AM PDT The tax period, the repatriation of capital to the homeland, and the inflow of dividends from investments in foreign assets allowed the British pound to grow in April for two decades where only 2004 and 2018 became an exception. On one hand, May is not traditionally set for sterling. Every year since 2010, GBP / USD quotes for the last month of spring closed in the red zone, while the average loss of the pound was 2.3%. Will the bears play into the hands of the seasonal factor in 2020? British pound dynamics in April and May:
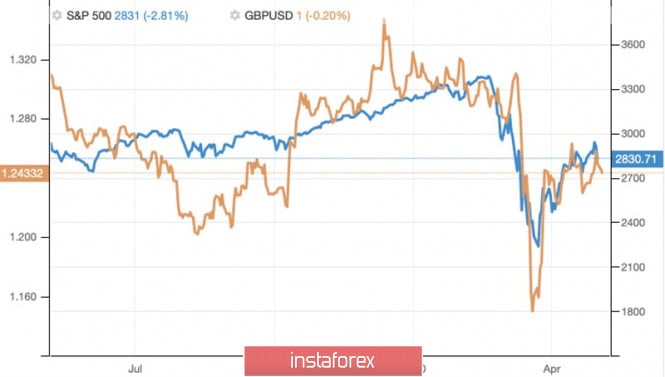
The success of sterling in April seems logical. Amid large-scale fiscal and monetary incentives, as well as hopes of opening the world's leading economies after quarantine, and the best rally of US stock indices for the GBP / USD pair over the past 33 years, the path to an upward trend was opened . The correlation of the pound with global risk appetite has increased significantly, while the growth of the pound has become a kind of tailwind for the bulls in the analyzed pair. In May, the picture may radically change. The horrific corporate reporting and macro statistics added the risks of escalating the US-China trade conflict after Donald Trump accused Beijing of the laboratory origin of coronavirus and threatened with new duties. The main test for the S&P 500 and GBP / USD buyers will be the release of data on the American labor market. According to the consensus forecasts of the Wall Street Journal experts, the unemployment rate will reach a new historical maximum of 16.1%, and employment will decrease by 22 million, which is significantly more than the previous record of slightly less than 2 million that took place in 1945. A blow from statistics can trigger a wave sales in the US stock market and cause serious damage to sterling. GBP / USD and S&P 500 dynamics:
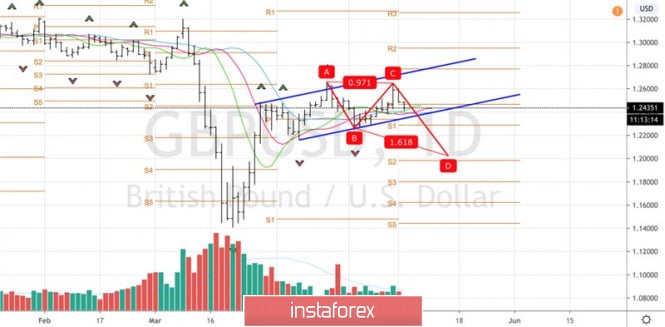
The increased attention to the pound during the first week of May was also caused by the presence of the Bank of England meeting in the economic calendar. In March, Andrew Bailey and his colleagues launched the British QE for £ 200 billion and have since bought up bonds for £ 70 billion. If you continue at the same pace, then by June the supply of resources will run out. BoE faces a dilemma of either being proactive by announcing the expansion of the program at the next meeting of the Monetary Policy Committee, or wait until the debt yields increase, and then put all their efforts into reducing it. If the choice falls on the first option, this will be an unpleasant surprise for the bulls of GBP / USD. I will not forget about the question hanging in the air on Brexit. Britain insists that the EU treats it as a sovereign state. It must exercise full control over coastal waters, like Norway, and cannot accept a number of European restrictions in the field of environmental and labor legislation, as well as state aid. A deadline of 8 months before a complete break creates additional pressure on the pound. In case of a successful support test at 1.235 and 1.229, traders will have a great opportunity to form shorts at GBP / USD. Technically, the quotes of the pair beyond the limits of the upward trading channel will increase the risks of implementing the AB = CD pattern with a target of 161.8%. GBP / USD daily chart:
|
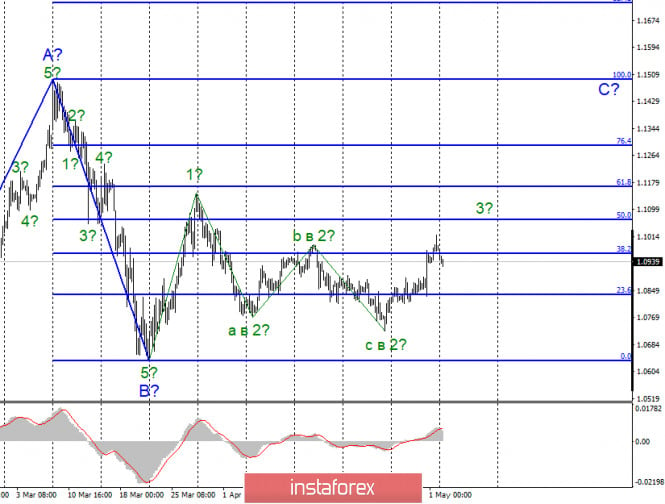
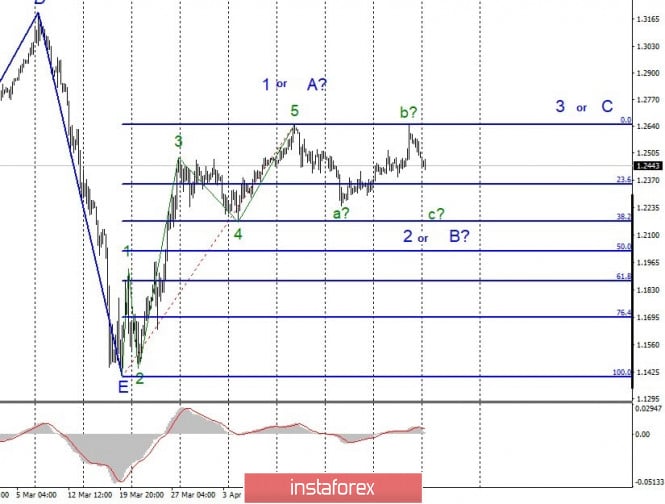
| Posted: 04 May 2020 04:00 AM PDT EUR / USD On May 1, the EUR/USD pair gained about 25 bps and thus continued to build the expected wave 3 in C. If this assumption is correct, then the increase in quotes will resume with the goals located above the 11 figure within the wave C. At the same time, the entire wave pattern may require additions and adjustments, since the situation in the world with coronavirus remains unstable and dangerous. Accordingly, the markets may again fall into a state of shock. Fundamental component: The news background for the EUR/USD pair on Friday was quite disappointing. There was only indexes of business activity in the US manufacturing sector, which are now clearly not too interested in the markets. But there is much more news, so to speak, of a general plan. For example, US leader Donald Trump continues to lead the investigation, which is designed to answer the question whether the leak of the coronavirus was not accidental. America suspects the Chinese authorities that if the leak was completely accidental, then Beijing purposefully hid the true information about the virus from the world, its degree of contagion, as well as the number of people who fell ill and died from it in China. It is incorrect information about this disease that has led to the fact that there are now more than one million cases of the disease in America. Thus, Washington wants to get evidence of China's guilt. This is necessary in order for the American President to remove responsibility for the consequences of the coronavirus in the United States, as well as to get a new trump card in negotiations with China. And it is not even so important in which negotiations. America is on the path of a long war with China, and we can not say that China in this history takes the place of the victim and the victimized. It's just that America's position is clear and obvious. Trump has stated it many times. China treats the US unfairly, so the trade balance needs to be equalized. On the contrary, China says much less, and in the case of the COVID-2019 pandemic, no one really knows whether Chinese scientists deliberately released the virus, purposefully withheld information from the entire world. Moreover, the number of diseases and deaths in China is still very difficult to judge. If there are so few of them, as official statistics say, then it is suspected that China really knew about the virus and its possible consequences from the very beginning, allowed it to leave the laboratory and hit certain areas, and then quickly "rolled" it using pre-prepared tools to prevent its spread throughout the country. If there are many more cases, then it turns out that China is really hiding and withheld important information for the whole world. General conclusions and recommendations: The euro/dollar pair is supposedly continuing to build the upward wave 3 in C. Thus, I now recommend continuing to buy the instrument with targets located near the levels of 1.1165 and 1.1295, which corresponds to 61.8% and 76.4% Fibonacci, but the new MACD signal is up. I recommend placing Stop Loss protective orders below the wave with a minimum of 2 and moving them up as the instrument rises. GBP / USD On May 1, the GBP/USD pair lost 100 basis points, and thus, presumably completed the construction of the expected wave b in 2 or B. If this is true, then this instrument has now moved to building a wave C in 2 or B with targets located around 22 figures. An unsuccessful attempt to break the maximum of wave 1 or A indicated that the markets were not ready for further purchases of the British pound. Meanwhile, an unsuccessful attempt to break through the 38.2% Fibonacci level will indicate the completion of the construction of the expected wave 2 or B. Fundamental component: The news background for the GBP / USD pair on May 1 was also weak. Business activity in the manufacturing sectors of the UK and the USA declined simultaneously and approximately the same value. Thus, economic reports did not particularly affect the supply and demand for the instrument. A meeting of the Bank of England is scheduled for this week, which could potentially give the markets a large amount of important information. General conclusions and recommendations: The pound/dollar pair supposedly completed the construction of the first wave of a new upward trend section. Thus, I now recommend selling the pound with targets located around 22 and 21 figures per building correction wave 2 or B. After the completion of this wave, I recommend buying this instrument with goals located above the 26th figure in the calculation of building a wave 3 or C. The material has been provided by InstaForex Company - www.instaforex.com |
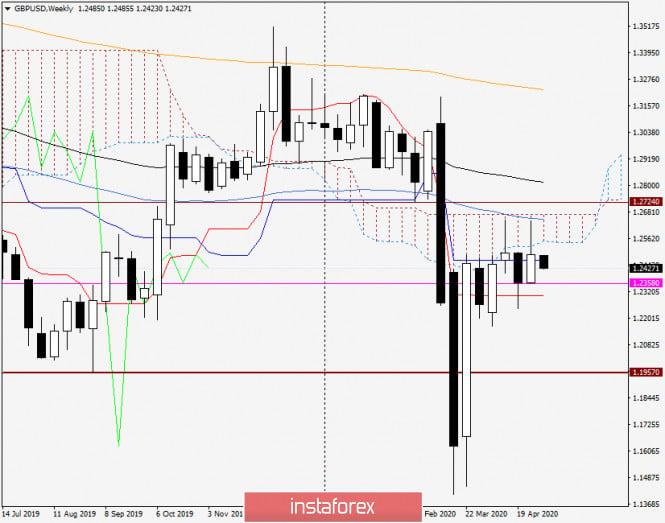
| Analysis and forecast for GBP/USD on May 4, 2020 Posted: 04 May 2020 03:54 AM PDT Dear traders, good day! Following the results of trading on April 27-May 1, the pound/dollar currency pair strengthened, ending the week at 1.2488. However, questions remain about the future price direction of this currency pair. First, the last weekly candle has a rather impressive upper shadow. Secondly, having shown the highs of the previous week's trading at 1.2641, the pair not only failed to stay close to the reached values but significantly rolled back, ending the trading under the most important psychological level of 1.2500. Weekly
Despite the fact that the last five-day trading ended above the Kijun line of the Ichimoku indicator, attempts to break through the 50 simple moving average and go up from the cloud were doomed to failure. From a technical point of view, this is the main uncertainty regarding the subsequent decline of the British currency. I believe that both scenarios should be considered in this situation. To confirm the seriousness of the players' intentions to increase, they need to raise the rate to the previous maximum values of 1.2641, breakthrough 50 MA, withdraw the price from the Ichimoku cloud and end the current week higher. I would like to note that this task is not at all easy, and to achieve it, a number of factors must coincide. Naturally, in favor of the British pound. On the other hand, the GBP/USD bears also need to make every effort to take control of the pair's trading. Downside players need not only to rewrite the previous lows at 1.2385 but also to close the week under the Tenkan line, which runs at 1.2305. In general, the bearish scenario will take on subsequent and quite real outlines, in the case of closing trades on May 4-8 under the important and significant level of 1.2300. Daily
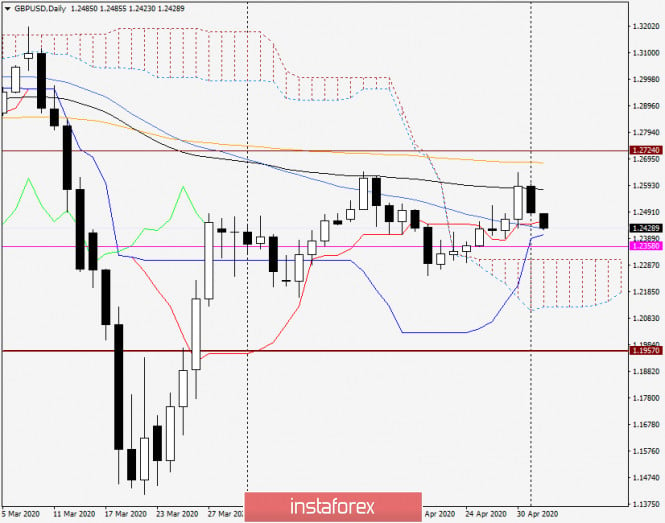
The true breakdown of the 89 exponential moving average never took place. After closing the candle for April 30 over this moving average, the next day the pair declined and ended the session at 89 EMA. At the moment of writing, the pound is trading with a slight decrease and pushes the Tenkan line from 50 MA. If we take into account that the Kijun passes at 1.2405, the current support zone can be designated as 1.2457-1.2405. Overcoming the strong mark of 1.2400, with fixing below, will open the way to the area of 1.2310-1.2300, where the upper border of the daily Ichimoku cloud passes. When considering the ascending scenario, buyers will again focus on the 89 exponential, which is located at 1.2577. But even after overcoming the 89 EMA, all the tasks of the bulls for the pair will not be considered solved. Above, in the area of 1.2641-1.2677, there are the maximum values of April 30 and 200 exponential moving average. I believe that only the breakdown of the level of 1.2641 and the overcoming of the 200 EMA will indicate the further ability of the pair to move in the north direction. Conclusion and trading recommendations for GBP/USD: Since the technical picture on the weekly and daily charts is far from unambiguous, we can assume both scenarios. The nearest purchases can be considered from the current support area of 1.2457-1.2405. An additional signal for such positioning will be bullish candle analysis models that will appear on the daily, 4-hour, and hourly charts. Purchases at lower and more favorable prices will be relevant after the pair falls to the area of 1.2310. However, even here it is better to see confirmation signals. Sales are better considered after the appearance of bearish candle patterns after rising to the price area of 1.2485-1.2525. Good luck! The material has been provided by InstaForex Company - www.instaforex.com |
| Instaforex Daily Analysis - 4th May 2020 Posted: 04 May 2020 03:05 AM PDT Today we take a look at GBPJPY and see how we are going to play the bounce! We use Fibonacci retracements, extensions, support/resistance, momentum and trend lines to identify trading opportunities in this exciting pair today! The material has been provided by InstaForex Company - www.instaforex.com |
| You are subscribed to email updates from Forex analysis review. To stop receiving these emails, you may unsubscribe now. | Email delivery powered by Google |
| Google, 1600 Amphitheatre Parkway, Mountain View, CA 94043, United States | |



No comments:
Post a Comment