Forex analysis review |
- American Nonfarm: disastrous numbers
- Comprehensive analysis of movement options for #USDX vs EUR/USD, GBP/USD, and USD/JPY (Daily) on May 11, 2020
- May 8, 2020 : GBP/USD Intraday technical analysis and trade recommendations.
- May 8, 2020 : EUR/USD Intraday technical analysis and trade recommendations.
- The euro is in no hurry to throw in the towel
- Analysis of EUR/USD and GBP/USD on May 8. Tension between China and the US has slightly calmed down; Markets awaits US statistics
- EUR/USD: Evening review on 05/08/2020. US unemployment rate surged to 14.7%
- GBP/USD: plan for the American session on May 8 (analysis of morning deals). The pound remains in the channel, and buyers
- EUR/USD: plan for the American session on May 8 (analysis of morning deals). Buyers of the euro have protected the level
- BTC analysis for 05.08.2020 - Decision pivot resistance at the $10.000 on the test. Watch carefully the price action around
- EUR/USD analysis for 05.06.2020 - Breakout of the downward channel and potential for further rise towards the 1.0900
- Technical analysis of EUR/USD for May 08, 2020
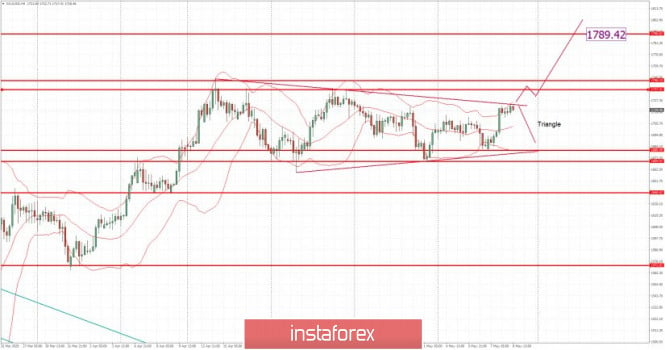
- Analysis for Gold 05.08.2020 - Gold is very close to the breakout fo the symmetrical tirangle. Watch for potential buying
- Trading plan for EUR/USD for May 08, 2020
- Instaforex Daily Analysis - 8th May 2020
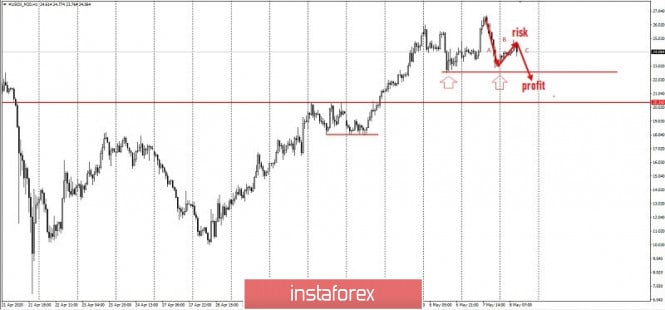
- Trading idea for WTI oil
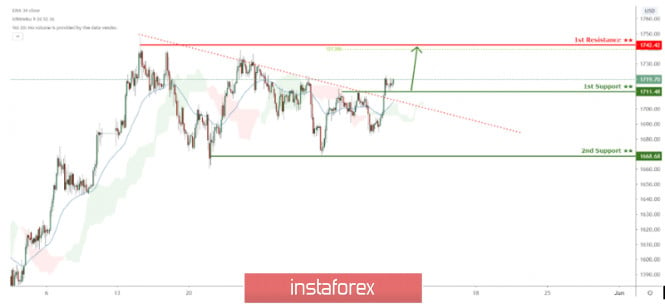
- XAUUSD pulling back to trendline , potential bounce!
- April NFP may be the worst in history, but not reason to sell USD
- Trading recommendations for EUR/USD pair on May 8
- Simplified wave analysis of GBP/USD, USD/JPY, and USD/CHF on May 8
- Technical analysis recommendations for EUR/USD and GBP/USD on May 8
- GBP/USD Reversal Still Possible!
- EUR/USD: Will the Nonfarm Employment Change report hit US dollar positions? US and China back to negotiating trade agreements
- USA, weak dollar and China
- Trading plan for EUR/USD on May 8, 2020. NonFarm Payrolls report at 13:30. Coronavirus updates
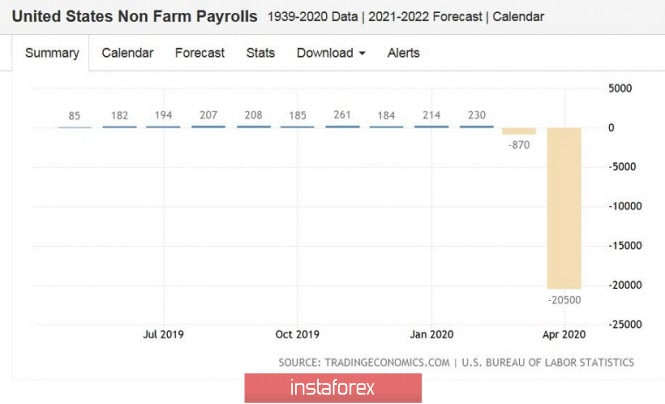
| American Nonfarm: disastrous numbers Posted: 08 May 2020 10:29 AM PDT Key data on the growth of the US labor market was expected to be not in favor of the dollar. And although many (almost all) components of April Nonfarms were in the "green zone", the market reacted to the release very clearly. The dollar index returned under the hundredth mark and headed for this week's lows, reflecting general pessimism about the greenback. In turn, buyers of the euro/dollar pair have a reason for a corrective recovery. The past week was not one of the best for the euro – the European Commission's report that was published yesterday put a lot of pressure on the single currency, which fell in price not only in the pair with the dollar but also throughout the market. It should be emphasized that the current growth of the pair is due only to the weakness of the dollar – the euro is still exhausted and can not start "its game." The extremely pessimistic forecast of the European Commission against the background of the resonant decision of the German constitutional court forces the euro to follow the dollar, so the dynamics of euro/dollar depends only on the "health" of the US currency. Today's events served as an additional confirmation of this fact.
Yesterday, the euro/dollar pair was trading at two-week lows, falling to the middle of the seventh figure. But the bears could not approach the support level of 1.0750, after which buyers intercepted the initiative for the pair. The data published today provided additional support to the bulls, although it came out in the "green zone", that is, better than expected. However, not everything is as clear as it seems at first glance. So, the unemployment rate in April rose to 14.7%, although experts expected it to be around 16 percent. But there is no reason to be optimistic. First, the fact that unemployment is rising to 14% is a kind of anti-record – the situation in the US labor market was worse only during the great depression when this figure increased to 25 percent. And if we talk exclusively about the employment indicator, it has fallen 10 times more than during the peak of the Great Depression (then there was a two-million minimum). Second, these 14 percent did not include the temporarily unemployed – if they were classified as expected (and according to the formula "working, but absent"), this figure would be at the level of 18-19%. A similar situation has developed with salaries. The growth rate of average hourly wage reached an extremely high level – on a monthly basis, at around 4.7% (although, as a rule, the indicator goes in the range of 0.1-0.4%), and in annual terms – at the level of 7.9% (with normal oscillations within 3-3.5%). But even in this case, there is no reason for optimism – these figures have increased due to the disproportionate loss of work by low-paid workers and their reduced wages, and not because of the general increase in wages (which would be very surprising in the current conditions). The number of people employed in April fell immediately by 20 million 500 thousand – thus, since the beginning of March, more than 33 million newly unemployed people have been registered in the United States. And here it should be noted that today's Non-Farm covers the situation in the labor market only until mid-April, so the current indicators do not reflect the true scale of the disaster in employment. Thus, today's release once again reminded market participants of the scale of the coronavirus crisis. The nonfarm structure suggests that the pandemic primarily hit the leisure and hospitality industries (more than 7 million employees lost their jobs), retail (more than 2 million layoffs), and manufacturing (1.3 million laid-off).
Against the background of such data, the euro/dollar bears were unable to continue their southern offensive. But this does not mean that the bulls will be able to reverse the situation on Non-Farm alone – the euro's own problems act as an anchor and if buyers can not impulsively enter the ninth figure (to be more precise, if they do not overcome the mark of 1.0880), then next week the dollar bulls can again show themselves. It is noteworthy that despite the correction growth, from the point of view of technology, the situation for the pair has not changed since yesterday. The pair is still located between the middle and lower lines of the Bollinger Bands indicator on the daily chart. In addition, the Ichimoku indicator shows a bearish signal "Parade of lines" – all lines of the indicator are above the price chart, thereby demonstrating pressure on the pair. To reverse the situation, the euro/dollar bulls need to overcome the mark of 1.0880 (the average line of the Bollinger Bands indicator, which coincides with the Tenkan-sen and Kijun-sen lines). Only when you pinned above this target, you can go into purchases (with the goal of 1.0975 - the upper line of the Bollinger Bands, which coincides with the lower border of the Kumo cloud on the same timeframe). If buyers do not overcome this level (which is most likely), the pair will again return to the base of the eighth figure with subsequent attempts to storm the seventh price level. The material has been provided by InstaForex Company - www.instaforex.com |
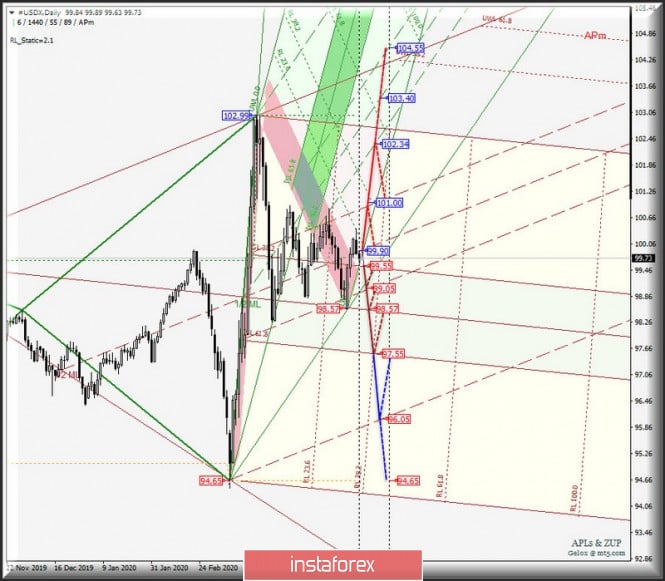
| Posted: 08 May 2020 09:59 AM PDT Minor operational scale (Daily) The second decade of May - options for the development of the movement of major currency instruments from May 11, 2020 #USDX vs EUR/USD, GBP/USD, and USD/JPY (Daily). ____________________ US dollar index From May 11, 2020, the movement of the dollar index #USDX will be determined by the development and direction of the breakdown of the range:
If the upper limit of ISL38.2 of the balance zone of the Minor operational scale fork is broken - the support level is 99.55 - the development of the #USDX movement will continue in the balance zone (99.55-98.57-97.55) of the Minor operational scale fork with the prospect of reaching the final Shiff Line Minor (96.05). In turn, the break of the 1/2 Median Line Minor - the resistance level of 99.90 - will determine the resumption of the upward movement of the dollar index to the upper border of the channel 1/2 Median Line (101.00) of the Minor operational scale fork prospect of the achievement of the channel borders 1/2 Median Line (102.34-103.40-104.55) of the Minuette operational scale fork. The layout of the #USDX movement options from May 11, 2020 is shown on the animated chart.
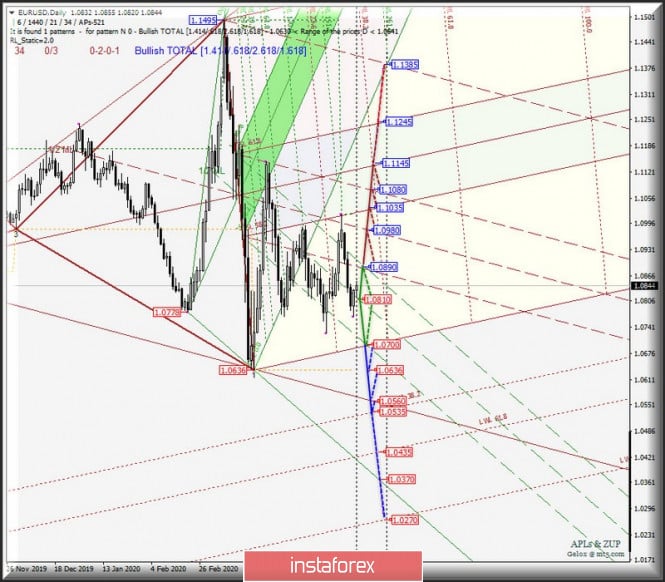
____________________ Euro vs US dollar The single European currency EUR/USD will continue to develop its movement within the borders of the 1/2 Median Line channel from May 11, 2020 (1.0890-1.0810-1.0700) of the Minuette operational scale fork - details are shown on the animated graph. The breakdown of the upper border of the channel 1/2 Median Line of the Minuette operational scale fork - resistance level of 1.0890 and further the development of the single European currency will flow in the channel borders 1/2 Median Line (1.0890-1.0980-1.1080) and equilibrium zone (1.1035-1.1145-1.1245) of the Minor operational scale fork. If the support level of 1.0700 breaks at the lower border of the channel 1/2 Median Line Minute, it will become relevant to update the local minimum of 1.0636 and the price of EUR/USD will reach the control-LTL (1.0560) and warning - LWL38.2 (1.0535) of the Minor operational scale fork. Options for EUR/USD movement from May 11, 2020, depending on the processing of the channel 1/2ML Minute are shown on the animated chart.
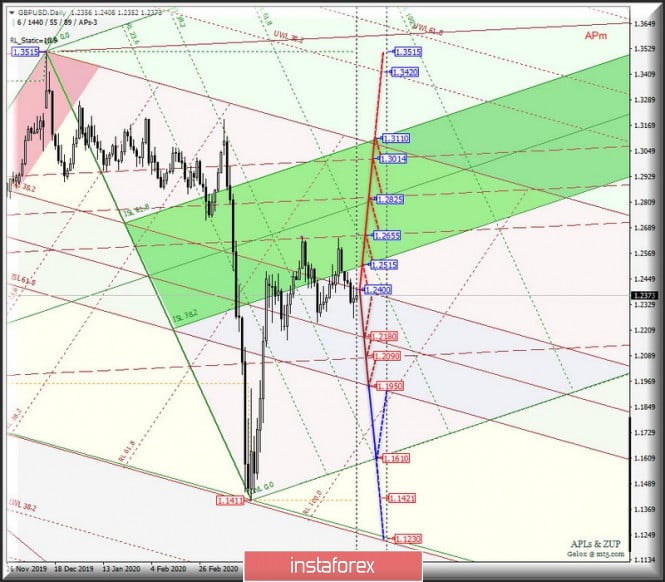
____________________ Great Britain pound vs US dollar The development of Her Majesty's currency movement GBP/USD from May 11, 2020 will be determined by the mining and direction of the breakdown of the boundaries of the equilibrium zone (1.2400-1.2180-1.1950) of the Minor operational scale - the markup of movement inside this equilibrium zone is presented on the animated graph. The breakdown of the top border ISL38.2 zone equilibrium of the Minor operational scale fork - the resistance level of 1.2400 - the movement of Her Majesty's currency will continue to the borders of the zone of equilibrium (1.2515-1.2825-1.3110) of the Minuette operational scale fork and channel 1/2 Median Line Minor (1.2655-1.2825-1.3014). If there is a breakdown of the lower border of ISL61.8 of the balance zone of the Minor operational scale forks - the support level of 1.1950 - then the downward movement of GBP/USD can be continued to the initial SSL line (1.1610) of the Minuette operational scale fork. Options for the movement of GBP/USD from May 11, 2020 are shown on the animated chart.
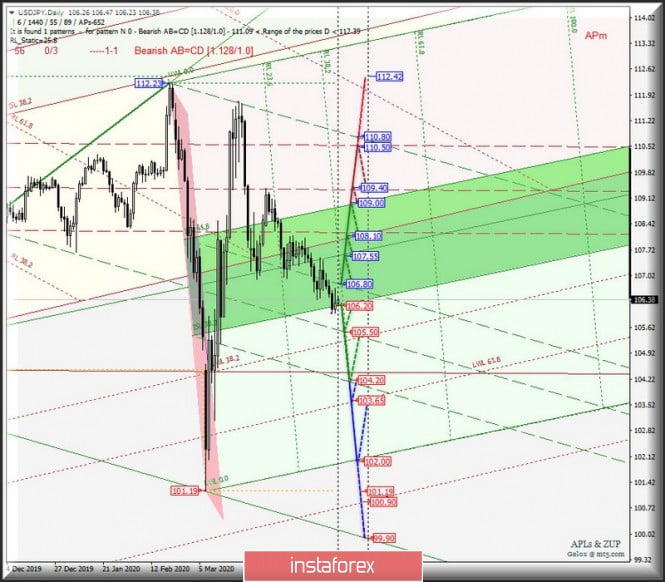
____________________ US dollar vs Japanese yen Range development and breakdown direction:
And will determine the development of the movement of the currency "Land of the Rising Sun" USD/JPY from May 11, 2020. A breakout of the lower border ISL38.2 zone equilibrium of the Minuette operational scale fork - the support level of 106.20 - will determine the further development of the movement of the currency "Land of the Rising Sun" in the channel 1/2 Median Line Minute (106.80-105.50-104.20) with the prospect of achieving the warning line LWL61.8 (103.65) of the Minor operational scale fork, and the initial line SSL Minute (102.00). If the upper border of the 1/2 medium Line channel is broken, the Minuette operational scale fork - the resistance level of 106.80 - will confirm that the USD/JPY movement will continue in the equilibrium zone (106.20 - 107.55 - 109.00) of the Minuette operational scale fork with the prospect of reaching 1/2 Median Line Minor (109.40) and the upper limit of the channel 1/2ML (110.50) of the Minor operational scale fork. The marking of USD/JPY movement options since May 11, 2020 is shown on the animated chart.
____________________ The review is compiled without taking into account the news background, the opening of trading sessions of the main financial centers, and is not a guide to action (placing "sell" or "buy" orders). Formula for calculating the dollar index: USDX = 50.14348112 * USDEUR0.576 * USDJPY0.136 * USDGBP0.119 * USDCAD0.091 * USDSEK0.042 * USDCHF0. 036. Where the power coefficients correspond to the weights of currencies in the basket: Euro - 57.6 %; Yen - 13.6 %; Pound - 11.9 %; Canadian dollar - 9.1 %; Swedish Krona - 4.2 %; Swiss franc - 3.6 %. The first coefficient in the formula brings the index value to 100 on the starting date - March 1973 when the main currencies began to be freely quoted relative to each other. The material has been provided by InstaForex Company - www.instaforex.com |
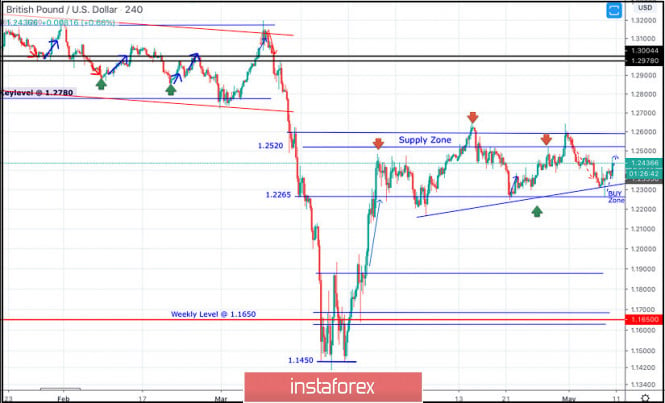
| May 8, 2020 : GBP/USD Intraday technical analysis and trade recommendations. Posted: 08 May 2020 08:42 AM PDT
Recently, the GBPUSD has reached new LOW price levels around 1.1450, slightly below the solid Previous Weekly Low (1.1650) achieved in September 2016. That's when the pair looked very OVERSOLD around the price levels of 1.1450 where a double-bottom reversal pattern was demonstrated. Bullish breakout above 1.1900 invalidated the bearish scenario temporarily & enabled a quick bullish movement to occur towards 1.2260. Technical outlook remains bullish as long as bullish persistence is maintained above 1.1890-1.1900 (Double-Bottom Neckline) on the H4 Charts. Bullish persistence above 1.2265 has enhanced another bullish movement up to the price levels of 1.2520-1.2590 where significant bearish rejection as well as a quick bearish decline were previously demonstrated (In the period between 14th - 21 April). Currently, A Bearish Double-Top reversal pattern may be in progress. The pair may be demonstrating the right TOP of the pattern. Hence, Bearish persistence below 1.2265 (Reversal Pattern Neckline) is needed to enhance another bearish movement towards 1.2100, 1.2000 then 1.1920. However, recent bullish price action brought the GBP/USD pair back towards 1.2600 where evident bearish rejection was manifested as we expected in previous articles. Yesterday, Intraday traders were advised to wait for bearish pullback towards the price levels of 1.2300-1.2280 where a low-risk short-term BUY trade could be taken. This suggested bullish trade is currently running in profits. Further bullish advancement is expected to pursue initially towards the price levels around 1.2520. On the other hand, any bearish breakdown below 1.2265 should be taken into consideration as it confirms the previously-mentioned double-top pattern. Hence, This would probably enable further bearish decline eventually towards 1.2020 as a projection target for the reversal pattern. Trade recommendations : Intraday traders were advised to wait for the previous bearish movement to pursue towards the price levels of 1.2300-1.2280 where a low-risk BUY trade can be offered. This bullish trade is currently running in profits. Next bullish targets are located around the price levels around 1.2520 and 1.2600 while S/L should be placed just below 1.2250. The material has been provided by InstaForex Company - www.instaforex.com |
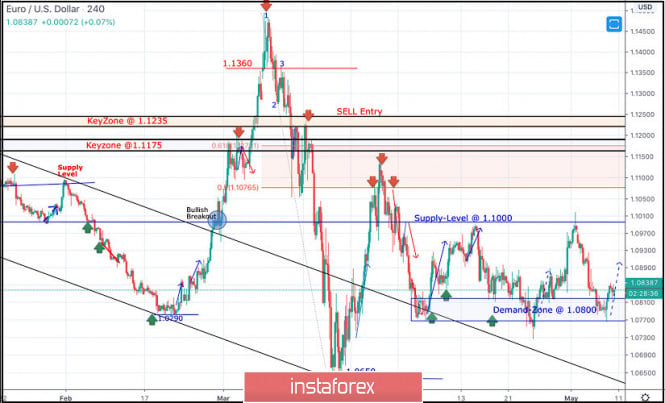
| May 8, 2020 : EUR/USD Intraday technical analysis and trade recommendations. Posted: 08 May 2020 07:38 AM PDT
Few weeks ago, the EURUSD pair has expressed significant bullish recovery around the newly-established bottom around 1.0650. Bullish engulfing H4 candlesticks as well as the recently-demonstrated ascending bottoms indicated a high probability bullish pullback at least towards 1.0980 and 1.1075 (Fibonacci Level 50%). Key Supply-Levels in confluence with significant Fibonacci levels are located around 1.1075 (50% Fibonacci) and 1.1175 (61.8% Fibonacci) where bearish rejection was highly-expected upon the previous bullish pullback that took place on March 27. Thus, a bearish Head & Shoulders pattern was demonstrated around the price levels of (1.1000 - 1.1150). Further bearish decline was demonstrated towards 1.0800 where the nearest demand level to be considered was located near the backside of the broken channel (1.0800-1.0750). Evident signs of Bullish rejection have been manifested around the price zone of (1.0800-1.0750) leading to the recent bullish spike up to 1.0990. The short-term technical bullish outlook remains valid as long as bullish persistence is maintained above the recently-established ascending Bottom around 1.0770. Further bullish advancement was expected to pursue beyond 1.1000 towards 1.1175 where 61.8% Fibonacci Level is located. Bullish breakout above 1.1000 was needed to enhance further bullish movement towards 1.1075 and probably 1.1150. However, lack of bullish momentum brought another recent bearish decline towards the depicted price zone around 1.0800. On the other hand, the price zone of (1.0815 - 1.0775) has been standing as a prominent Demand Zone which can provide quite good bullish support for the pair. Any bearish breakdown below 1.0770 should be marked as an Exit signal for all short-term BUY trades. Trade recommendations : Intraday traders are advised to consider the current bearish pullback towards the price zone of 1.0815 - 1.0775 as another valid short-term BUY trade. S/L should be placed at 1.0750 while T/P levels to be located around 1.0930, 1.1000 then 1.1075 if sufficient bullish momentum is maintained. The material has been provided by InstaForex Company - www.instaforex.com |
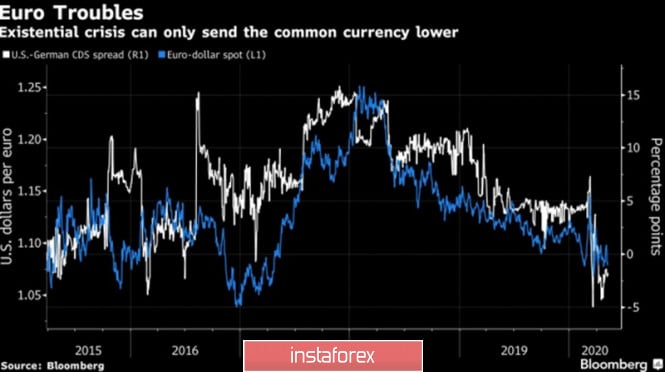
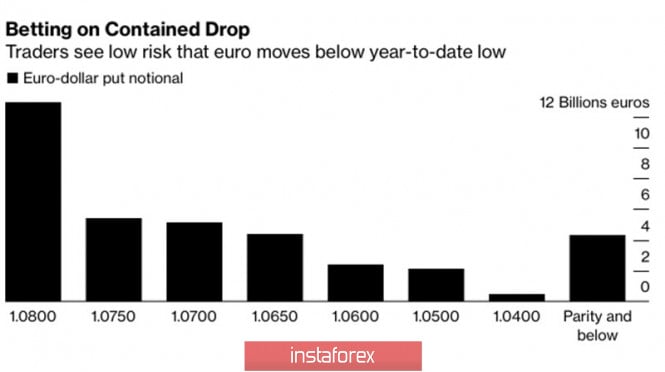
| The euro is in no hurry to throw in the towel Posted: 08 May 2020 06:54 AM PDT The single European currency received two painful blows, however, as soon as there was a gap in the clouds, it managed to return above $1.08. The verdict of the German Constitutional Court on the legality of QE and rumors about the resuscitation of the US-China trade war turned the "bulls" on EUR/USD to flight. The split of the Eurozone, the restriction of the ECB's monetary expansion potential, and the deterioration of international trade are not empty words for the currency bloc, which is groaning under the burden of a pandemic. Therefore, the weakness of the euro seems logical. The German Constitutional Court surprised by its decisions. They admitted that buying bonds under QE is not financing the government, but recognized the verdict of the European Court of Justice as illegal and demanded that the ECB explain why the benefits of the quantitative easing program outweigh its side effects. This topic came up quite often at meetings of the Governing Council in 2018-2019, but the pandemic has rallied bankers, and even the "hawks" do not object to the expansion of the stimulus package. According to Christine Lagarde, the ECB is independent and accountable to the European Parliament, and it will continue to do everything possible to save the Eurozone economy. This response to the judges convinced investors that they could not force the regulator to limit QE, which calmed the financial markets of the Old World and the "bulls" for EUR/USD. Dynamics of EUR/USD and spreads on credit default swaps of the USA and Germany
Pressure on the euro was created by rumors about new duties on Chinese imports. Donald Trump first accused China of the alleged laboratory origin of the coronavirus, and then of failure to fulfill obligations to increase purchases of American products by $77 billion in 2020. Nevertheless, the chief negotiators, represented by Vice Premier Liu He, trade representative Robert Lighthizer and Finance Minister Steven Mnuchin, expressed confidence that by the end of the year, exports will grow by the necessary amount, which cooled the ardor of sellers of EUR/USD. Support for the single European currency was provided by US stock indices, which positively received the news that the escalation of the trade conflict between Washington and Beijing is being postponed, as well as rumors about the readiness of Democrats in the House of Representatives to expand the stimulus package by $750 billion. In addition, the statistics on the American labor market were not as terrible as Bloomberg experts expected. Unemployment fell short of 16%, limited to 14.7%, and employment outside the agricultural sector fell by 20.5 million instead of 22 million. The options market signals that investors are under no illusions about the emergence of a stable trend in the EUR/USD pair since both the euro and the US dollar have their own vulnerabilities. The volume of options trading on the EUR/USD with a defined strike prices
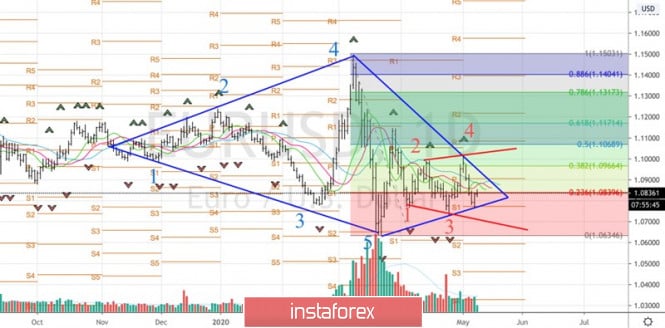
In my opinion, even the exit of the pair's quotes beyond the lower border of the "Rhombus" pattern, which implies a break in support at 1.077-1.0775, will not allow us to speak with confidence about the continuation of the peak of EUR/USD. Only the formation of a subsidiary model of the "Expanding Wedge", which requires updating the April minimum at 1.073, will clarify the situation and allow you to think about shorts. EUR/USD, the daily chart
|
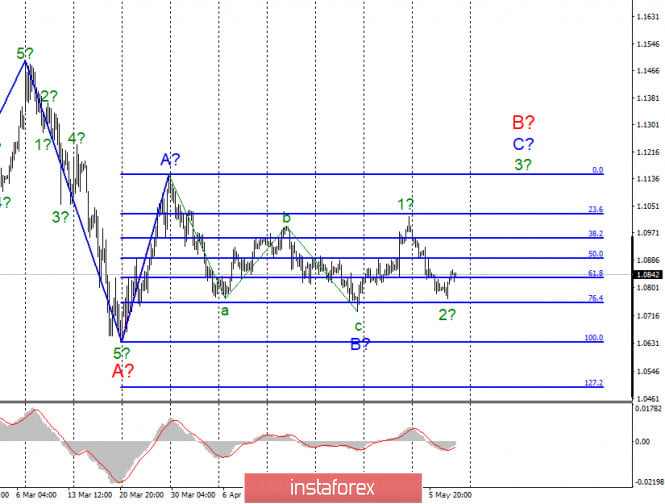
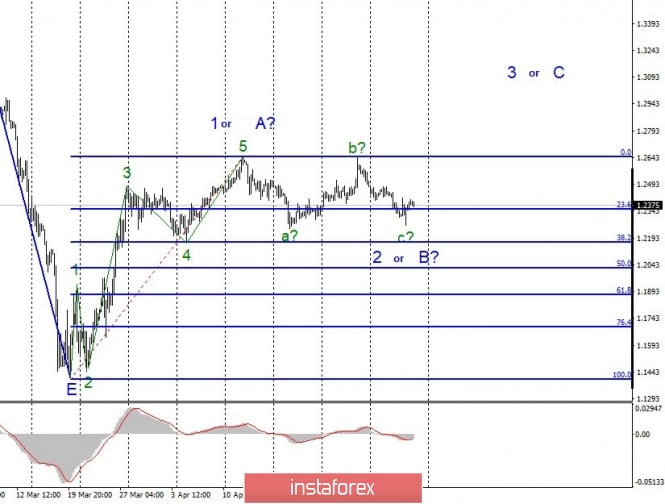
| Posted: 08 May 2020 06:00 AM PDT EUR / USD On May 7, the EUR/USD pair gained about 40 basis points and presumably completed the construction of the expected wave 2 in C in B. If this assumption is correct, then the increase in prices will continue with the targets located about 11th figures and higher within the framework of the construction of the wave 3 in C in B. The entire wave C can be very long and complex in its internal structure. A successful attempt to break through the minimum of wave B will indicate that the markets are not ready for further purchases of the Euro currency. Fundamental component: The news background for the EUR/USD pair on Thursday was reduced to just a report on applications for unemployment benefits in the US. It turned out that in the reporting week, the total number of primary applications increased by another 3.2 million, and the total number of secondary applications – was 22.7 million, which was much higher than market expectations. Thus, statistics from America was extremely weak once again, so it is not surprising that demand for the US dollar fell in the afternoon. Another question is that in Europe the statistics remain just as sad. There were simply no important reports yesterday. For today, there are also no important reports planned in the European Union. Thus, markets will focus solely on US reports on Nonfarm Payrolls and unemployment. No surprises are expected here, and even more pleasant surprises. The unemployment rate in April may rise to 14%, and the number of jobs outside agriculture will be reduced by 22 million. Real numbers may be even worse, but even these should be enough for US currency to continue to decline. Another salary report for April will be released, which may brighten up the negative from the first two. However, it is unlikely that he will be able to block unemployment data. In addition, it is reported that China and the United States agreed yesterday to work to create favorable conditions for the implementation of the first phase of the trade transaction, which was signed in January. Chinese Deputy Prime Minister Liu He and US Trade Representative Robert Lighthizer also agreed to develop cooperation in macroeconomics and health. However, the opinion of Donald Trump, who is the main critic of China and even intends to introduce new trade duties, remains unclear if China is proved guilty of deliberate misinformation regarding the coronavirus. General conclusions and recommendations: The euro/dollar pair presumably continues to build the rising wave C to B. Thus, I recommend buying the instrument with targets located, as before, around 1.1148, which is equal to 0.0% for Fibonacci, or the peak of wave A. Now, a successful attempt to break the minimum of wave B will require making adjustments and additions to the current wave markup. GBP / USD On May 7, the GBP/USD pair added only 15 basis points and presumably completed the construction of the expected wave C in 2 or B. If this is true, then the current positions will resume increasing quotes with goals located above the peak of wave 1 or A. At the same time, wave 2 or b can take on a more complex and extended form. Thus, only after a successful attempt to break through the peak of wave 1 or A, it will be possible to conclude that the markets are ready for new purchases of the British currency. Fundamental component: The news background for the GBP/USD pair on May 7 was quite strong. Almost all the news and messages are concerning the Bank of England, which left the key rate unchanged. The volume of asset repurchases from the open market, but at the same time declared a strong "economic shock" for the British economy, which will shrink by the end of 2020 by at least 14%. However, this information did not impress the markets too much, as demand for the British pound was quite high yesterday. Today, it can continue to remain so, as the American statistics do not bode well. General conclusions and recommendations: The pound/dollar instrument supposedly completed the construction of the second wave of a new upward trend section. Thus, I now recommend buying the pound with goals located around the 26th figure, calculated on the construction of wave 3 or C or d in 2 or B. Now, a successful attempt to break through the level of 1.2645 will allow you to buy the pound more confidently. The material has been provided by InstaForex Company - www.instaforex.com |
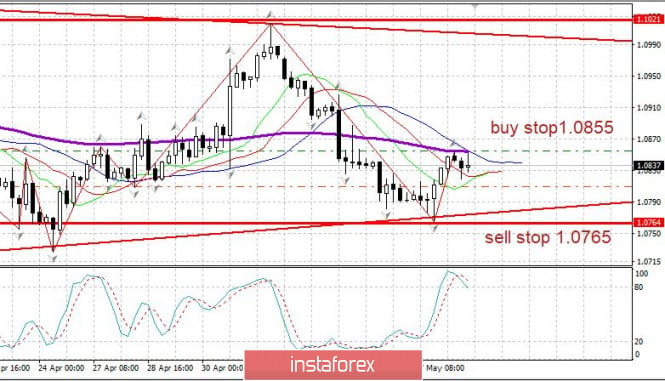
| EUR/USD: Evening review on 05/08/2020. US unemployment rate surged to 14.7% Posted: 08 May 2020 05:57 AM PDT The US unemployment rate report for the month of April was released which are as follows: - There are 20.5 million new unemployed; - Unemployment rate surges to 14.7%. As shown on the chart above, there can be no correct growth of the US market with such a trend. Thus, the US market can be sold. You must understand that the trend is likely to remain negative in May. EUR/USD: The euro is determined. We consider buying from the level of 1.0855. The material has been provided by InstaForex Company - www.instaforex.com |
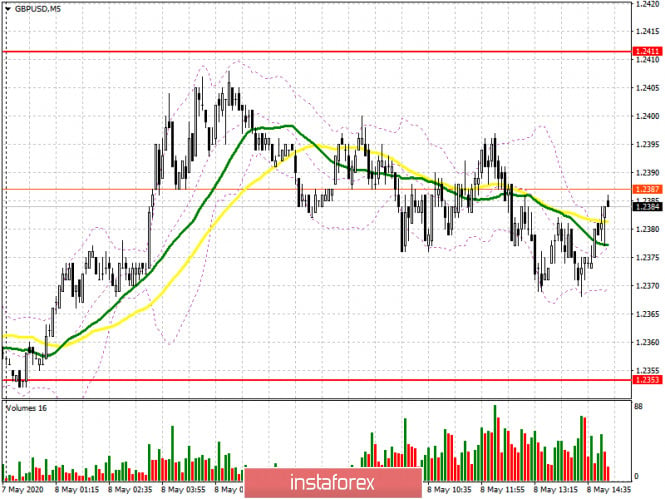
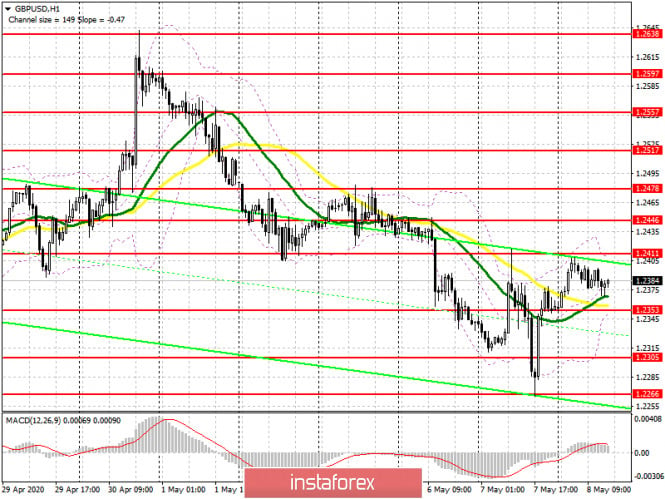
| Posted: 08 May 2020 05:39 AM PDT To open long positions on GBPUSD, you need: From a technical point of view, nothing has changed for traders. The pair never managed to update any of the levels that I indicated in my morning forecast, which is clearly visible on the 5-minute chart. At the moment, buyers of the pound are focused on the resistance of 1.2411, which determines the further growth of the pair. Fixing on this range in the second half of the day will be a signal to open new long positions in the expectation of continuing the correction of GBP/USD already in the area of highs 1.2446 and 1.2478, where I recommend fixing the profits. In the scenario of a pound decline after the release of the report on the American labor market, it is best to return to long positions only after the formation of a false breakdown in the support area of 1.2353, where the moving averages also go, but I recommend buying a pair immediately for a rebound only from a minimum of 1.2305, based on correction of 30-35 points within a day.
To open short positions on GBPUSD, you need: Today, important fundamental statistics on the US labor market are published, but its impact on the pair will not be significant since the current reduction in the number of employed in the US by more than 20 million has already been taken into account in the quotes. Sellers of the pound need to protect the resistance of 1.2411, where the formation of a false breakout will be a direct signal to open short positions in the expectation of a decline in GBP/USD to the low of 1.2353. Fixing below this level will definitely lead to the demolition of a number of buyers' stop orders and collapse the pound to the areas of 1.2305 and 1.2266, where I recommend fixing the profits. If there is no activity of sellers in the resistance area of 1.2411, it is best to postpone short positions until the update of larger highs in the area of 1.2446 and 1.2478, from where you can sell immediately for a rebound in the hope of reducing the pair by 20-30 points by the end of the day.
Signals of indicators: Moving averages Trading is conducted above the 30 and 50 daily averages, which indicates a further probability of an upward correction of the pound. Note: The period and prices of moving averages are considered by the author on the hourly chart H1 and differ from the general definition of the classic daily moving averages on the daily chart D1. Bollinger Bands A break in the upper limit of the indicator at 1.2411 will lead to a sharp increase in the pound. A break in the lower border of the indicator around 1.2350 will increase the pressure on the pair. Description of indicators
|
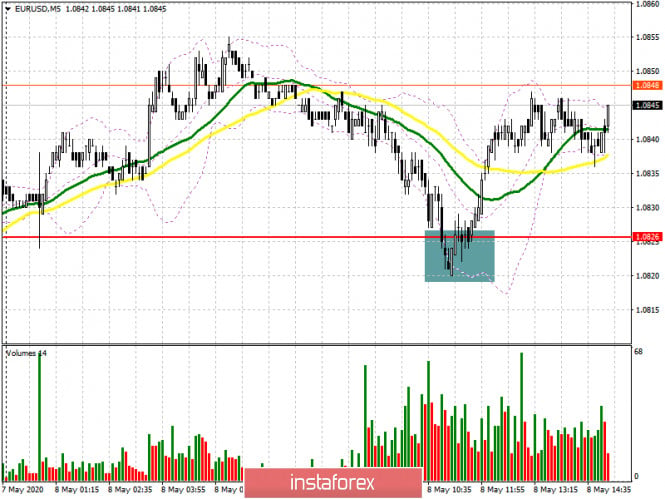
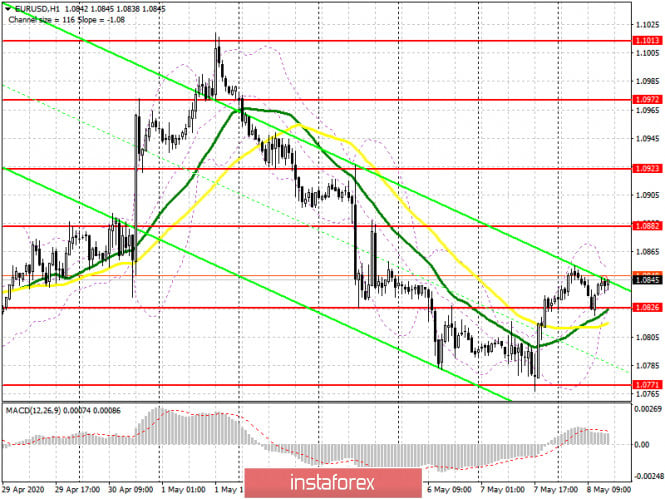
| Posted: 08 May 2020 05:39 AM PDT To open long positions on EURUSD, you need: In the morning forecast, I paid attention to the probability of forming a false breakout in the support area of 1.0826 and recommended opening long positions from it in the continuation of the upward correction. If we look at the 5-minute chart, we can see how the bears tried to break below 1.0826 but failed to do so, which quickly brought the pair back to this level, allowing the formation of another wave of purchases before the release of an important report on the US. At the moment, all attention will be focused on the Non-Farm Employment Change report. While trading will be conducted above 1.0826, we can expect the euro to continue growing to the maximum area of 1.0882, fixing above which will lead to larger growth in the area of 1.0923, where I recommend fixing the profits. If the EUR/USD returns to the level of 1.0826 after the report is released, it is best to postpone purchases until the test of a larger minimum of 1.0771, counting on correction of 30-35 points within the day.
To open short positions on EURUSD, you need: For sellers, nothing has changed. The data that is expected today on the US labor market is unlikely to lead to serious changes in the market since traders have ignored recently similar statistics. If the report does not go beyond the forecasts of economists, trade may remain in the side channel. In the first half of the day, the bears failed to break through to the level of 1.0826, which we see on the hourly chart, but it is possible that a repeat test of this range in the North American session will still lead to a larger sale of EUR/USD with an exit to the minimum of 1.0771, where I recommend fixing the profits. If the bulls continue to push the market up, it is best to return to short positions only on the rebound from the resistance of 1.0882 or sell EUR/USD from a larger maximum of 1.0923 in the expectation of a decrease of 30-35 points within the day.
Signals of indicators: Moving averages Trading is conducted above the 30 and 50 daily moving averages, which indicates the probability of continuing the upward correction of the pair. Note: The period and prices of moving averages are considered by the author on the hourly chart H1 and differ from the general definition of the classic daily moving averages on the daily chart D1. Bollinger Bands A break in the lower border of the indicator around 1.0826 will lead to a new wave of falling euros. Breaking the upper border around 1.0850 will lead to a larger increase in the euro. Description of indicators
|
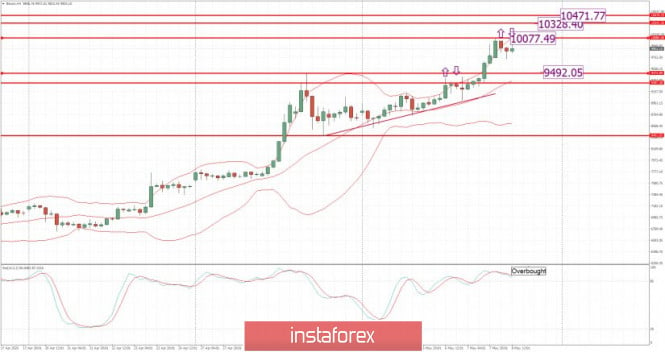
| Posted: 08 May 2020 05:02 AM PDT Open interest (OI) in bitcoin (BTC) options surpassed USD 1 billion ahead of the halving, with an exponential increase seen across all major marketplaces over the past week. Meanwhile, the bitcoin put-to-call ratio is also on the move, revealing some bearishness in the market. Although not unusual during bull runs in the spot market, the rising interest in bitcoin options may suggest that some large holders are seeking to protect themselves against an uncertain outcome of the halving, which is now just days away. Technical analysis: BTC has been trading upwards. As we expected yesterday, the price tested the next resistance at the price of $10,000. This is decsiion level for the BTC and you should watch carefully the price action around it. Trading recommendation: The material has been provided by InstaForex Company - www.instaforex.com |
| Posted: 08 May 2020 04:56 AM PDT News:
German exports see worst month-on-month decline since 1990 reunificationMoving away from that very sad news now to Germany, where exports plunged by 11.8% in March, their worst month-on-month fall since the country's 1990 reunification, statistics authority Destatis said Friday. The data illustrated the first monthly impact of the coronavirus epidemic on Europe's biggest economy. The drop was far steeper than a five percent forecast from analysts surveyed by Bloomberg. Technical analysis: EUR/USD has been trading upwards. As we expected yesterday, the price tested the level of 1,0860 . I still expect further upside movement towards the levels at 1,0900 and 1,0925. Trading recommendation: Watch for buying opportunities on the dips using the intraday frames due to the breakout of the downward channel in the background and shake-out in the background. Upward targets are set at the price of 1,0900 and 1,0925. Support levels are set at the price of $1,712 and $1,680. The material has been provided by InstaForex Company - www.instaforex.com |
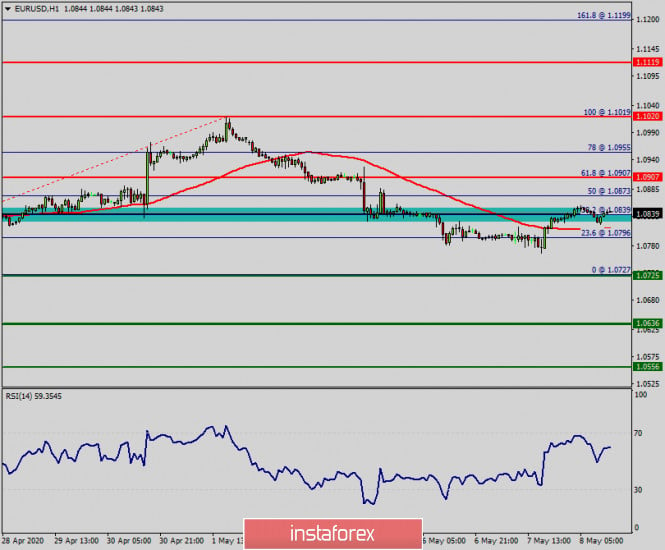
| Technical analysis of EUR/USD for May 08, 2020 Posted: 08 May 2020 04:55 AM PDT Overview: The trend of EUR/USD pair movement was controversial as it took place in a narrow sideways channel, the market showed signs of instability. Amid the previous events, the price is still moving between the levels of 1.0796 and 1.0907. Also, the daily resistance and support are seen at the levels of 1.0725 and 1.0636 respectively. Therefore, it is recommended to be cautious while placing orders in this area. So, we need to wait until the sideways channel has completed. Yesterday, the market moved from its bottom at 1.0780 and continued to rise towards the top of 1.0839. Today, in the one-hour chart, the current rise will remain within a framework of correction. However, if the pair fails to pass through the level of 1.0907, the market will indicate a bearish opportunity below the strong resistance level of 1.0907 (the level of 1.0907 coincides with the double top too). Since there is nothing new in this market, it is not bullish yet. Sell deals are recommended below the level of 1.0907 with the first target at 1.0725. If the trend breaks the support level of 1.0725, the pair is likely to move downwards continuing the development of a bearish trend to the level 1.0636 in order to test the daily support 2 (horizontal green line). The material has been provided by InstaForex Company - www.instaforex.com |
| Posted: 08 May 2020 04:49 AM PDT Corona virus summary:
UK will take "tentative steps" out of lockdown, says government ministerMuch of the Uk is on tenterhooks, waiting to see what lockdown measures - if any - will be relaxed on Sunday, when the prime minister Boris Johnson will make an announcement. While the UK government has talked down the extent of any impending changes, this morning the country's culture secretary, Oliver Dowden, said the prime minister would set out"tentative" steps leading out of the lockdown. Speaking to BBC Breakfast, he said: We can start to look to the future but we'll have to do so in a very tentative and cautious way, so people should not expect big changes. If there is any indication that things are starting to get out of control, we won't hesitate to step back. But people should be able to look forward to the weeks and months ahead to know where we are going and the order in which we are doing it. Technical analysis: Gold has been trading upwards towards the level of $1,720. The Gold is at the very important reistance (supply trendline of the symmetrical triangle) and my advice is to watch for the eventual breakout to the upside to confirm further rise on the Gold. Trading recommendation: Watch for potential breakout of the resistance at $1,725 to confirm further upside movement. In case of the upside breakout, the target will be set at $1,790. Resistance levels are set at the price of $1,737, $1,746 and $1,790. Support levels are set at the price of $1,712 and $1,680. The material has been provided by InstaForex Company - www.instaforex.com |
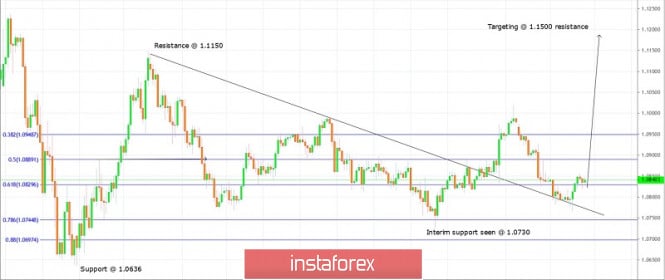
| Trading plan for EUR/USD for May 08, 2020 Posted: 08 May 2020 03:47 AM PDT
Technical outlook: EUR/USD tested the backside of broken resistance trend line at 1.0766 before reversing higher yesterday. The single currency pair is seen to be trading around 1.0840 levels at this point in writing and it is expected to hold above 1.0766 from here. It seems that the consolidation going on since several trading sessions is now complete and EUR/USD might be ready to rally towards 1.1500 levels in the next few weeks. Immediate price resistance is seen towards 1.1020, while support is at 1.0730, followed by 1.0636 respectively. The overall structure is looking constructive for bulls as 1.0636 remains intact. Only a break below 1.0636 will delay matters further for a EUR/USD rally which could last for several months. Trading plan: Remain long with stop at 1.0636, target is 1.1500 Good luck! The material has been provided by InstaForex Company - www.instaforex.com |
| Instaforex Daily Analysis - 8th May 2020 Posted: 08 May 2020 03:35 AM PDT Today we take a look at GBPCAD and see how we are going to play the bounce! We use Fibonacci retracements, extensions, support/resistance, momentum and trend lines to identify trading opportunities in this exciting pair today! The material has been provided by InstaForex Company - www.instaforex.com |
| Posted: 08 May 2020 03:14 AM PDT The tensions created by the US-China trade war lost US oil about $ 4 yesterday. In addition, the quote did not manage to break through yesterday's low, but stopped in its vicinity, thereby forming a "double bottom" in the D1 chart. I suggest that we consider the classic three wave with profit taking at the level of 22.5 in the June futures: Today, traders will continue winning back yesterday's loss at the European and American sessions, and fix long positions, so as not to transfer them to the weekend. If the breakout of the double bottom platform is volatile, we recommend closing short positions at the close of the hourly candle below 22.5. The risk / profit ratio is 1/2. Good luck in trading, control risks and have a good weekend! The material has been provided by InstaForex Company - www.instaforex.com |
| XAUUSD pulling back to trendline , potential bounce! Posted: 08 May 2020 03:00 AM PDT
Trading Recommendation Entry: 1711.48 Reason for Entry: Horizontal overlap support , trendline pullback Take Profit :11742.42 Reason for Take Profit: 127% fibonacci extension Stop Loss: 1668.68 Reason for Stop loss: Horizontal swing low The material has been provided by InstaForex Company - www.instaforex.com |
| April NFP may be the worst in history, but not reason to sell USD Posted: 08 May 2020 02:31 AM PDT
The growth of the S&P 500, encouraged by good news, prevented the EUR / USD bears from storming support at 1.0770 and continuing their march downward. Statements by Fed officials that America will be able to avoid depression, as well as rumors about the expansion of fiscal stimulus in the United States and optimistic rhetoric from trade representatives in Washington and Beijing, have returned investor interest in buying shares. However, the April release on the American labor market could ruin their mood. One of the drivers for greenback strengthening in early May was concerns about the escalation of the US-China trade conflict, spurring demand for safe haven assets. First, the head of the White House, Donald Trump, threatened China with the introduction of new tariffs in response to the alleged artificial origin of COVID-19, and then in connection with the Chinese side's failure to fulfill the terms of the January agreement to increase purchases of American products by $ 200 billion. Since the beginning of the year, exports from the United States to China have fallen by 5.9%. This raises doubts about the fulfillment by the parties of their obligations. However, Liu He, Robert Lighthizer, and Steven Mnuchin are optimistic and confident that everything will be fine. The positive attitude of the main negotiators extended a helping hand to the EUR/USD bulls. Meanwhile, support for the US stock indices was provided by news about the preparation by the Democrats in the House of Representatives of the Congress of the project on additional fiscal stimulation of $ 750 billion, as well as statements by the Fed that America will be able to avoid a recurrence of the Great Depression. According to Neel Kashkari, head of the Federal Reserve Bank of Minneapolis, the Federal Reserve will make every effort to avoid a pessimistic scenario. President of the Atlanta Federal Reserve Bank Raphael Bostic, in turn, believes that the regulator is better off the bat than doing too little to get the US economy out of recession. The optimism of Fed officials is understandable, but the April release on the US labor market may be the worst in history. According to forecasts, last month employment decreased by 22 million, which pushed unemployment to a record high of 16%. Will the US stock market withstand a similar blow? If so, then the EUR / USD bulls will have a chance to push quotes above 1.09. If not, then the bears will be preparing for the next breakthrough on support at 1.0770. In this case, the greenback can not only resist, but also strengthen later on especially if the April report on the American labor market will cause a massive sale of risky assets, and capital will flow into liquid and more reliable US treasury bonds. Concern over weak statistics from the Eurozone and its integrity will also stimulate interest in the dollar. The material has been provided by InstaForex Company - www.instaforex.com |
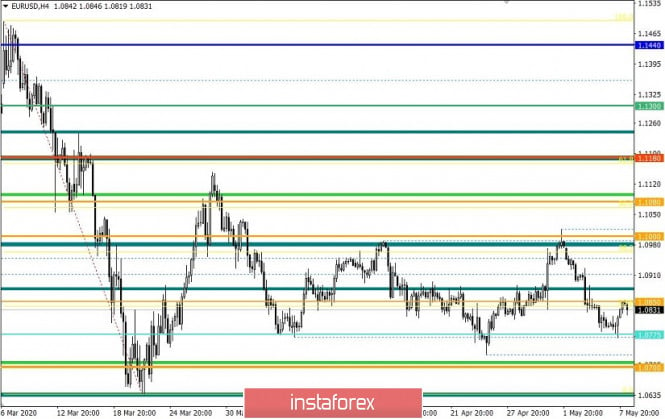
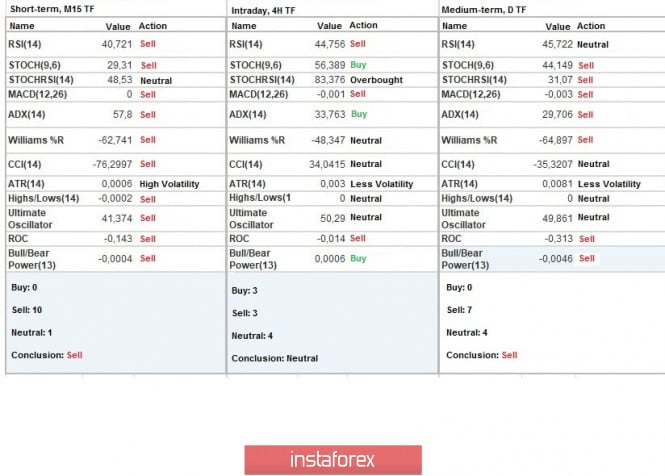
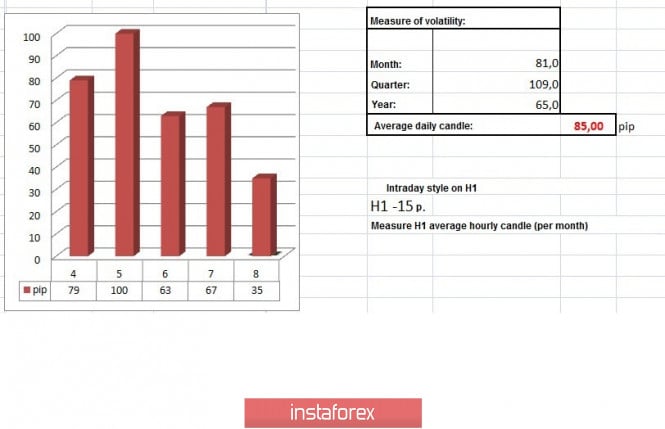
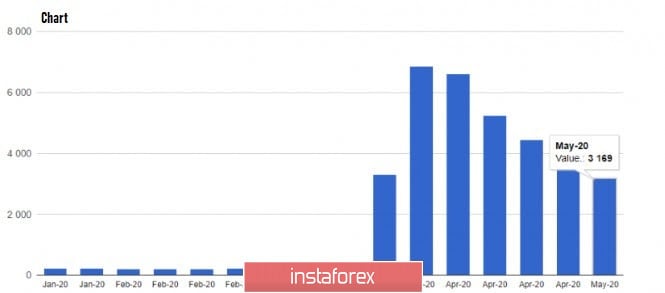
| Trading recommendations for EUR/USD pair on May 8 Posted: 08 May 2020 02:22 AM PDT From the point of view of complex analysis, we see a rebound in prices from the range level, and now let's talk about the details. Most of the trading week passed in a downward direction and during which, the quote managed to decline to the level of 1.0775, and there was a slowdown on the basis of regularity and, as a fact, a corrective move towards the previously passed level of 1.0850. In fact, the level of 1.0775 still plays an integral role of the interaction of trading forces in the market, but at the same time, do not forget about the consistent measures that have a downward mood. Based on this logic, we can say that the level of 1.0775 serves as a temporary platform on which market participants concentrate, but this same platform can play the role of acceleration in the subsequent movement. If we have a series of descending cycles, then the sellers' ownership in this structure is undeniable, which means that the level of 1.0775 can play in favor of acceleration, and its breakdown is just a moment of time that can occur at any moment. It turns out that we are still inclined to the downward development and in this regard we are considering possible theories. Looking at the past day by the minute, you can see that the quote was mostly concentrated near the 1.0750 level, but there was an acceleration during the time period of 15:00-17:00 UTC+00, in which long positions prevailed. In terms of volatility, there is similar activity for the second day in a row, which is systematically lower than the daily average. Most likely, this is the signal of a kind of accumulation, which will later result in acceleration. Regarding the monitoring of volatility, we see a gradual normalization of the emotional mood of market participants, where, for example, the average dynamics of the daily candle in March was 172 points, and already 90 points in April. Let me remind you that before the surge in panic, the average dynamics for the euro/dollar pair was 60 - 80 points. Volatility detail MARCH : Monday [March 9] - 155 points; Tuesday - 183 points; Wednesday - 115 points; Thursday - 278 points; Friday - 166 points; Monday - 151 points; Tuesday - 234 points; Wednesday - 243 points; Thursday - 326 points; Friday - 194 points; Monday - 191 points; Tuesday - 160 points; Wednesday - 133 points; Thursday - 188 points; Friday - 194 points; Monday - 134 points; Tuesday - 127 points. APRIL : Wednesday - 136 points; Thursday - 147 points; Friday - 91 points; Monday - 67 points; Tuesday - 142 points; Wednesday - 72 points; Thursday - 110 points; Friday - 33 points; Monday - 74 points; Tuesday - 84 points; Wednesday - 134 points; Thursday - 95 points; Friday - 80 points; Monday - 55 points; Tuesday - 64 points; Wednesday - 82 points; Thursday - 90 points; Friday - 101 points; Monday - 49 points; Tuesday - 79 points; Wednesday - 68 points; Thursday - 139 points. MAY : Friday - 83 points; Monday - 79 points; Tuesday - 100 points; Wednesday - 63 points; Thursday - 67. The average daily indicator relative to the dynamics of volatility is 85 points [see table of volatility at the end of the article]. As discussed in the previous review, traders in terms of main deals considered a downward development, but only after the price consolidated below 1.0775, which did not happen. Thursday's recommendations coincided by 200%, more specifically, profits were collected both from positions for sale and from positions for purchase. [We consider selling positions lower than 1.0790, down to 1.0775. Further progress is made after fixing the price lower than 1.0770, with a prospect of 1.0730–1.0700. We consider purchase positions in terms of local operations higher than 1.0826, with a movement towards 1.0850.] Considering the trading chart in general terms, the daily period, you can notice just those very consistent downward bars, as mentioned above. However, do not forget about the global trend that remains on the market. The news background of the past day contained data on applications for unemployment benefits in the United States, where the next historical records were waiting for us. So, the initial applications amounted to 3 169 000, which is better than forecasts in some sense, but it is extremely difficult to be aware of such enormous values. In turn, repeated applications totaled 22,647,000, which is higher than the forecast. The market's reaction to such significant indicators was literally absent, and this is understandable. The market, represented by investors, was ready for them, and the head of the Federal Reserve Bank of St. Louis James Bullard said the other day that the ADP report is not surprising. In terms of the general informational background, we see the forgotten process of trade negotiations between the US and China, which at the beginning of the year concluded an agreement on the implementation of the first part of the trade agreement. So, during a telephone conference in which such persons as: Vice-Premier of the State Council of the People's Republic of China L. He, Trade Representative of the United States R. Lighthizer and US Treasury S. Mnuchin, said that the need to strengthen cooperation and prevent the collapse of those agreements that have already been reached. Let me remind you that in connection with the coronavirus pandemic, the implementation of the first part of the trade agreement has become questionable, the obligations of the parties, in particular China, are not fulfilled in the volumes established by the agreement. Against this background, there is a discontentment of the American side, in particular President Donald Trump, who threatens to terminate the agreements that were reached. Against this background, we see a local weakening of the US dollar. Today, in terms of the economic calendar, we have the report of the United States Department of Labor, where we are waiting for another shock. So, based on forecasts, the unemployment rate could rise from 4.4% to 15.5%, which will be considered the highest rate in 72 years. At the same time, employment could be reduced by 21,780,000, which will also be considered a historical record. In turn, regarding the upcoming report, the head of the Federal Reserve Bank of Minneapolis, Neel Kashkari, has already managed to speak out, saying that the ministry may underestimate the figures and the real unemployment rate may reach 23%. In terms of the economic calendar, the upcoming trading week contains a number of macroeconomic data for March / April in Europe and the United States, which will continue to reflect the effects of quarantine measures on the economies of countries. The most interesting events displayed below ---> Tuesday, May 12 USA 12:30 Universal time - Inflation data for April Wednesday, May 13 EU 9:00 Universal time - Industrial production in March USA 12:30 Universal time - Producer Price Index (PPI), for April Thursday, May 14 EU 06:00 Universal time - Inflation data for April in Germany EU 9:00 Universal time - unemployment rate (Mar) USA 12:30 Universal time - Applications for unemployment benefits Friday May 15 EU 9:00 Universal time - GDP Q1 PRELIMINARY EU 9:00 Universal time - unemployment rate Q1 PRELIMINARY USA 12:30 Universal time - Retail Further development Analyzing the current trading chart, we see that the quote with surgical accuracy slowed down the movement within the level of 1.0850, where a recovery began to occur relative to yesterday's jump. So, a variable fluctuation cannot lead to a change in the clock component, which means that the general mood of the market will be preserved and we will soon see the level of 1.0775 again and, finally, we will pass it. It is difficult to say whether the report of the US Department of Labor can affect the general direction, but what we can definitely repeat again is Bullard's words - "it is not a surprise". Thus, the reaction of the market report may be across the principle of fundamental analysis. It can be assumed that if the specified mood is maintained from the level of 1.0850, the quote will continue to decline towards the subsequent level of 1.0775. Otherwise, chatter along the level of 1.0850 is not excluded. Based on the above information, we derive trading recommendations: - We consider selling positions lower than 1.0815, declining to 1.0775. Further progress is made after the price consolidates lower than 1.0770, with a prospect of a move to 1.0730 - 1.0700. - We consider buying positions in terms of local operations higher than 1.0860, with a movement towards 1.0885 - 1.0900 Indicator analysis Analyzing a different sector of time frames (TF), we see that the correction course has led to small changes in the readings of technical instruments, where the hour periods now reflect a neutral signal, and the daily sections retain their original direction. Volatility per week / Measurement of volatility: Month; Quarter; Year Measurement of volatility reflects the average daily fluctuation calculated for Month / Quarter / Year. (May 8 was built taking into account the time of publication of the article) The volatility of the current time is 35 points, which is a low indicator relative to the average daily value. Based on the information and news background, it can be assumed that the activity of market participants may grow, which will affect volatility. Key levels Resistance zones: 1.0850 **; 1.0885 *; 1.1000 ***; 1.1080 **; 1,1180; 1.1300; 1.1440; 1.1550; 1.1650 *; 1.1720 **; 1.1850 **; 1.2100 Support Areas: 1.0775 *; 1.0650 (1.0636); 1.0500 ***; 1.0350 **; 1.0000 ***. * Periodic level ** Range Level *** Psychological level The material has been provided by InstaForex Company - www.instaforex.com |
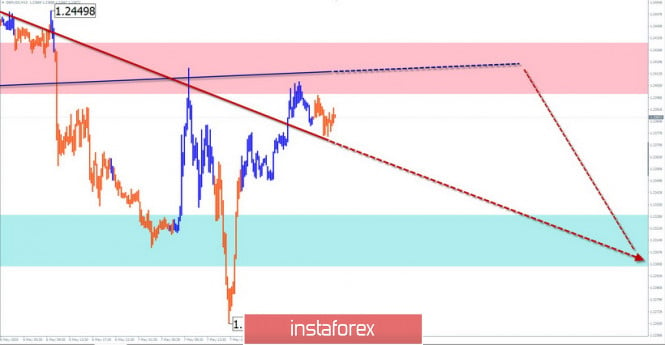
| Simplified wave analysis of GBP/USD, USD/JPY, and USD/CHF on May 8 Posted: 08 May 2020 02:17 AM PDT GBP/USD Analysis: The direction of the short-term trend of the British pound is set by the algorithm of the rising wave from March 18. Over the past month and a half, the price has moved sideways in a wide price range. Simplified wave analysis shows that the wave that started on April 30 completes the correction in the main wave. The structure lacks the final section. Forecast: Mostly sideways movement is expected over the next day. In the first half of the day, the price is likely to rise to the borders of the resistance zone. At the end of the day, you can expect a change of course and a second decline. Potential reversal zones Resistance: - 1.2400/1.2430 Support: - 1.2330/1.2300 Recommendations: Trading the pound on the market today is possible only within the intraday style. When buying, you should take into account the limited potential for recovery. It is more reasonable to reduce the size of the trading lot.
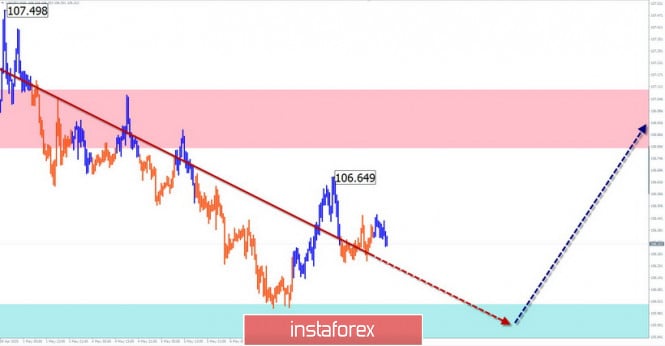
USD/JPY Analysis: The algorithm of the rising wave from March 9 sets the features of the movement of the major Japanese yen. The price has been adjusted for the last month and a half. By now, the price has reached the upper limit of the strong potential reversal zone. There are no signals of an early change of course yet. Forecast: In the coming sessions, it is expected to complete the downward movement of the price, up to the end of the entire bearish wave. By the end of the day, you can expect the formation of a reversal and the beginning of a price rise. A change in direction may be accompanied by increased volatility. Potential reversal zones Resistance: - 106.80/107.10 Support: - 106.00/105.70 Recommendations: Before the appearance of reversal signals, purchases are not recommended. The main focus should be on sales of the instrument.
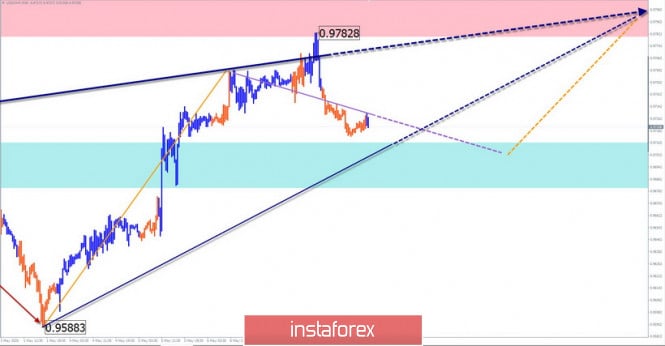
USD/CHF Analysis: The direction of the Swiss franc major is set by the upward wave from March 9. In the structure of the wave, the preparation for the final upward leap is completed. The last section of the wave trend started on May 1. Since yesterday, the price forms a correction. Forecast: Today, the franc market is expected to complete preparations for a new wave of the trend. The end of the downward movement is likely in the area of calculated support. Then, by the end of the day, you should wait for the formation of a reversal and the beginning of a price rise. Potential reversal zones Resistance: - 0.9780/0.9810 Support: - 0.9710/0.9680 Recommendations: Selling the pair today can be risky. It is recommended to refrain from trading until the reversal signals appear. Next, you should focus on finding the points of purchase of the instrument.
Explanation: In the simplified wave analysis (UVA), waves consist of 3 parts (A-B-C). The last incomplete wave is analyzed. The solid background of arrows shows the formed structure, and the dotted ones show the expected movements. Note: The wave algorithm does not take into account the duration of the tool movements in time! The material has been provided by InstaForex Company - www.instaforex.com |
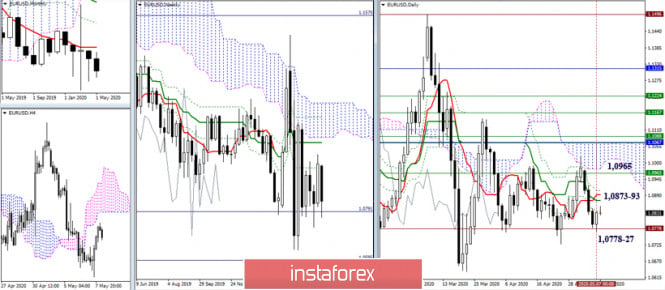
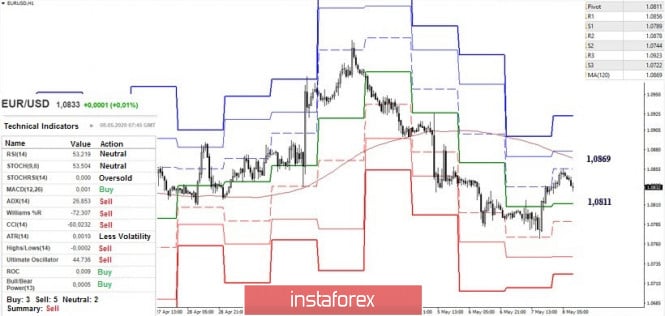
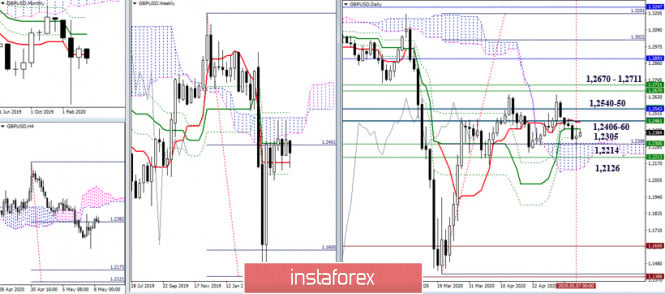
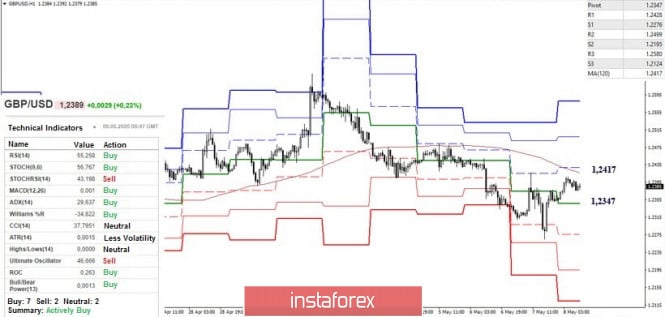
| Technical analysis recommendations for EUR/USD and GBP/USD on May 8 Posted: 08 May 2020 02:12 AM PDT Economic calendar (Universal time) The focus of today's economic calendar is on US unemployment rates and the number of people employed in the non-agricultural sector (USA). The publication of data is expected at 12:30. EUR / USD After reaching the historical support of 1.0778, the pair indicated a slow down once again. Therefore, for the bears in this area, the support zone of 1.0778 - 1.0727 (historical level + minimum extremum) remains significant. For players to increase, it is important to turn the current slow down into a full-fledged upward correction with far-reaching plans. The resistance of the daily Fibo Kijun is currently being tested (1.0839), then the resistances are located in the area of 1.0873-93 (Tenkan + Kijun), but the resistance of the weekly Fibo Kijun will continue to be of primary importance for the further restoration of bull positions and interests (1.0965) and daily cloud. On the other hand, the players to increase still managed to capture the central pivot level of the day yesterday after a long confrontation. This level turned now into a significant support at 1.0811. At the moment, we are seeing a pullback from the resistance R1 (1.0856). In the case of an upward correction, the main benchmark in the lower halves will be focused on breaking through the weekly long-term trend (1.0869). GBP / USD Returning to the support of the daily cloud, which is currently strengthened by the weekly Tenkan (1.2305), the pair indicated a slowdown. At the same time, the resistance in this situation remains the same - 1.2406 (daily Kijun) - 1.2460 (daily Tenkan + weekly Kijun + monthly Tenkan) - 1.2540-50 (monthly Fibo Kijun + weekly Senkou Span A) - 1.2670 - 1.2711 (weekly Fibo Kijun + Senkou Span B). The nearest support is also still retaining its location of 1.2214 (weekly Fibo Kijun) and 1.2126 (lower boundary of the daily cloud + target for breakdown of the H4 cloud). At the time of analysis, the pair at lower time intervals is in the correction zone and is close to testing the main correction target - the weekly long-term trend, which is now at the level of 1.2417. A reliable consolidation above will change the balance in favor of players to increase, opening up new perspectives for them. The following upsides inside the day today may be 1.2499 (R2) and 1.2580 (R3). With the loss of support for the central Pivot level (1.2347), there might be a chance to restore the downward trend. In this case, support within the day will be 1.2276 (S1) - 1.2195 (S2) - 1.2124 (S3). Ichimoku Kinko Hyo (9.26.52), Pivot Points (classic), Moving Average (120) The material has been provided by InstaForex Company - www.instaforex.com |
| GBP/USD Reversal Still Possible! Posted: 08 May 2020 01:58 AM PDT The currency pair moves sideways in the short term according to the H4 chart, the H&S pattern was invalidated for now, but some good US figures today could bring this chart pattern to life. The US Non-Farm Payrolls indicator is expected at -22000K, far below the -701K in March, the Unemployment Rate could increase from 4.4% to 16.0%, while the Average Hourly Earnings could increase by 0.5%. The economic figures could be crucial for the dollar, GBP/USD will register a significant movement around these releases.
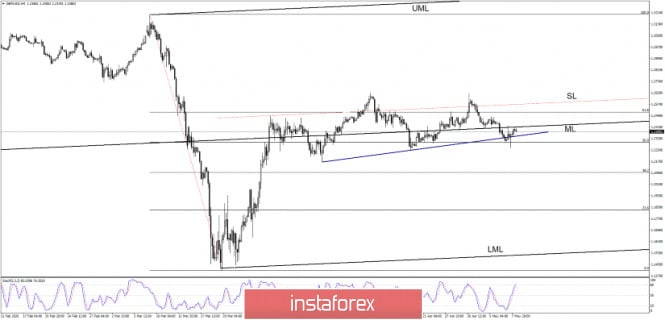
GBP/USD has developed a Head & Shoulders pattern, unfortunately, this formation wasn't confirmed as the price has registered only a false breakdown below the Neckline (dark blue uptrend line) and below the 50% retracement level. The failure to stabilize above the sliding parallel line (SL) has signaled that the upside movement could be finished and that a downside movement could develop in the days ahead. GBP/USD has come back to retest the median line (ML) as the USD was punished by the USDX's drop.
We can sell GBP/USD after a drop below the 1.2265 former low, the first major target could be around 23.6% (1.1829) retracement level. So, a valid breakdown below the dark blue uptrend line (neckline) and below the 50% level will confirm a significant drop. If you want to buy GBP/USD, maybe it would be better to wait for a valid breakout above the inside sliding line (SL - ascending dotted line), and above the 1.2647 high, the target will be somewhere at 1.3199 highest high. The material has been provided by InstaForex Company - www.instaforex.com |
| Posted: 08 May 2020 01:28 AM PDT Weak data on the US labor market, which revealed that initial applications for unemployment benefits continued to decline after the surge that occurred during the height of the coronavirus pandemic, increased the demand for risky assets, which rose the euro and the pound against the US dollar . Today, attention will be focused on the NonFarm Employment Change report in the US, where a decrease in the number of jobs by more than 22 million and a surge in the unemployment rate to 16% is expected. However, the data is unlikely to put significant pressure on the markets, since the expected negative indicators are already taken into account in quotes, and changes will occur only if the report is seriously different from the forecasts of economists. Yesterday, the heads of delegation at the US-China trade talks discussed the possibility of creating favorable conditions for a trade deal between the two countries after the COVID-19 pandemic ends. During a telephone conversation with Vice Premier Liu He, US Trade Representative Robert Lighthizer and US Secretary of Finance Steven Mnuchin agreed to create favorable conditions for the implementation of the first phase of the US-China trade agreement, which was concluded at the end of last year, but never came to its implementation due to the coronavirus outbreak. This infers that US and China do not intend to engage in a direct conflict, which US President Donald Trump has been trying to achieve recently, constantly criticizing China that they are responsible for the spread of the coronavirus. A telephone conversation between Putin and Trump also took place yesterday, during which the heads of state discussed the situation around the coronavirus pandemic, as well as the situation on the world oil market. The parties agreed that the timely conclusion of the OPEC + deal to reduce production on May 1 of this year already had a practical impact on the stabilization of oil prices. The heads of state also declared the importance of further dialogue and maintaining Russian-American contacts and relations. Meanwhile, each improvement in the situation of the US market increases the demand for risky assets. A good example of this is yesterday's report on the number of initial applications for unemployment benefits, which, according to the US Department of Labor, over the week from April 26 to May 2, has fallen to 3.2 million. This suggests that the record high number of unemployment applications decreases gradually relative to the decline of the pandemic, which has paralyzed the entire economy. As for the technical picture of the EUR / USD pair, volatility should be expected today, due to the release of important reports in the US labor market. Sellers of risky assets will try to tighten the pair at the level of 1.0825, which will lead to the demolition of a number of stop-orders of bulls and a larger sell-off in the region of the 1.0770 and 1.0720 lows. But if buyers turn out to be stronger, the upward correction will continue to the area of the weekly highs at the levels of 1.0890 and 1.0970. Another important event today is the speech of ECB head Christine Lagarde, which may announce the expansion of the regulator's asset repurchase program. Such decisions will strengthen the position of the euro against the dollar, but if Lagarde does not divulge on it, the market may ignore her statements. In this regard, recall that just recently, the German Court, although ruling that the quantitative easing program of the ECB does not violate the laws of Germany, announced that the Bundesbank should stop buying government bonds under the ECB program for the next three months. However, it will not be implemented as long as the ECB is able to prove the necessity and usefulness of the program. The decision caused the demand of risky assets to decline earlier this week, which led to a jump in Italian bond yields and a sharp fall of the euro against other currencies. The German court also criticized the decision of the EU court last 2018, when it legalized bond purchases without taking into account all the economic consequences that the program may lead to. Meanwhile, recent speeches of Fed representatives increased the demand of risky assets, as they uniformly talked about a bright economic outlook. One of the Fed representatives, Raphael Bostic, said that the actions of the Fed during the crisis (which has apparently ended according to Bostik) were bold and decisive, and if necessary, the regulator will continue to do everything that is required to support the economy. Although the path to economic recovery is extremely uncertain, strong support measures may bring a sharp jump in recovery later, as the market has already improved thanks to the actions of the Fed. Meanwhile, weak forecasts from Oxford Economics came out yesterday, where general inflation in the US is expected to reach negative territory, which would indicate deflation, the fight against which will take a long time. A temporary basic deflation is expected to be recorded in March, as well as a decline in the PCE index below 0.5%. The duration of a weak inflation will depend on the activity in the private sector. The material has been provided by InstaForex Company - www.instaforex.com |
| Posted: 08 May 2020 01:27 AM PDT
The report released on Thursday by the US Department of Labor revealed that more than 33 million Americans have filed initial jobless claims since quarantine. The number of standing claims, or the number of people receiving standing payments, currently stands at over 22 million, which far exceeds the crisis peak. Nevertheless, despite the fact that the economy is now starting to rise state by state, economists expect unemployment to remain record high and cover a wider range of industries. Not all businesses that closed during the quarantine period will survive, and many large corporations are reducing the number of jobs. The report released by the ADP on Wednesday showed that 20.2 million people lost their jobs last month. A more official report by the US Department of Labor will be published on Friday, where economists expect 22 million unemployment claims and an unemployment rate of 16%, the largest record in history. "The outlook of the labor market remains daunting," said Nick Bunker, an economist at Indeed, "statistics show that one in five people lose their jobs," he added. The record-breaking figures from the past seven weeks provide a clear picture that the US labor market is in distress and people are suffering. "The increasing job losses, that first hit cutting-edge services like restaurants and retailers, has now covered all corners of our economy, from manufacturing to even the healthcare industry," said Andrew Stettner, senior staff member at The Century Foundation. Meanwhile, on Thursday, the US dollar fell, as investors took profits from the rally this week ahead of Friday's US non-farm employment report for April, which could show huge job losses. Nevertheless, there are benefits from the decline: A weak dollar will help US exports, as goods will seem to be cheaper to foreigners. This will make the economic growth of the United States accelerate, which will make foreign investors attracted to US stocks. However, if enough investors leave the dollar for other currencies, the US dollar may collapse. A depreciation of the dollar could also mean a fall in the value of US Treasury bonds, which increases treasury yields and interest rates. Since profitability of treasury bills is the main driver of mortgage rates, this may mean that foreign central banks and sovereign funds hold less dollars. This reduces the demand for the currency. A weaker dollar buys fewer foreign goods. Thus, the price of imports will increase, contributing to inflation. Moreover, as the dollar weakens, investors in the 10-year Treasury and other bonds sell their dollar assets. Oil and other foreign contracts are denominated in dollars. A weaker dollar will lead to higher prices because exporting countries need to maintain their profit margins. The value of the dollar is one of the three factors that determine oil prices. China also has a big impact on the US dollar. To keep the yuan weak, the Chinese central bank buys dollars to keep it strong. China is the second largest foreign investor in the US dollar. In this regard, Donald Trump announced on Thursday that in a week or two, he will be able to report whether China is fulfilling its obligations under the trade agreement. Just recently, Washington approved punitive measures against Beijing, tying the guilt of the coronavirus to China. The material has been provided by InstaForex Company - www.instaforex.com |
| Trading plan for EUR/USD on May 8, 2020. NonFarm Payrolls report at 13:30. Coronavirus updates Posted: 08 May 2020 01:26 AM PDT
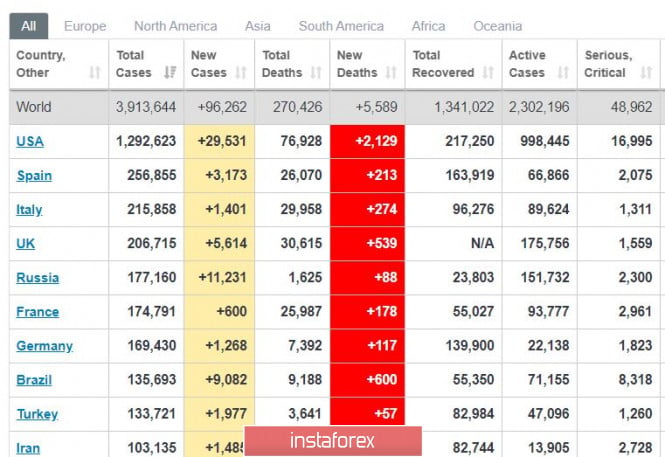
Coronavirus updates as of the morning of May 8: Almost 1.3 million cases have been detected in the United States. The number of deaths have reached almost 30 thousand. If we consider the mortality rate from the virus as 1%, then the real figure of infections in the US is about 3 million. In the US, the pandemic will stop at the expense of a significant number of active cases, as well as a reduction in infection rate due to this. Meanwhile, Russia ranks number 2 in the highest number of new cases (Moscow has more than 50% of cases). Russia is one of the five most infected countries in the world - and may possibly surpass Britain. In the US, the number of deaths is above 2,000 per day. To stop, a steady decrease below +1,500 deaths per day should be recorded. On May 8, Russia records the first signs of stabilization with the slight decrease in the daily growth of infections. However, conclusions can only be made after May 12.
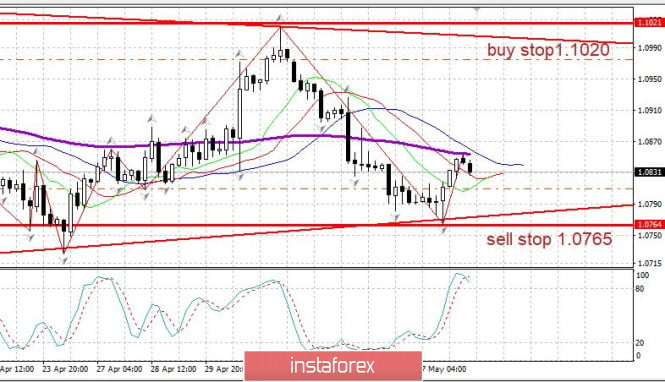
EUR/USD: The decline of the euro has stopped. Be ready to sell positions at a break of 1.0765 down, although a movement upwards is more likely. A breakout of 1.0855 will form a new level upwards. The material has been provided by InstaForex Company - www.instaforex.com |
| You are subscribed to email updates from Forex analysis review. To stop receiving these emails, you may unsubscribe now. | Email delivery powered by Google |
| Google, 1600 Amphitheatre Parkway, Mountain View, CA 94043, United States | |


 News:
News: 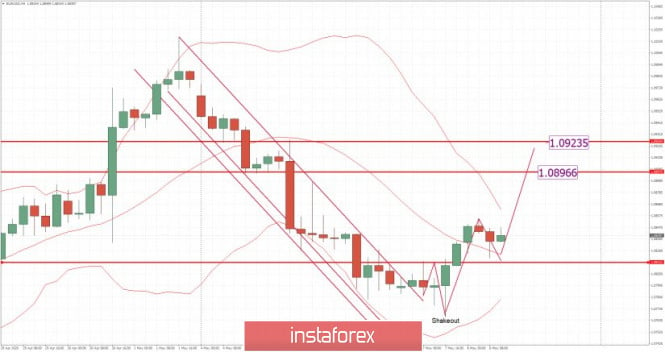





 It is not surprising that the productivity of workers, as well as work time and total production in the US fell sharply in the 1st quarter of this year. According to the report of the US Department of Labor, labor productivity outside of agriculture declined by 2.5% in the 1st quarter, with hourly productivity decreasing by 2.9%, and the number of working hours reducing by 3.8%. Economists expected productivity to drop by 5.5%.

No comments:
Post a Comment