Forex analysis review |
- Forecast for USD/JPY on June 26, 2020
- AUDUSD short term pull back towards ascending trendline support!
- EUR/USD facing bearish pressure, potential for further drop
- Control zones for GBP/USD on 06/26/20
- Control zones for EUR/USD on 06/26/20
- Hot forecast and trading signals for the GBP/USD pair on June 26. COT report. Sellers were confused about the 1.2403-1.2423
- Hot forecast and trading signals for the EUR/USD pair on June 26. COT report. Bright future of sellers is below $1.12, where
- Overview of the GBP/USD pair. June 26. John Bolton's new criticism of Donald Trump. European Parliament President David Sassoli
- Overview of the EUR/USD pair. June 26. The US dollar is again dominating, however, the bears' arrogance may be knocked down
- June 25, 2020 : EUR/USD Intraday technical analysis and trade recommendations.
- June 25, 2020 : GBP/USD Intraday technical analysis and trade recommendations.
- Evening review on EURUSD for June 25, 2020
- NZD/USD. RBNZ vs New Zealander: "kiwi" purchases are still a priority
- Gold gains strength
- Oil market continues to decline: cost of raw materials rapidly declines
- Stock market crisis matures: Europe, Asia, and America are declining
- Global economic slump seems inevitable
- USD tends to rise amid fears of COVID-19 second wave
- EURUSD: Germany will continue to pull the Eurozone on its shoulders. The problem of the spread of COVID-19 is again coming
- Analysis and outlook for GBP/USD for June 25, 2020
- Is it worth buying a dollar?
- Trading recommendations for the EUR/USD pair on June 25, 2020.
- BTC analysis for June 25,.2020 - Strong downside movement in the background and poitential for new down wave towards the
- GBP/USD: plan for the American session on June 25
- GBP/USD analysis for June 25, 2020 - Further bigger rally in the play towards the 1.2500
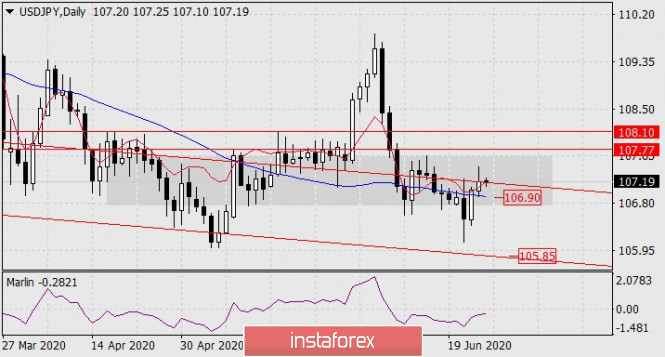
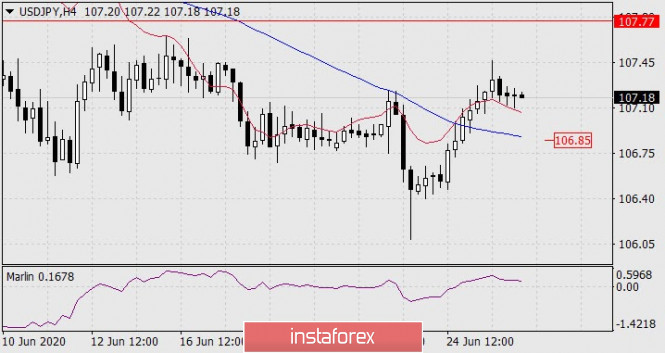
| Forecast for USD/JPY on June 26, 2020 Posted: 25 Jun 2020 07:41 PM PDT USD/JPY The yen was caught up in a complex and difficult range to trade, it is indicated by a gray area on the daily chart. US stock indices also formed a two-week horizontal trend and the current situation for the USD/JPY pair looks uncertain from the technical point of view. The price still needs to gain a foothold over the line of the price channel to continue the growth, on which it is now on the daily chart. The Marlin oscillator is not in a hurry to leave the declining trend zone, which may eventually turn into a false exit of the price up. The target growth level is 107.77. To move down the price you need to go below the support of the MACD line at a price of 106.90. In this case, the movement is more predictable - an attempt to work out support at 105.85. The support of the MACD line is near the price level of 106.85 on the four-hour chart, which almost coincides with the MACD line on the daily chart. This coincidence enhances the significance of the level and increases the reliability of the downward movement if this level is overcome. Recommendation: do not trade Japanese yen while it is in the range of uncertainty. The material has been provided by InstaForex Company - www.instaforex.com |
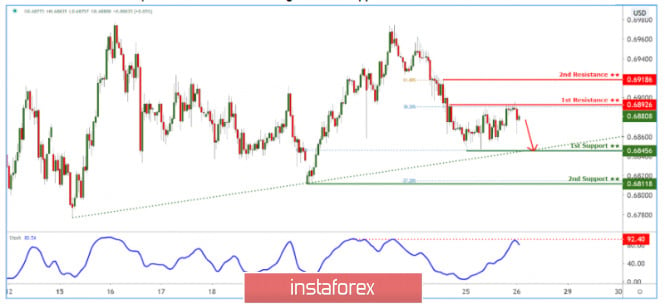
| AUDUSD short term pull back towards ascending trendline support! Posted: 25 Jun 2020 07:08 PM PDT
Trading Recommendation Entry: 0.68926 Reason for Entry: 38.2% Fibonacci retracement, graphical swing high Take Profit: 0.68456 Reason for Take Profit: 78.6% Fibonacci retracement, ascending trendline support Stop Loss: 0.69186 Reason for Stop Loss: 61.8% Fibonacci retracement The material has been provided by InstaForex Company - www.instaforex.com |
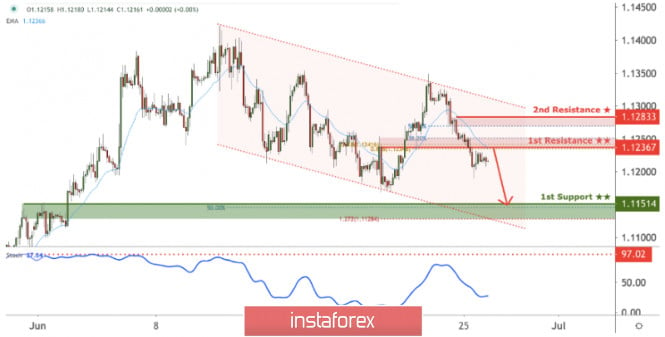
| EUR/USD facing bearish pressure, potential for further drop Posted: 25 Jun 2020 07:07 PM PDT
Trading Recommendation Entry: 1.12367 Reason for Entry: Horizontal overlap resistance and 38.2% fibonacci retracement Take Profit: 1.11514 Reason for Take Profit: Horizontal pullback support, 50% fibonacci retracement, 127.2% fibonacci extension Stop Loss: 1.12833 Reason for Take Profit: Horizontal swing high resistance, 50% fibonacci retracement The material has been provided by InstaForex Company - www.instaforex.com |
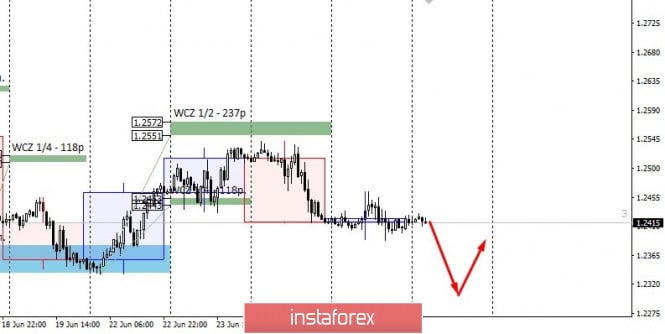
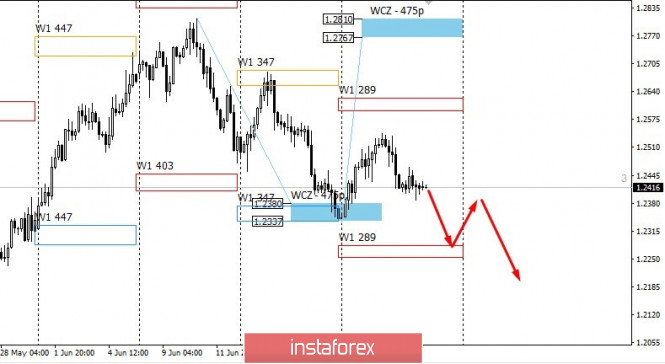
| Control zones for GBP/USD on 06/26/20 Posted: 25 Jun 2020 06:46 PM PDT Working towards weakening the British pound is the main task, because the growth did not disrupt the bearish momentum. Favorable selling prices were received yesterday. Keeping a short position is the main strategy. The first target of the fall is the weekly low. A further decrease will depend on how the pair reacts to the specified extreme. It is important to note that closing the current week below the low of the previous one will allow us to form a model in order to continue the decline with a medium-term outlook. This will make it possible to keep sales in the first half of July. Forming an alternative model will require forming an absorption pattern at the daily level. The probability of this event is below 25%, which makes purchases from current marks not profitable. It is worth noting that the formed accumulation zone provides good sales opportunities even from the middle of the range. Daily CZ - daily control zone. The area formed by important data from the futures market, which changes several times a year. Weekly CZ - weekly control zone. The zone formed by important marks of the futures market, which changes several times a year. Monthly CZ - monthly control zone. The zone, which is a reflection of the average volatility over the past year. The material has been provided by InstaForex Company - www.instaforex.com |
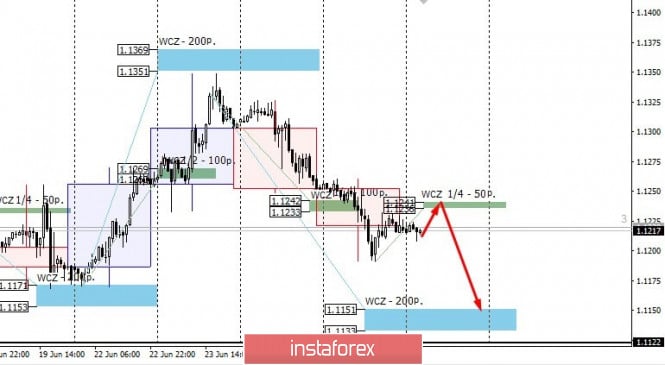
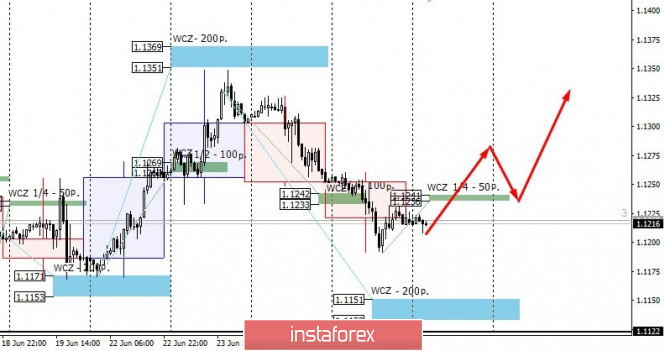
| Control zones for EUR/USD on 06/26/20 Posted: 25 Jun 2020 06:35 PM PDT The development in the downward direction becomes the main one at the end of the current week and the beginning of the next. The main goal of the bearish pattern was the weekly control zone 1.1151-1.1133. The probability of reaching this is 75%. We can get favorable selling prices while testing the weekly control zone 1/4 1.1241-1.1236. An accumulation zone is formed on the instrument for the third week, which requires taking into account weekly extremes when consolidating daily and medium-term positions. On the other hand, the alternative growth pattern has 25% probability, therefore, it will only be considered as an auxiliary one. Growth will resume if the closing of today's trading occurs above the opening of Thursday's trading, which will lead to the formation of an absorption pattern of the daily level. Daily CZ- daily control zone. The zone formed by important data from the futures market that changes several times a year. Weekly CZ - weekly control zone. The zone formed by the important marks of the futures market, which change several times a year. Monthly CZ - monthly control zone. The zone that reflects the average volatility over the past year. The material has been provided by InstaForex Company - www.instaforex.com |
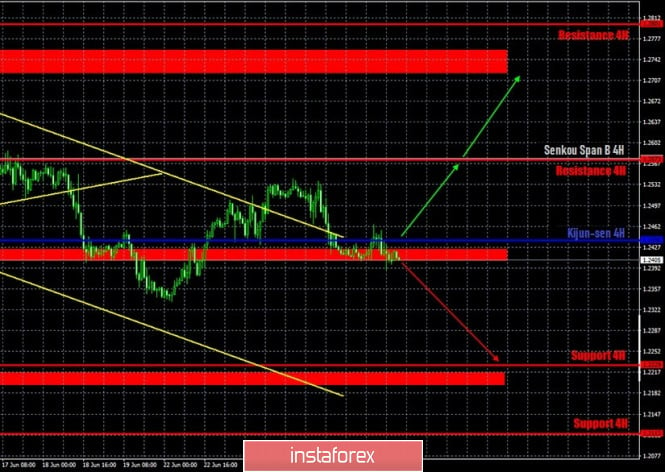
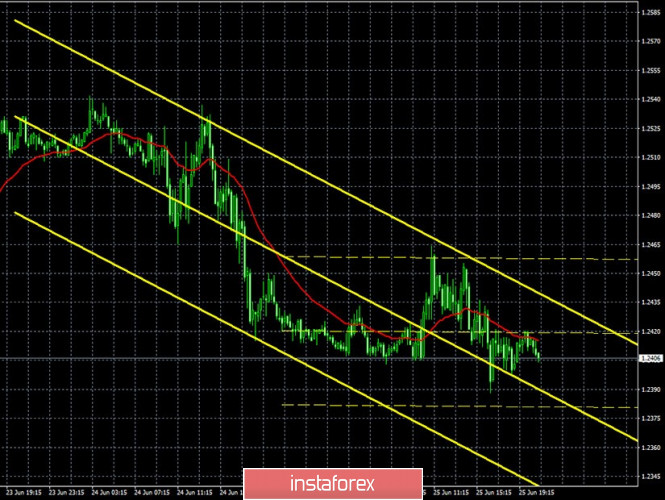
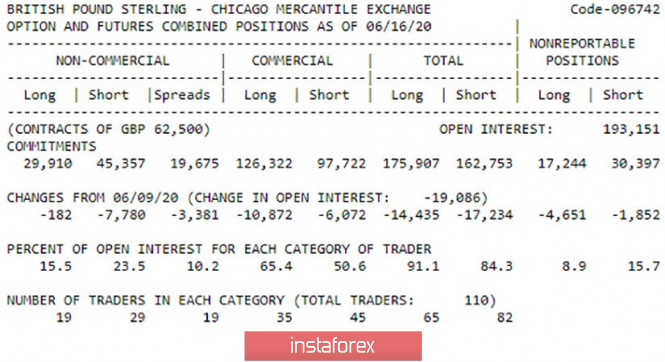
| Posted: 25 Jun 2020 06:09 PM PDT GBP/USD 1H If the EUR/USD currency pair continued its downward movement yesterday, then the GBP/USD currency pair stayed in one place almost the entire day - in the support area of 1.2403-1.2423, having failed to overcome it. Thus, a further hike down is delayed until the bears manage to overcome this area. The overall technical picture looks unambiguously in favor of sellers, since the price is below the Kijun-sen and Senkou Span B lines. However, a few days earlier, the pair's quotes also left the descending channel, which made market participants think about possibly forming an upward trend. The upward trend has not begun, but the general picture of the state of affairs has become confused. Yesterday, even quite strong macroeconomic statistics from overseas could not affect the pound/dollar. GBP/USD 15M The lowest linear regression channel turned sideways on the 15-minute timeframe, which, in principle, is not surprising, given that the whole pair was trading in a narrow price range. So far, there is no talk of an upward correction. COT report The latest COT report, which covers the dates June 10-16, shows that during this time period, professional market players were busy closing sales contracts. That is, the picture for the reporting week was observed exactly the same as for the euro. Demand increased during the indicated period, but not because the pound or the euro became more expensive. On the contrary, demand for the dollar decreased, and traders closed Sell contracts, which led to the growth of European currencies. This is precisely what we told traders to focus their attention on earlier, since there were simply no special reasons to buy the euro and the pound in recent weeks. Nevertheless, both currencies rose. It is also worth noting that, during the reporting week, speculators also closed purchase contracts, hedgers closed both types of contracts, and in general, the pound lost about 32,000 more contracts. Thus, banks, large companies, investment funds and others were engaged in closing all types of transactions during the reporting week, rather than opening contracts. The current week is very controversial. At first, the pound rose in price, then it became cheaper, and yesterday it just stood still. A new COT report could show minimal changes. The fundamental background for the GBP/USD pair has not changed at all on Thursday, since the UK still does not receive any important information. Macroeconomic statistics from across the ocean have simply been ignored, so traders have no choice but to trade under the conditions that already exist. As we have mentioned more than once, fundamental and macroeconomic backgrounds are not only contradictory, traders simply could not work them out or are openly ignored. Thus, first of all, you need to look at the technique. Buyers continue to expect positive information about the progress of negotiations between London and Brussels, but no one knows when they will receive it. In 2020, the pound is able to stay afloat because of the global pandemic, which has hit all countries of the world in the same way, somewhat levelling them. However, quarantines are over, economies are restarting, and the British economy continues to stall, and it could get stuck even more in the Brexit swamp in 2021 if there is no trade agreement between Brussels and London. There are two main scenarios as of June 26: 1) The initiative for the pound/dollar pair passed into the hands of buyers, but they do not want to take the opportunity. Therefore, it will be possible to resume downward trading after overcoming the support area of 1.2403-1.2423, which can happen in the next few hours. The target in this case will be the support level of 1.2229. Potential Take Profit in this case will be about 150 points. 2) But now, buyers again need to wait until they consolidate above the Kijun-sen line, which will give them a chance to resume moving upward with targets at the resistance level of 1.2573, resistance area of 1.2719-1.2759. Overcoming each target will allow traders to stay in buy positions. Potential Take Profit in this case will be from 125 to 270 points. At the same time, the Kijun-sen line is very close to the price and overcoming it can be a false signal to buy. Therefore, you are advised to treat long positions with caution. The material has been provided by InstaForex Company - www.instaforex.com |
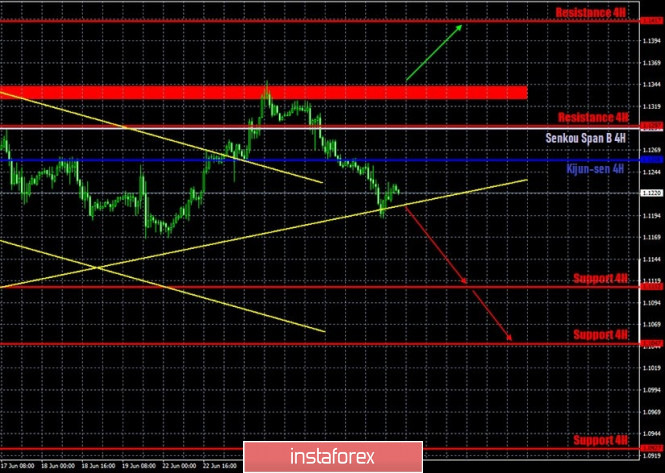
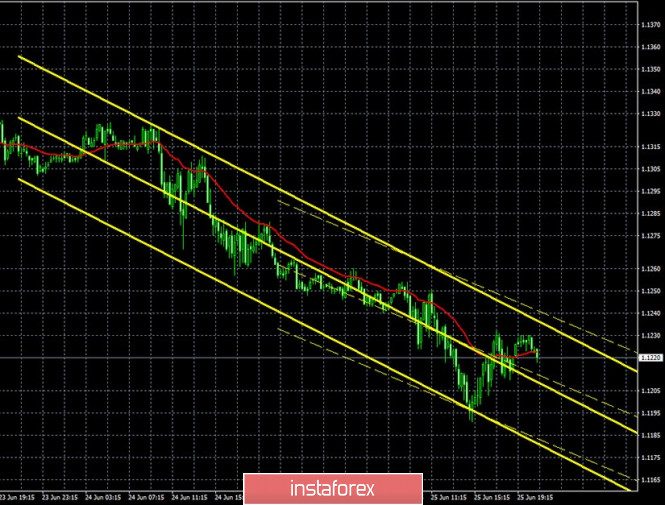
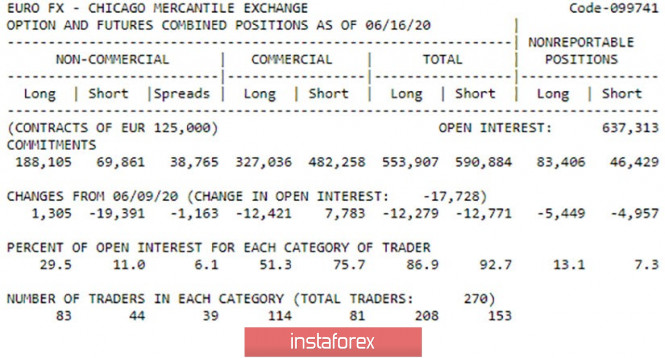
| Posted: 25 Jun 2020 06:09 PM PDT EUR/USD 1H Traders continued to retreat from the resistance area of 1.1328-1.1343 on the hourly timeframe on June 25 and worked out an ascending trend line by the end of the trading day, which continued to support traders to rise. The first attempt to overcome the trend line was unsuccessful, so for now, the bulls retain certain chances for the resumption of the upward trend. However, we believe that sellers have better chances now, therefore, we are waiting for the trend line to be overcome and the euro to fall further. It should also be noted that the pair overcame the important lines of Senkou Span B and Kijun-sen of the Ichimoku indicator on its way to the trend line, which also increases the likelihood of a continued decline. EUR/USD 15M Both linear regression channels turned down on the 15-minute timeframe, so the trend is now uniquely downward. There are currently no signs of starting an upward correction. COT Report The euro/dollar pair steadily rose until June 16 (the deadline, data for which is included in the latest COT report) and was only adjusted in recent days. According to the COT report, professional traders were busy during the entire reporting week not with opening purchase contracts, which could be assumed based on the direction the pair was moving, but with closing sale contracts. In just five days, professional traders closed almost 20,000 Sell contracts and opened 1,300 Long Euro contracts at the same time. Thus, strengthening the European currency was absolutely logical at that time. But for the second week in a row, we emphasize that large market players do not buy the euro, and therefore do not believe in the prospects of this currency. The euro grew for two weeks almost at the mere closure of contracts for sale by large speculators, which caused a skew of supply and demand for the euro. The pair went up about 170 points since Monday, after which almost the same went down, so it's hard to say how the mood of professional traders has changed over the current week. Most likely, we will not see major changes in the new COT report. The general fundamental background for the EUR/USD pair on Thursday has slightly changed. In recent days, the euro/dollar has resumed its downward movement, so the market began to talk that the US dollar will dominate, but we would not make such high-profile conclusions. As we have already figured out in the fundamental articles, it is highly likely that the pair will now be traded in a wide lateral band (400-500 points), since the future of the entire global economy is now so uncertain that it makes no sense to make any forecasts. The same goes for the European and US economies. If we only take economic factors into account, then both economies require additional stimulus packages, but problems arise with the adoption of both. Democrats and Republicans cannot come to an agreement on this issue in America; while, it is not possible to persuade the northern countries to provide free help to the southerners in the European Union. Thus, both economies are in the same position in some way. It would seem that macroeconomic factors influenced the course of trading on Thursday, but, for example, the pound/dollar pair did not react to it in any way, so maybe it has nothing to do with strengthening the US currency. The United States and the European Union will not release important publications on Friday. Based on the foregoing, we have two trading ideas for June 26: 1) Bears made an attempt to continue moving below the trend line, but it has been unsuccessful so far. Thus, we advise you to wait until we overcome this line and only open new sell orders with the targets of support levels 1.1112 and 1.1047 after that. Potential Take Profit range from 80 to 150 points. 2) On the other hand, buyers folded before the resistance area of 1.1326-1.1341, and now they need to go back to it and try to get a foothold higher again. We recommend that you wait until we overcome this area before buying the EUR/USD pair with the goal of the resistance level of 1.1417. Potential Take Profit in this case is about 70 points. The material has been provided by InstaForex Company - www.instaforex.com |
| Posted: 25 Jun 2020 05:36 PM PDT 4-hour timeframe
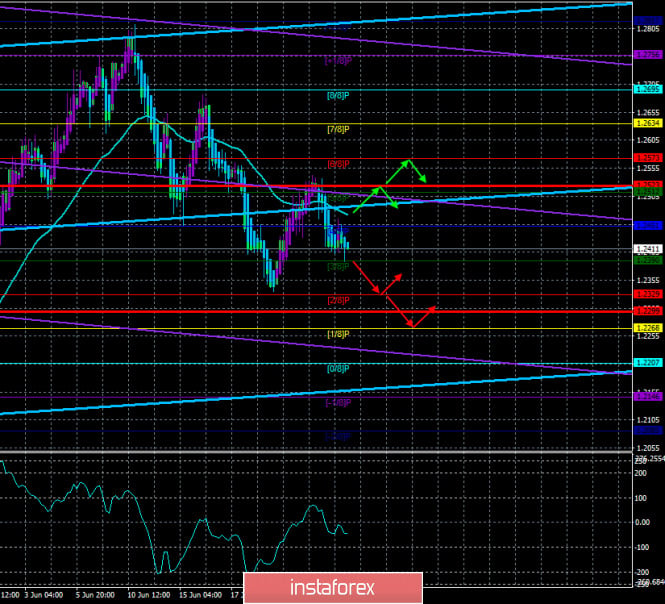
Technical details: Higher linear regression channel: direction - upward. Lower linear regression channel: direction - downward. Moving average (20; smoothed) - downward. CCI: -46.2769 The British pound also continued its downward movement during the fourth trading day of the week, but much more modest than the euro currency. However, the most important thing is that the pound/dollar pair is again fixed below the moving average line, therefore, the trend is now again downward. The last bars of the Heiken Ashi indicator is colored blue, so in the very short term, the downward movement is also maintained. However, we also draw the attention of traders to the fact that yesterday's news from overseas was ignored. If in the case of the European currency, the dollar continued to rise in price, then in pair with the pound - no. First, this is called decorrelation, and second, there is reason to assume that the dollar in pair with the euro grew not because of good statistics on orders for durable goods. In general, we stand by our opinion. There are no reasons for the growth of the British currency at this time. However, the market cannot stand still and just wait for these very reasons to appear. Large players who do not set their goal to get exchange rate differences, and do not wait for any specific moments to make major transactions for the sale or purchase of a particular currency. Therefore, the market moves even when there is no news. Thus, our assumption that the pound should continue to fall does not mean that the pair will go to price parity right now. However, the bias in the long term remains downward. We still recommend trading strictly on the trend. At this time, the verbal confrontation between Donald Trump and his former national security adviser John Bolton continues in the United States. In an interview with CNN, John Bolton said that Trump is not coping with the crisis caused by the "coronavirus" epidemic. "I have no confidence in how President Trump is handling this colossal crisis," Bolton said. Also, the former adviser to the President said that Trump made too big a bet on the trade deal with China and did not want to pay attention to the warnings of advisers about the danger of the "coronavirus" and its possible consequences from the very beginning. "He didn't want to hear bad news about the virus hiding in China or its potential impact on the trade deal he wanted to make. He didn't want to hear about the potential impact of the pandemic on the American economy and its impact on his re-election," Bolton concluded. The former White House resident also said that Trump is more concerned about his re-election and campaigning than running the country and thinking in the national interest. By the way, according to most experts and political scientists, Donald Trump is doing well only with the economy. On all other issues, his level of support is lower than that of Joe Biden. And this is although Biden continues to remain completely in the shadows. Trump is actively traveling around the country, giving interviews left and right, and does not let you forget about yourself for a second. Joe Biden can not hear any sound. However, sooner or later, "sleepy Joe", as Trump called him, will still have to be included in the election race. His ratings are already high and it even seems that Biden does not need to do anything at all, Trump himself has already done everything for him. Meanwhile, the entire process of Brexit negotiations between Brussels and London is firmly stuck in a puddle. The parties cannot come to any compromise. Previously, Johnson was regularly criticized by Michel Barnier. Yesterday, the President of the European Parliament, David Sassoli, said that the British Prime Minister did not want to compromise for an agreement during the last EU summit. Mr. Sassoli expressed doubt that Boris Johnson wants to agree at all. "Together we are very concerned because we do not see much enthusiasm from the British authorities and we do not see a strong desire to reach an agreement that satisfies all parties," the President of the European Parliament said. Thus, the time is slowly approaching July - the month until the end of which Boris Johnson "saw no obstacles to the conclusion of an agreement", and London and Brussels are in the same place as they were in March. Now, in general, there is a situation for the pound/dollar pair, when it is completely unclear what long-term prospects a particular currency has. On the one hand, there are a huge number of problems in the United States, from the "coronavirus" to the political crisis named after Donald Trump. On the other hand, the UK is full of economic problems, as well as a high probability that there will be no deal with the European Union at all, which threatens to cause new financial problems. However, the pair cannot stand still until the balance between currencies is disturbed or new factors appear that can affect the mood of market participants. Therefore, there will still be movements and in the current conditions, we recommend trading following technical analysis. There are no macroeconomic reports scheduled for the last trading day of the week in the UK. However, during the entire current week, there were no such statistics. Thus, we do not expect strong movements tomorrow. At the same time, traders now do not need fundamental factors to conduct active trading. Therefore, the pair can safely trade actively and without macroeconomic data. So far, the technical picture is in favor of continuing the downward movement. The lower linear regression channel turned down. In the hourly time frame, the price broke above the rising trend line. In the most short-term plan, we can only wait for the overcoming of the support area of 1.2403-1.2423 and the further movement down another 200 points is unlikely to be prevented by anything. In any case, as long as the pair is trading below the moving average, it is the downward mood that persists.
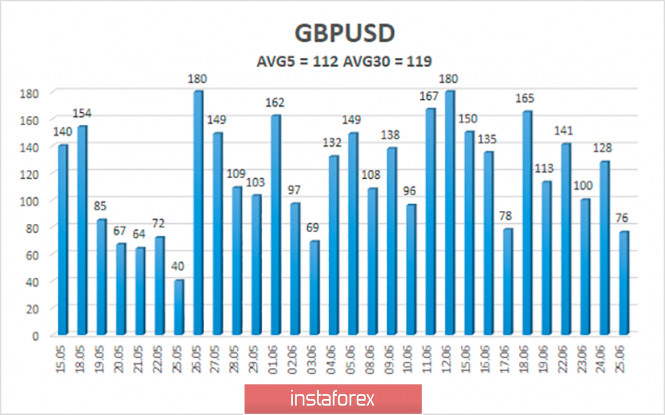
The average volatility of the pound/dollar pair continues to remain stable and is currently 112 points per day. For the pound/dollar pair, this indicator is "high". On Friday, June 26, thus, we expect movement within the channel, limited by the levels of 1.2299 and 1.2523. Turning the Heiken Ashi indicator upward will indicate a new round of corrective movement. Nearest support levels: S1 – 1.2390 S2 – 1.2329 S3 – 1.2268 Nearest resistance levels: R1 – 1.2451 R2 – 1.2512 R3 – 1.2573 Trading recommendations: The pound/dollar pair turned down on the 4-hour timeframe and settled below the moving average. Thus, today it is recommended to sell the pound/dollar pair with the goals of 1.2329 and 1.2299 and keep the shorts open until the Heiken Ashi indicator turns up. it is recommended to buy the pound/dollar pair after the reverse consolidation of quotes above the moving average with the first goals of 1.2523 and 1.2573. The material has been provided by InstaForex Company - www.instaforex.com |
| Posted: 25 Jun 2020 05:36 PM PDT 4-hour timeframe
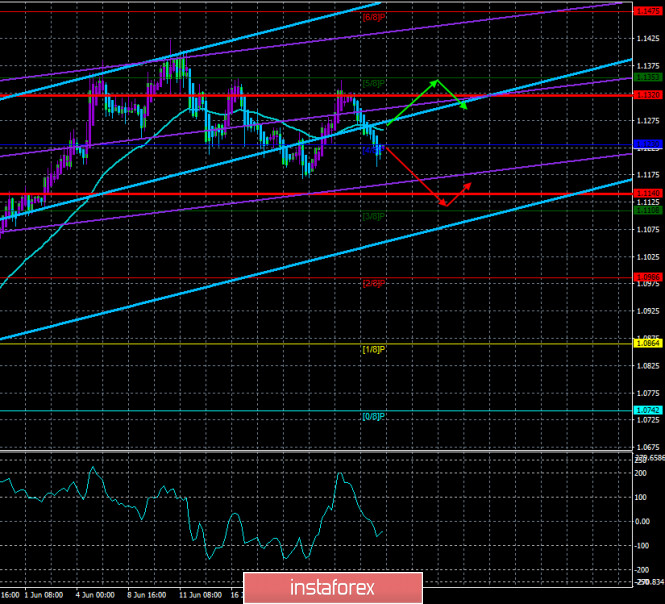
Technical details: Higher linear regression channel: direction - upward. Lower linear regression channel: direction - upward. Moving average (20; smoothed) - sideways. CCI: -42.0018 For the euro/dollar currency pair, the fourth trading day of the week was in a downward movement. Thus, everything would have been perfectly beautiful if the pair had not performed a rather unreasonable growth towards the upper line of the Ichimoku cloud a few days earlier, which confused all the cards, and at the same time made us assume that the bulls were back at work and preparing for a new upward trend. However, as it turned out in practice, the upward movement was again an accident. On Thursday, traders resumed selling the euro and buying the US dollar, which led to a new fall in the euro/dollar currency pair. We believe that in the current circumstances, it is a further drop in quotes that is the most logical and reasonable option. The fact is that we have listed the problems of the United States many times recently. And we remain of our opinion that in the long term, the US dollar has lost its advantage, which means that in the next year or two, the euro is unlikely to fall much in price, provided there are no shocks. Thus, our assumptions about the need for dollar growth are based solely on the unreasonableness of the previous growth of the euro currency. From our point of view, there were no reasons to strengthen the euro. If we leave aside all non-economic topics, the situation in the EU and the US is approximately the same. Yes, it is America that is causing more concern now, because it is across the ocean that the epidemic continues to spread as if there were no quarantine, lockdown, or restrictions. There is no second wave now in the US, the first lingering wave continues. However, this is not critical for the American economy. It has already declined quite significantly, unemployment is high, and the labor market is weak. Therefore, the fact that the "coronavirus" continues to collect more victims does not particularly worsen the state of the US economy. On the contrary, with the lifting of restrictive measures, the economy began to recover, because it was the quarantine that caused its severe decline, and not the "coronavirus" at all. "Coronavirus" at this time is a human question, a question of life and death, a question of the health of all nations. It has little impact on the world economy. The economy is greatly affected by government actions to combat the epidemic, border closures, supply disruptions, and the inability to move freely. The same applies to mass protests and rallies in the United States. This is a purely social issue. As well as the health of the nation, since it was after the start of mass protests that the growth rate of COVID-2019 began to accelerate. These protests do not have a significant impact on the economy. And the same applies to the political crisis. The future of this country, peace on the world stage, as well as foreign policy and relations with China and the European Union depend on who will become the next US President. However, "here and now", the absurd actions of Trump and his funny and regular comments and interviews, which are trusted only by his ardent fans, do not have any impact on economic indicators. And the same picture in the confrontation between China and the United States. The fact that the relationship is heating up does not concern traders and investors. The US dollar remains the number one currency in the world, the currency in which the absolute majority of all international payments take place. Therefore, a new trade or "cold" war between these giants will affect their economies, and only through the economy will the exchange rate of national monetary units change. Thus, all these topics are certainly very important and interesting, and they should not be overlooked since they will play a role in the medium and long term. But they do not affect the dollar exchange rate "here and now". The key factors that are extremely important for the euro/dollar pair remain the same and approximately equal. The economies of both regions have shrunk, the rates of both central banks have been reduced "to zero or below", and both regions are currently unable to agree and accept new aid packages for their economies. Thus, we believe that the US dollar should recoup all the losses of recent weeks in pair with the euro currency, after which the pair should be traded in a wide (as for small time frames like 4-hour) side channel. Yesterday, a lot of important and significant information was published in the United States. First of all, this is the report on GDP for the first quarter, which a month ago predicted a reduction of 4.8%, but now it is equal to -5%. On Thursday, this figure was confirmed. A new report on applications for unemployment benefits showed that the number of primary applications increased by almost 1.5 million during the reporting week, while the number of secondary applications remained almost unchanged at 19.5 million. These 19.5 million can be considered the number of Americans who lost their jobs during the pandemic and crisis of recent months. Given the fact that the economically active population in the United States is now about 160-165 million, 20 million of them are 12.5%. Plus, you should consider those Americans who do not work and do not apply for benefits. Thus, the real unemployment in the United States is now at least 12.5%, and most likely more. The report on orders for durable goods is also quite important. The main indicator was +15.8% in May, the indicator excluding defense orders was +15.5%, excluding transport orders - +4%, excluding defense and aviation - +2.3%. All four indicators significantly exceeded their forecast values. In total, the entire package of macroeconomic statistics can be called quite positive, or at least not negative. Thus, it could provide support for the US currency, even though it was in high demand in the morning when paired with the euro and without it. And, for example, the British pound during the past day almost did not fall in price. On the last trading day of the week in the US, only frankly secondary reports on changes in the volume of personal income and spending of the American population are planned. Personal income is expected to fall by 6% at the end of May, while expenses will grow by 9%. However, these figures are now completely disconnected from reality and are unlikely to interest market participants. There are no major events planned in the European Union today. Thus, since the euro/dollar pair is fixed below the moving average line, the downward movement should continue. However, we believe that the pair can form a kind of side-channel right now. And in this case, after reaching the mark of 1.1170, a rebound will occur and a new round of upward movement will begin. In any case, as before, we recommend that you first pay attention to technical factors and trade strictly on the trend.
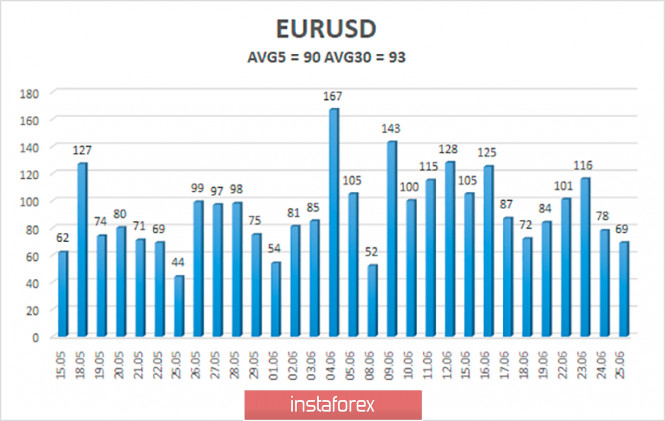
The average volatility of the euro/dollar currency pair as of June 26 is 90 points and now the value of the indicator is characterized as "average", but in general, the volatility continues to decrease. We expect the pair to move between the levels of 1.1140 and 1.1320 today. The reversal of the Heiken Ashi indicator upward may signal about a possible new cycle of an upward trend. Nearest support levels: S1 – 1.1108 S2 – 1.0986 S3 – 1.0864 Nearest resistance levels: R1 – 1.1230 R2 – 1.1353 R3 – 1.1475 Trading recommendations: The euro/dollar pair changed its direction again and settled below the moving average line. Thus, at this time, short positions with the goals of 1.1140 and 1.1108 are relevant, which it is recommended to keep open until the MACD indicator turns up. It is recommended to return to buying the pair not before fixing the price above the moving average with the first goals of 1.1320 and 1.1353. The material has been provided by InstaForex Company - www.instaforex.com |
| June 25, 2020 : EUR/USD Intraday technical analysis and trade recommendations. Posted: 25 Jun 2020 10:01 AM PDT
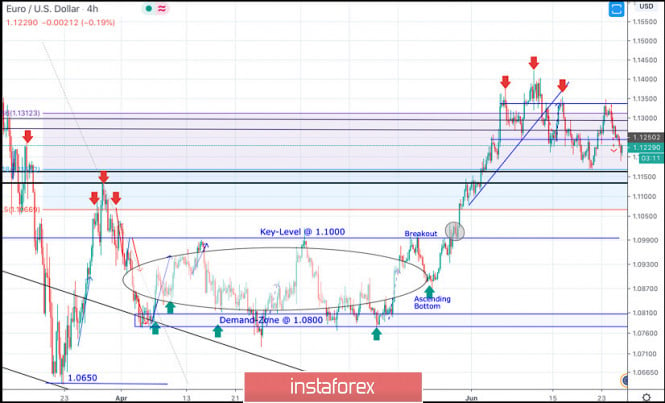
On March 20, the EURUSD pair has expressed remarkable bullish recovery around the newly-established bottom around 1.0650. Bullish engulfing H4 candlesticks as well as the recently-demonstrated ascending bottoms indicated a high probability bullish pullback at least towards 1.1065 (Fibo Level 50%). However, a previous bearish Head & Shoulders pattern was demonstrated around the price zone between (1.1075-1.1150). Shortly after, a sideway consolidation range was established in the price range extending between 1.0770 - 1.1000. On May 14, evident signs of Bullish rejection have been manifested around the price zone of (1.0815 - 1.0775). Moreover, recent ascending bottom has been established around 1.0870 which enhances the bullish side of the market in the short-term. Intermediate-term technical outlook remains bullish as long as bullish persistence is maintained above the recently-established ascending bottom around 1.0850-1.0870. Bullish breakout above 1.1000 has enhanced further bullish advancement towards 1.1175 (61.8% Fibonacci Level) then 1.1315 (78.6% Fibonacci Level) where bearish rejection was anticipated. Although the EUR/USD pair has temporarily expressed a bullish breakout above 1.1315 (78.6% Fibonacci Level), negative divergence as well as bearish rejection were being demonstrated in the period between June 10th- June 12th. This suggested a probable bearish reversal around the Recent Price Zone of (1.1270-1.1315) to be watched by Intraday traders. That's why, Bearish persistence below 1.1250-1.1240 (Head & Shoulders Pattern neckline) was needed to confirm the pattern & to enhance further bearish decline towards 1.1150. Trade recommendations : The recent bullish pullback towards the price Zone around 1.1300-1.1350 (recently-established supply zone) was recommended to be watched as a valid SELL Signal.T/P levels to be located around 1.1175 then 1.1100 while S/L to be lowered to 1.1300 to offset the associated risk. The material has been provided by InstaForex Company - www.instaforex.com |
| June 25, 2020 : GBP/USD Intraday technical analysis and trade recommendations. Posted: 25 Jun 2020 09:07 AM PDT
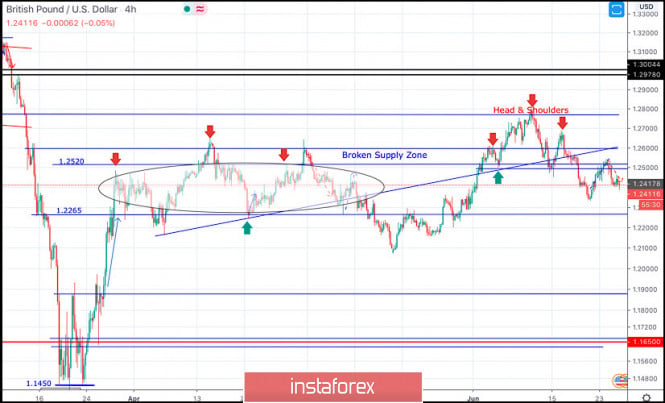
Recently, Bullish breakout above 1.2265 has enhanced many bullish movements up to the price levels of 1.2520-1.2590 where temporary bearish rejection as well as a sideway consolidation range were established (In the period between March 27- May 12). Shortly after, transient bearish breakout below 1.2265 (Consolidation Range Lower Limit) was demonstrated in the period between May 13 - May 26. However, immediate bullish rebound has been expressed around the price level of 1.2080. This brought the GBPUSD back above the depicted price zone of 1.2520-1.2600 which failed to offer sufficient bearish rejection. Hence, short-term technical outlook has turned into bullish, further bullish advancement was expressed towards 1.2780 (Previous Key-Level) where signs of bearish rejection were expressed. Short-term bearish pullback was expressed, initial bearish destination was located around 1.2600 and 1.2520. Moreover, a bearish Head & Shoulders pattern (with potential bearish target around 12265) is being demonstrated on the chart. That's why, bearish persistence below 1.2500 ( neckline of the reversal pattern ) pauses the bullish outlook for sometime and should be considered as an early exit signal for short-term buyers. Any bullish pullback towards 1.2520-1.2550 (recent supply zone) should be watched by Intraday traders for a valid SELL Entry. Trade recommendations : Intraday traders can wait for the current short-term bullish pullback towards 1.2500-1.2550 (Backside of the broken uptrend) for a valid SELL Entry. S/L should be placed above 1.2600 while T/P level to be located around 1.2265. The material has been provided by InstaForex Company - www.instaforex.com |
| Evening review on EURUSD for June 25, 2020 Posted: 25 Jun 2020 09:02 AM PDT
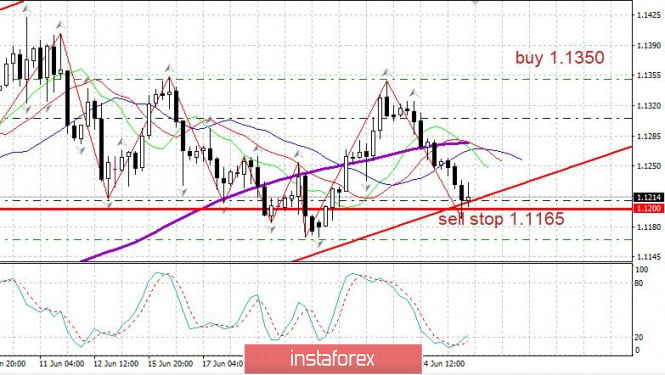
EURUSD: The important US data came out which turns out to be negative. The unemployed again rose to 1.5 million per week and the long-term unemployment of 19.5 million. There is not much progress. On the other hand, orders for durable goods came out positive with a sharp increase of 15% in May after a strong fall of 18% in April. Euro is pushed downward. Prepare to sell from 1.1165. Stop at 45 points with a minimum goal of 100 points. The material has been provided by InstaForex Company - www.instaforex.com |
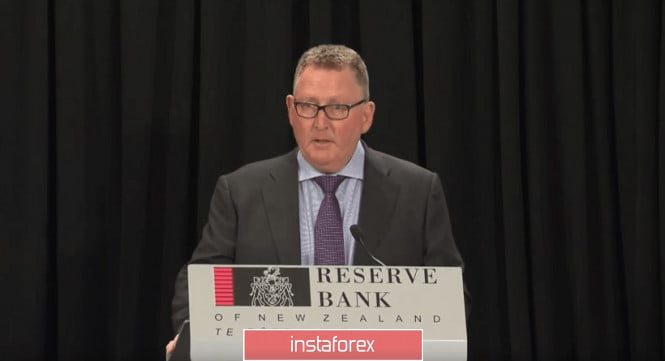
| NZD/USD. RBNZ vs New Zealander: "kiwi" purchases are still a priority Posted: 25 Jun 2020 08:41 AM PDT The Reserve Bank of New Zealand at its last meeting, which was held yesterday, June 24, tried to reduce the exchange rate of the national currency. In part, it succeeded: the New Zealand dollar reacted negatively to the "dovish" rhetoric of the RBNZ, and in pair with the US currency weakened by almost 100 points, falling to the base of the 64th figure. But with that, the southern momentum faded. The NZD/USD pair could not even update the weekly low (0.6375), although all the prerequisites, at first glance, were for this: the Central Bank of New Zealand ignored the positive signals from the macroeconomic reports and threatened further easing of monetary policy. It is worth noting that the RBNZ is one of those Central Banks where communication is "lame" – it is quite capable of surprising market participants with its unexpected decision or rhetoric. For example, last summer, the New Zealand regulator thoroughly shook up the markets by lowering the interest rate by 50 basis points without any warning. At that time, the financial world was feeling the effects of the trade war between the United States and China. By the way, the Central Bank of New Zealand was the first among the Central Banks of key countries of the world, which decided to ease monetary policy – it was then followed by the Fed, ECB, RBA, and some other regulators. Then the head of the New Zealand Central Bank, Adrian Orr, said that New Zealand may have to deal with negative rates – in the event of a crisis, the regulator can reduce the key interest rate to -0.35%.
The crisis came, however, the rate remained above zero – in March, the Central Bank lowered it by 75 basis points, bringing it as close as possible to zero (since then, the rate has been at 0.25%). At the same time, the RBNZ at its May meeting, firstly, increased the volume of quantitative easing from 33 to 60 billion, and secondly, did not rule out the introduction of negative rates in the foreseeable future. Commenting on the decisions made, Orr said that the rate can only be revised downward, while the Central Bank does not plan to tighten monetary policy for (at least) the next 12 months. He also did not rule out further expansion of QE "if necessary". Orr voiced similar rhetoric at the June meeting. However, this time his words sounded more "smoothed", without mentioning the option of negative rates. But the head of the Central Bank said that the Central Bank will regularly review the asset purchase program. He also repeated the standard phrase that the Central Bank is ready to use "additional monetary policy tools". Adrian Orr did not focus on the positive trends in the country's economy, for an understandable reason: he is not satisfied with the current exchange rate of the New Zealand dollar. According to him, the growth of the exchange rate has put additional pressure on the profit from exports, while the balance of risks for the economy remains downward. Traders could not ignore such soft rhetoric, after which the New Zealander in the greenback pair suspended its growth. The pair NZD/USD rolled back to the level of 0.6402, however, the bears could not organize a break into the area of the 63rd figure. For several reasons. First, the "dovish" theses from Adrian Orr were quite predictable – many experts warned that the Central Bank would exert verbal pressure on the national currency. Second, recent macroeconomic reports indicate that the island nation's economy is gradually but surely recovering. For example, the index of business activity in the manufacturing sector rose in June to almost 40 points after a record may decline to 26 points. In the services sector, the PMI index also showed good dynamics, remaining above the key 50-point level. The above releases have not yet fully reflected the restart of the economy. Third, the last two GTD auctions closed "in the black", reflecting the growth of the price index for dairy products. Fourth, New Zealand has almost completely got rid of the coronavirus (now there are only 10 infected people per 5 million population), which suggests that the economy will recover in the second half of the year.
All these factors slowed down the southern momentum of the NZD/USD, after which the pair began to attract the attention of buyers. In turn, the US currency can not pull the "kiwi" down on its own: the US dollar index is still fluctuating in a flat, so we can not talk about any "dollar rally" now. The greenback showed its strengthening in the first half of the day against the background of another surge in anti-risk sentiment: traders were scared by the anti-record, which was recorded in the United States. The daily increase there exceeded the April figures (more than 35 thousand infected in 24 hours). This fact provoked panic about the fact that the country will again be closed for quarantine. But White House economic adviser Larry Kudlow today repeated the previously voiced thesis that Washington does not plan to introduce restrictive measures nationwide. He allowed the introduction of restrictions "in certain places", but excluded a general lockdown. This fact eased concerns about the increase in the number of infected people, after which the demand for the dollar decreased. Thus, the New Zealand dollar at the end of the June meeting of the RBNZ maintained its attractiveness, despite the "dovish" remarks of the head of the regulator. At the moment, the NZD/USD pair is just below the average line of the Bollinger Bands indicator on the daily chart (0.6450) – as soon as buyers are fixed above this target, long positions can be considered. The main goal of the upward movement is the mark of 0.6590 – this is the upper line of the Bollinger Bands indicator on the daily chart. The material has been provided by InstaForex Company - www.instaforex.com |
| Posted: 25 Jun 2020 07:41 AM PDT
The price of gold rises today. The price of futures contracts for delivery in August moved to the level of $ 1,774.75 per troy ounce, which reflected an insignificant but growth of 0.02%. The support of the precious metal was at around 1,728.30 dollars per troy ounce, and the resistance, in turn, moved to the area of 1,796.10 dollars per troy ounce. Recently, there has been a surge in interest in buying gold on the market, which is due primarily to the difficult external economic and epidemiological situation in the world. Quiet Harbor is once again popular because extremely uncertain times are coming, requiring more deliberate and restrained decisions. Thus, the buy signal forced the price of the precious metal to rise to the level of $ 1,773 per troy ounce. Moreover, further growth should continue, and no significant sales are yet to be expected. On the other hand, quite serious problems were revealed in the spot silver market, which rapidly fell from the previously occupied level of 18–18.10 dollars per troy ounce to a new value of 17.65–17.55 dollars per troy ounce. Hopes for an immediate recovery are also not yet in the sight here. As for the further trend in the gold market, for at least a week (that is, in the short term) it is worthwhile to be ready for continued growth and good strengthening of the precious metal. At the same time, its value during the session can vary from positive to negative. In general, the forecast can be considered neutral. In the long run, one cannot speak with confidence about a significant increase in gold: too many factors for the fall are not leveled by anything. The cost of silver futures for delivery in July increased by 0.16%, which allowed it to go to the mark of $ 17.642 per troy ounce. In contrast, futures contracts for copper for July delivery are down by 0.15%, pushing back their level of $ 2.639 per pound. The material has been provided by InstaForex Company - www.instaforex.com |
| Oil market continues to decline: cost of raw materials rapidly declines Posted: 25 Jun 2020 07:41 AM PDT
The cost of crude oil began to decline rapidly this morning. This is due to the increasing number of newly reported cases of coronavirus in the world. In addition, the news about the growth of raw material reserves in the United States of America seriously pressed the black gold market. The rise has been happening for the third week in a row, which cannot but upset not only analysts but also market participants. Investors are extremely worried about what is happening in some US states. A record-high number of coronavirus infections is once again recorded in California, Florida, and Texas. This suggests that the removal of previously imposed quarantine restrictions was too premature, and it is likely that they will return again. If this happens, the demand for crude oil will again seriously shake. Of course, such prospects do not please market participants at all, who are already tuned to strengthen the position of black gold. In addition to this, a huge number of new cases of COVID-19 are observed in Latin America, as well as in China, which has already suffered greatly from the first wave of the pandemic. It is likely that the second wave can overwhelm again, if not the whole world, then some strategically important territories, which means that it will be necessary to return quarantine measures from which the world economy has already seriously suffered. Restrictions will lead to the fact that the demand for raw materials will fall dramatically, and the reserves of crude oil will become so large that they can not fit into oil storage facilities. This will be another collapse in the oil market. The statistics published by the United States Department of Energy adds to this entire negativity. As it became known yesterday, crude oil reserves in the state increased by 1.4 million barrels. This has been evidence of an increase for the past three weeks in a row. In addition, real data did not coincide with preliminary forecasts of analysts who expected a reduction of about 100 thousand barrels. On the contrary, the stocks of raw materials at the strategically important storage area in Cushing decreased by 1 million barrels, which reassured investors a little. But at the same time, the extraction of crude oil increased by 500 thousand barrels per day and has already reached 11 million barrels per day. Gasoline inventories in the United States decreased by 1.7 million barrels, which also turned out to be lower than the experts forecasted level. According to preliminary data, fuel reserves should have decreased by 1.9 million barrels. Distillate stocks rose by 249 thousand barrels, although previously it was said about an increase of no more than 100 thousand barrels. In general, analysts' forecasts once again did not coincide with reality, which turned out to be slightly worse than the expected result. This, of course, afflicted investors who thought about how events would develop in the market in the future. There was an assumption that the positive dynamics of oil, noted recently, came to an end and a new stage began, associated with a serious drop. If this is true, in the near future, black gold may lose all the advantages that it managed to achieve. This morning, the price of futures for Brent crude oil for delivery in August at a trading floor in London has already fallen to 0.89% or 0.36 dollars. Its current level is consolidating so far in the region of 39.95 dollars per barrel. Thus, it is clear that oil again fell below the extremely important mark of $ 40 per barrel. It is she who allows the raw materials to push off in order to grow taller. Recall that yesterday's trading also ended in a catastrophic decline (immediately by 5.4% or 2.32 dollars), which sent Brent to the level of 40.31 dollars per barrel. Also, the price of futures contracts for WTI light crude oil for delivery in August in electronic trading in New York fell by 0.76%, or 0.29 dollars, which sent it to the mark of 37.72 dollars per barrel. Yesterday's trading also showed its decline (by 5.9% or 2.36 dollars) and completed its trading day WTI in the region of 38.01 dollars per barrel. If we take into account all the news that the participants in the oil market are playing, it is more than likely that there will be a further negative correction in the cost of raw materials. This means that sales will continue. Today, investors' eyes will be focused on statistics on US economic growth. So, it is expected to publish data on the country's GDP. If the statistics turn out to be positive, the greenback will strengthen, and a new pressure factor will appear on the oil market. The material has been provided by InstaForex Company - www.instaforex.com |
| Stock market crisis matures: Europe, Asia, and America are declining Posted: 25 Jun 2020 06:15 AM PDT
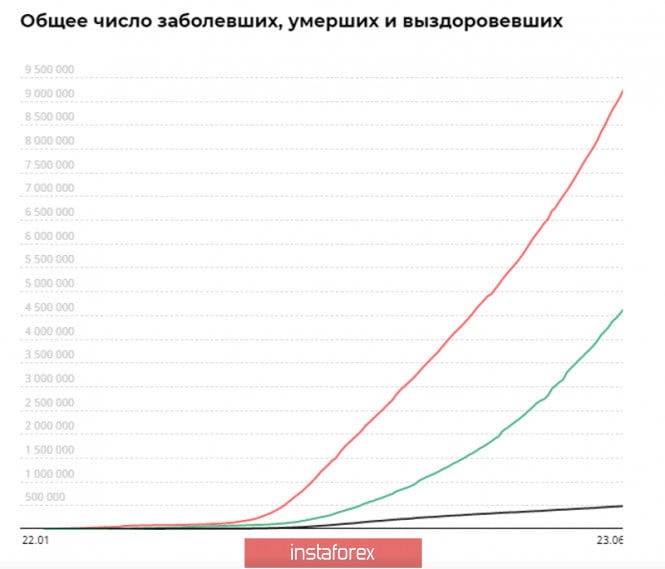
This morning, stock markets in the Asia-Pacific region declined due to the outbreaks of coronavirus infection, which continue to be recorded in the United States, China, and Latin America. Statistics on the number of newly infected cases are extremely disappointing. This makes investors think that a quick economic recovery is definitely not worth the wait. According to the World Health Organization, the number of new cases in the world has increased to 30% more in the last week alone. In some US states, authorities have begun to think about restoring restrictive quarantine measures that will help slow down the growth of infections, if not stop it. All this makes market participants suggest that the level of business activity will begin to decline again. This, of course, is an extremely disappointing fact, given the growing economic recovery. Another not-so-good news was the possible imposition of duties by the United States of America with respect to goods shipped from France, Germany, the United Kingdom, and Spain. The total value of the premiums can reach $ 3.1 billion. Some particularly categorical investors claim that this is the first stage of a trade war, which has just begun to unfold between the regions. Risks regarding the second wave of the pandemic and the possible introduction of duties seriously disturbed stock market participants, who hastened to reduce their positions, which was immediately reflected in the overall negative dynamics: risky assets were rapidly losing their popularity. Japan's Nikkei 225 index fell 1.2% this morning. The South Korean Kospi Index fell by 0.9%. Australia's S & P / ASX 200 Index fell more than the rest by 2.2%. Today is a holiday in China, so exchanges do not work. European stock markets are also experiencing their worst times. They are crushed by news about the increase in the number of coronavirus cases in the world and the possibility of a second wave of the pandemic, as well as news about future duties from America. According to the latest data, the IMF corrected the economic decline for the current year, reducing the already gloomy figures. So, the drop may not be 3%, as previously assumed, but all 4.9%. This means that the COVID-19 pandemic has led to even more negative consequences than expected. And a new wave may even become a disaster. The pace of recovery is likely to be slow. At least next year, growth may not occur by 5.8%, but only by 5.4%. Yesterday, the European Commission came up with a proposal for a new regional budget for the next fiscal year. According to adjusted data, it should amount to 166.7 billion euros, which will not be the final figure, since it will be supplemented by grants in the amount of 211 billion euros and loans in the amount of 133 billion euros. The general index of EU enterprises Stoxx Europe 600 fell 2.78% and was at the level of 357.17 points. The UK FTSE 100 index fell 3.11%. The German DAX Index by 3.43% and the France index by 2.92%. The indices of Italy and Spain are also in the negative at 3.42% and 3.27%, respectively. The stock market of the United States of America was negatively affected and declined. The main reasons for this were the ever-increasing possibility of a second wave of pandemic and the return of restrictive quarantine measures. So, the number of new patients in Florida on the second working day of the week jumped to a record number of 5,508 thousand people. Other states have begun to return a mandatory two-week quarantine for all arrivals, and it seems that these are not all restrictions that will have to be returned to in order to avoid serious consequences. Of course, this slows down the recovery of an already weak economy even more. In addition, the Head of the Federal Reserve of Chicago made a statement that in order to ensure sustainable economic growth, new stimulating monetary measures may be useful, especially considering the extremely low inflation in the state. Some positive was noted against the backdrop of news that trade relations between the US and China would not be broken, and the first stage of the transaction should be completed in full. The Dow Jones Industrial Average yesterday dropped by 719.16 points or 2.72%, at the close of the trading floor, and was at 25,445.94 points. The Standard & Poor's 500 Index fell 80.96 points or 2.59%, to a stop at 3,050.33 points. The Nasdaq Composite index fell by 2.19% or 222.2 points, which sent it to the area of 9 909.17 points. The material has been provided by InstaForex Company - www.instaforex.com |
| Global economic slump seems inevitable Posted: 25 Jun 2020 06:12 AM PDT
Two months ago, the IMF reported a 3% reduction in global GDP, but now it expects a decrease of 4.9% as the quarantine measures are still in force. COVID-19 has caused widespread and profounder damage to the global economy than expected. Moreover, the IMF believes that in 2021, there will be a new major outbreak of coronavirus, so the economic recovery may be weaker. Quarantine and social distancing have hit both investment and consumption, however, many countries are coming out of quarantine and the situation is improving. The IMF reported that developed economies were severely damaged. The US GDP is expected to shrink by 8.0% in 2020, and the eurozone economy may contract by 10.2%. In Latin America, the coronavirus cases continue to grow. So, 2020 could bring losses for Brazil, Mexico, and Argentina. GDP of these countries could fall by 9.1%, 10.5%, and 9.9% respectively. Perhaps only China is a country with growing GDP. Thanks to the work resumption and a small number of infected people China's GDP may rise by 1.0% in 2020. Nevertheless, the IMF noted that governments and central banks would help to repair the damage caused by the pandemic thus boosting the recovery. The material has been provided by InstaForex Company - www.instaforex.com |
| USD tends to rise amid fears of COVID-19 second wave Posted: 25 Jun 2020 05:58 AM PDT
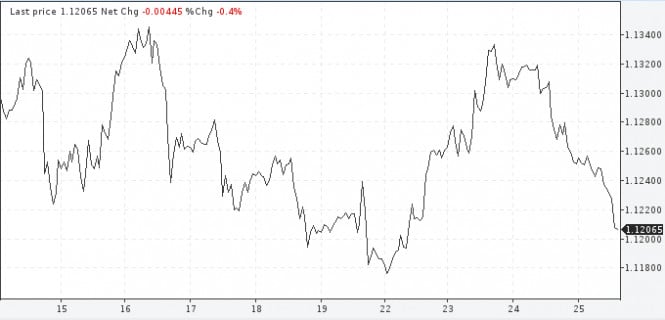
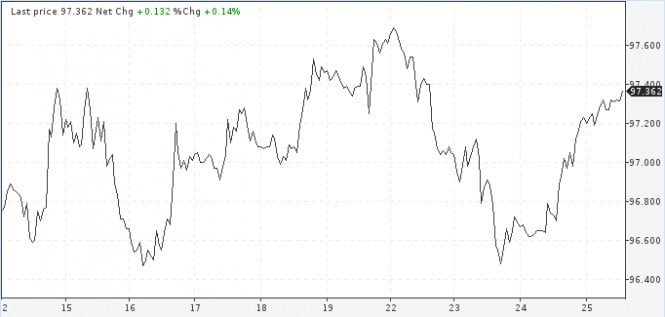
Although the surge in new coronavirus cases and fears over the pandemic affect the economic recovery, the US dollar is moving up. Experts at Danske Bank noted that it is necessary to monitor the number of hospitalizations because new restrictions are likely to be imposed. In addition to a spike in new infections, a problem of unemployment still exists. It is expected that this week the number of initial jobless claims will total 1.3 million, and the number of applications from those who continue to receive unemployment benefits will drop to 19.9 million. These numbers are already progressing, but US unemployment is still at its peak since the Second World War. These factors directly affect the value of the global currencies. Thus, the US dollar index was up by 0.2% to reach 97.293 against other major currencies. The euro fell against the greenback by 0.1% to 1.1239. The pound retreated against the US dollar by 0.1% to 1.2410. The American currency rose against the Japanese yen by 0.1% to 107.15 as well as the Canadian dollar by 0.1% to 1.3649. The Turkish lira is trading at 6.8587 against the US dollar, up by 0.1%, not too far from the all-time high of 7.27 reached in early May. The material has been provided by InstaForex Company - www.instaforex.com |
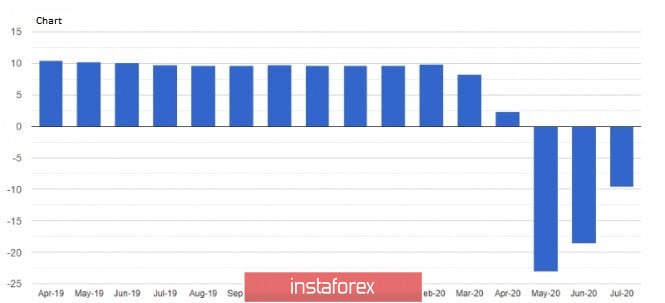
| Posted: 25 Jun 2020 05:56 AM PDT Demand for the US dollar continues to strengthen despite the statistics on Germany, which continues to please buyers of risky assets, which makes us think about a faster return to the life of the economy after the coronavirus pandemic in the Eurozone. However, at the moment, the US dollar is taking the lead, as fears of a new outbreak of coronavirus infections in the US are only increasing, and the trade conflict of the Trump administration with China and Europe is gaining new momentum. According to the Florida Department of Health, more than 5,000 cases of COVID-19 infection were reported in their state alone yesterday, the highest number ever recorded. In the state of Texas, the number of infected people exceeded 5,500, and in Oklahoma, experts identified 482 new cases of infection. In California, thanks to the earlier removal of isolation measures in quotation marks, a new record number of people were infected in a day. During the day, 7,149 cases of coronavirus infection were recorded in the state. As I noted above, today's data on consumer sentiment in Germany in July of this year is likely to continue to improve after the reduction of quarantine measures against the background of the coronavirus pandemic. Today, a report from the GfK research group was published, which indicated that the leading index of consumer confidence in Germany in July recovered and rose to -9.6 points against the June value of -18.6 points. Economists predicted that the indicator in July will be -15.0 points. Recent data have shown that Germany can well expect a V-shaped economic recovery after a fairly rapid opening of the economy and the resumption of public life. This was due to the timely introduction of quarantine measures and coordinated actions of the authorities. As for the sub-indices that are used in calculating the full index, overall expectations for the economy, income, and propensity to buy have also increased. The indicator of economic expectations rose to 8.5 points in June, returning to positive territory. Thanks to a large package of economic incentives and support for the population, the index of income expectations also increased, reaching 6.6 points in June. However, the negative factor affecting the index is the reduction of working hours and the increase in unemployment. A good increase was also observed in the indicator of propensity to buy, which jumped immediately to 19.4 points on the background of the removal of quarantine measures and measures of social distancing. If we talk about the German economy, today we also published data on the growth of German exporters' sentiment, which significantly improved in June this year. So, the index of expectations in the manufacturing sector according to the IFO Institute rose from -26.7 points in May to -2.3 points in June this year, which indicates the recovery of the German industry after the pandemic. A sharp jump is expected in the automotive and pharmaceutical industries. As for trade relations between the US, China, and the Eurozone, I spoke about this in detail in my morning review. In a nutshell, yesterday US President Donald Trump signed a memorandum on the introduction of new duties to protect the seafood trade. According to the US President, if the trade representative points out that China is not fulfilling its procurement obligations under the agreement on the first phase in relation to seafood, it will lead to the introduction of mirror repressive duties on seafood from China. The Eurozone also got it. It is already known that Washington is considering imposing additional duties on imports from France, Germany, Spain, and the United Kingdom. We are talking about an amount of 3.1 billion dollars. Such categories of goods as trucks, gin, and olives will be subject to duties. As for the technical picture of the EURUSD pair, the pressure on the euro remains quite high, and the morning breakout of the support of 1.1230 led to another sale of the euro, which I paid attention to. A break of the level of 1.1200 will open a direct path to the lows of the week in the area of 1.1170, which will indicate the resumption of the bear market formed on June 9 this year. To save the situation, buyers of risky assets will need to make a lot of efforts, since only the return of EURUSD to the level of 1.1230 will allow forming a new lower border of the ascending channel in continuation of the growth that we saw at the beginning of the week. The material has been provided by InstaForex Company - www.instaforex.com |
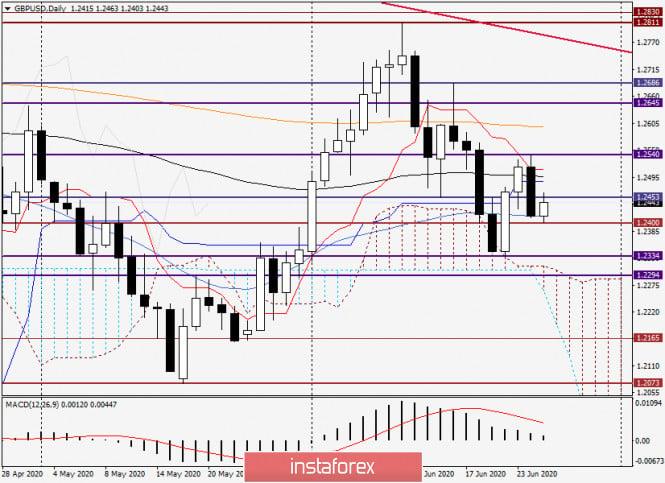
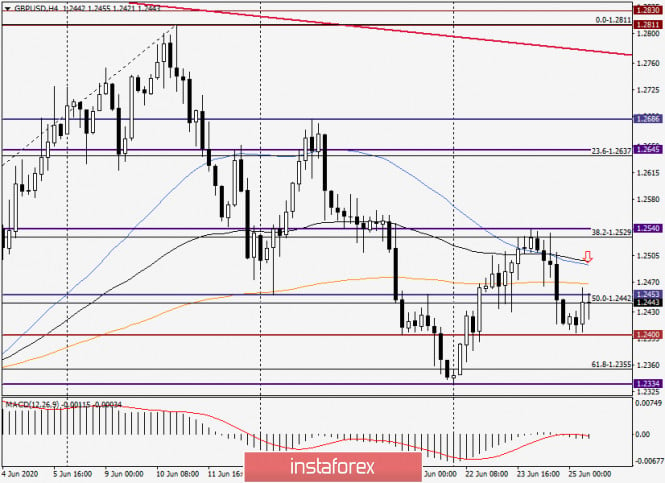
| Analysis and outlook for GBP/USD for June 25, 2020 Posted: 25 Jun 2020 05:33 AM PDT Hi fellow traders! Daily Yesterday, the pound sterling tried to assert strength against the US dollar, but these efforts were in vain. Having reached the strong technical level of 1.2540, GBP/USD reversed downwards and closed at 1.2416 on Wednesday. By the way, that level was picked as the nearest target in case the downward scenario comes true. As we see, a 50-period moving average is going through here that supported the pair, shielding it from a further decline. Today at the moment of writing this article, the currency pair has already tested the level of 1.2400 which showed resilience and gave impetus for a further growth. At the European trade opening, GBP/USD was extending gains trading at near 1.2452. Here comes the important thing for pound bulls. First, the pair failed to stay firmly above the technically and psychologically important level of 1.2500. Second, there is cluster of lines in the area of 1.2485-1.2510 such as the Kijun Line of the Ishimoku cloud indicator, an 89-period exponential moving average, and the Tenkan line. All the above-said lines make up powerful resistance which could be a challenging task to breach without meaningful drivers for market participants. As of now, GBP/USD is not able to break upwards the level of 1.2453. The door downwards will be open on condition of breaking the important and strong level of 1.2400. Another condition is that the price should trade firmly under that mark. In this case, the target level for bears will be 1.2334, the lowest point of June 22. H4 According to this timeframe, GBP/USD is trading below a 20-period, 50-period, and 89-period moving averages. Each of them is capable of resisting stubbornly any growth attempts. Trading tips for GBP/USD Bearing in mind the overall technical picture as well as the odds of the second COVID-19 wave, the US dollar has nice prospects for remaining a lucrative investment option. Another point is that economic data from the US has been improving lately. So, the basic recommendation is to open short positions on GBP/USD following minor correctional dips. The targets for short deals could be the following levels: 1.2460, 1.247, 1.2487, 1.2505, and perhaps 1.2525. Just in case market sentiment changes, the currency pair will be able to overcome sellers' resistance at 1.2540 with confidence. Thus, the bearish scenario will have to be revised or even cancelled. Once again, let me say again that long deals on GBP/USD pose a risk under the current market conditions. So, it would be better to stay away from opening long positions until clear signals emerge again. Good luck! The material has been provided by InstaForex Company - www.instaforex.com |
| Posted: 25 Jun 2020 04:42 AM PDT Investors could not ignore the risks of the second wave of the pandemic anymore, which calls into question the V-shaped economic recovery. The demand for the US currency has risen sharply, as market players now prefer a safe haven, avoiding investment in risky assets. On the side of the US currency, there is an increase in geopolitical tensions in the world. Washington is stepping up pressure on Beijing by constantly reproaching the start of the coronavirus pandemic in Wuhan. On Wednesday, the White House adviser on national security made an unpleasant rhetoric again against China, accusing China of stealing intellectual property, aggressive expansionism, and non-observance of human rights. According to the Americans, the Chinese use social networks for propaganda and misinformation. The US did not neglect the EU either. Market players were surprised that America plans to raise duties on European goods worth $ 3.1 billion. The eurozone has recently published encouraging data on the economy, which, apparently, does not like Donald Trump. After the release of the IFO business climate index, which rose in June to 86.2 points from 79.7. Robert Lighthizer said that the States could introduce duties on goods from Germany, France and Britain. This is a bad signal for the euro, which has soared this week. At the moment, he has practically lost all his gain. However, support for the European currency may have a rally in the gold market. Thus, it will be possible again to count on a test mark of $ 1.13. EUR / USD The mood of the market worsened and are unlikely to recover before the end of the week. This means that the dollar "bulls" have the opportunity to take the initiative in their own hands. The dollar index is growing for the second day in a row, its growth was 0.2% this afternoon. The most powerful movements are expected in the evening. Traders took a wait-and-see attitude before the release of macroeconomic data in the USA. Today, they evaluate annual GDP data, reports on applications for unemployment benefits and orders for durable goods. Positive statistics may force dollar buyers to push the dollar even higher. USDX A strong and long-term strengthening of the dollar is still not worth counting on. The Interbank lending market in New York and London continues to show a downward trend in rates on dollar loans. The Federal reserve has not held REPO auctions in the past four days because there are no requests from commercial banks. Bankers have large reserves of dollar liquidity, which plays against the US currency. The material has been provided by InstaForex Company - www.instaforex.com |
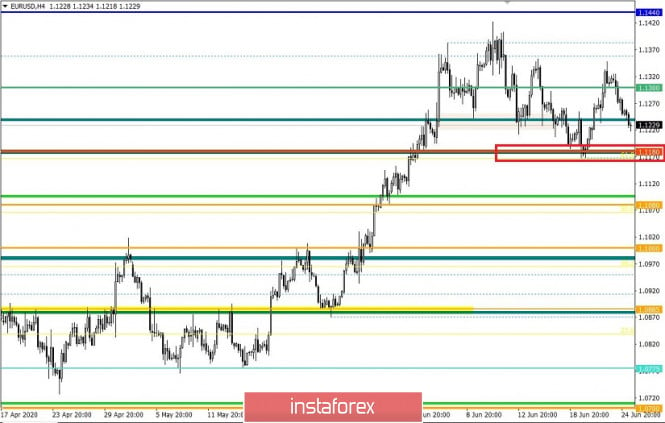
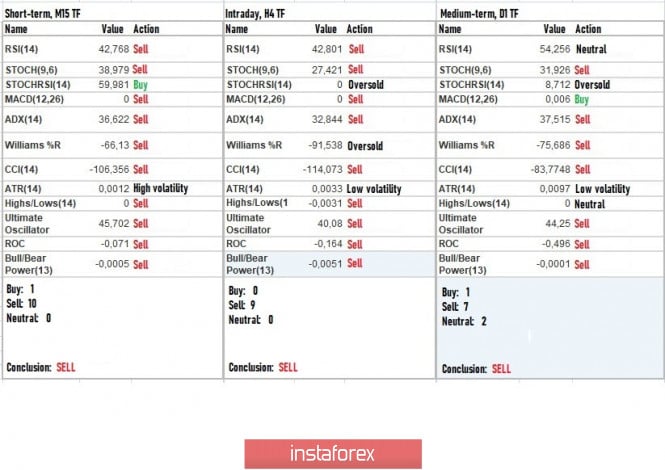
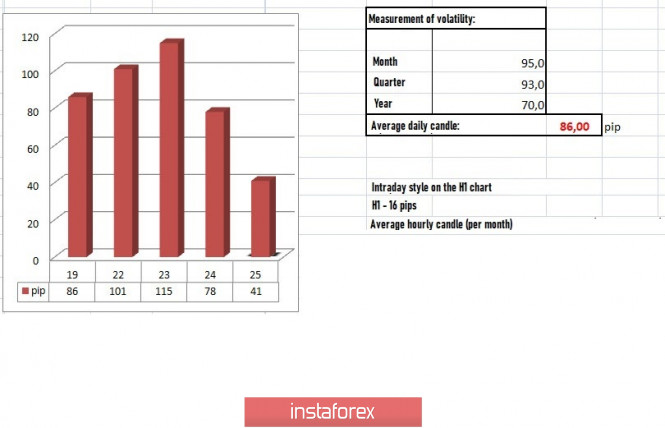
| Trading recommendations for the EUR/USD pair on June 25, 2020. Posted: 25 Jun 2020 04:36 AM PDT From the point of view of complex analysis, we can see the reversal of quotes which led to a recovery of more than half relative to the correction. The past trading day was expressed in a downward course, in which during the time spent at a standstill between the values 1.1300 and 1.1350, a sufficient number of short positions were accumulated, which led to a recovery relative to the earlier correction. More than half of the movement was covered, which means that there is not much left before the quotes reach 1.1180, which encouraged the bears since the chance to reach the values 1.1080 and 1.1000 is near. As you might guess, the theory of price development implies a downward move that will return the quote to the region of April of this year. True, there is one snag in this, the market still has a high speculative operation rate, which means there is no escape from chaotic leaps. That is why, in our strategy, the key role is played by local operations, which are ready to take on speculative excitement and convert it into profit. Analyzing the past trading day in detail, we can see that the round of short positions arose during the start of the European session and lasted until the end of the trading day. Interestingly, movement in terms of strengthening in the US dollar was seen everywhere in the market. With regards to volatility, a value of 78 points was recorded, which is 9% lower than the average daily value. Nevertheless, the slowdown did not affect the overall dynamics of the currency. As discussed in the previous review, traders focused on the area of 1.1280 / 1.1305, in which at the time of making trading decisions, a sufficient number of speculators took on short positions. Looking at the daily chart, we can see that many market participants want a repeat of the fluctuation observed in March this year, during which the quotes stopped in the area of interaction of the trading forces 1.1440 / 1.1500. However, a repetition of such an intense movement cannot occur, as the situation and external factors now are not the same as before. Nevertheless, a gradual recovery may occur, which will contain adjacent movements. As for the news published yesterday, the market focused on speculative background, as noteworthy statistics did not come out from Europe and the United States. Recent forecasts on the recovery of the US economy are pessimistic, and Chicago Fed President Charles Evans said that the economy will return to normal by the end of this year, but will not recover to pre-crisis levels. "While I hope for a rapid economic recovery, I expect that a large-scale recovery will take some time. My forecast suggests that growth will be hindered by periodic local outbreaks, and lifting quarantine restrictions may harm us, "Evans said. Eric Rosengren, President of Boston Fed, also made a similar forecast the other day. Other members of the committee adhere to this position. Today, data on the US GDP for the first quarter will be published, where, according to forecasts, a decline of 5.0% is expected. Data on orders for durable goods will also come out, which expects an increase of 8.5%. The upcoming weekly report on the US labor market, meanwhile, expects a sluggish recovery in the index, in which the number of initial applications for unemployment benefits is expected to amount from 1,508,000 to 1,380,000, while the number of repeated applications should decrease from 20,544,000 to 20,100,000. Further development Analyzing the current trading chart, we can see that the bearish mood persists in the market, which updated the variable pivot points. The quotes will eventually return to the level where the correction began (1.1180), after which it will become clear how large is the scale of the downward sentiment in the market, since the prospect of a decline is not limited to the level of 1.1180. Nevertheless, the target is still local operations, so work from the current candles. The bearish mood will eventually lead the quotes to the level of 1.1180, in which there will be slowdowns and a possible rollback. Subsequent short operations will occur after the quotes consolidate below 1.1165. Based on the information above, we present these trading recommendations: - Buy positions if the quotes rebound from the level of 1.1180. - If you do not have sell positions yet, enter the market below 1.1210, in the direction of 1.1180. Indicator analysis Analyzing the different sectors of time frames (TF), we can see that almost all the indicators of technical tools signal sell due to the recovery of quotes by more than half at the correction. Volatility per week / Measurement of volatility: Month; Quarter Year The measurement of volatility reflects the average daily fluctuation calculated by Month / Quarter / Year. (June 25 was built, taking into account the time of publication of the article) The volatility of the current time is 41 points, which is 52% lower than the average daily value. It is assumed that the upcoming news as well as speculative sentiment will set a new round of growth in volatility. Key levels Resistance Zones: 1.1300; 1.1440 / 1.1500; 1.1650 *; 1.1720 **; 1.1850 **; 1,2100 Support Areas: 1,1180; 1.1080 **; 1,1000 ***; 1.0850 **; 1.0775 *; 1.0650 (1.0636); 1,0500 ***; 1.0350 **; 1,0000 ***. * Periodic level ** Range Level *** Psychological level The material has been provided by InstaForex Company - www.instaforex.com |
| Posted: 25 Jun 2020 04:12 AM PDT Corona virus summary:
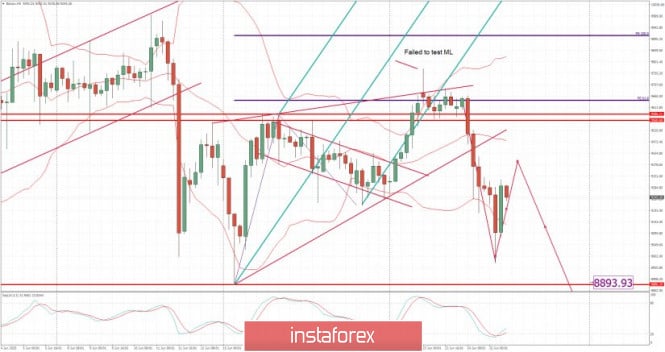
Israel is experiencing an alarming surge in new coronavirus cases which has prompted the government to approve reimposing a controversial tracking system administered by the country's domestic security agency, the Shin Bet. Cases in the country have rocketed again after Israel eased restrictions at the end of May, a move that coincided with the Shavuot holiday and saw crowded beaches on both the Mediterranean and around the Sea of Galilee. Technical analysis: BTC has been trading downwards. As I expected, the price tested the level of $8,990 and almost met our main target at $8,890. Anyway, I still see downside movement due to strong downside momentum in the background. The target is set at $8,890. Trading recommendation: Resistance is set at $9,315 The material has been provided by InstaForex Company - www.instaforex.com |
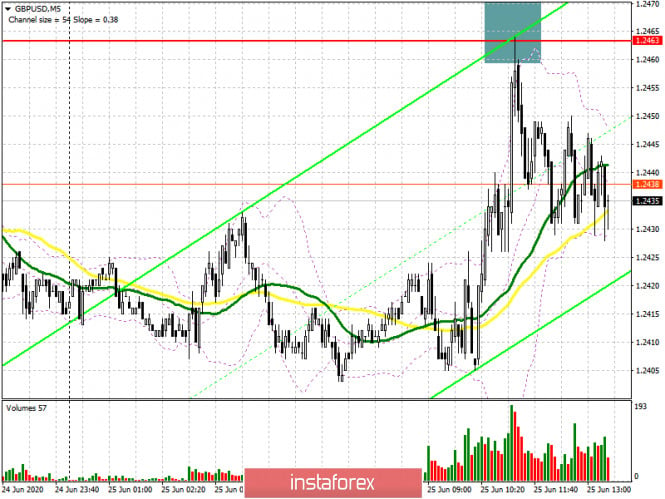
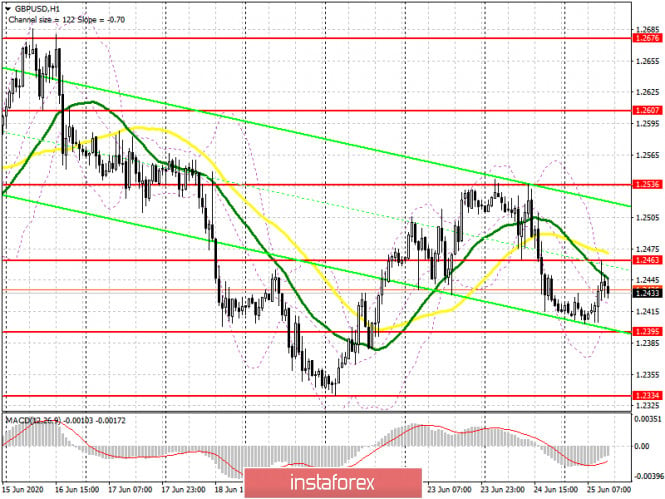
| GBP/USD: plan for the American session on June 25 Posted: 25 Jun 2020 04:06 AM PDT To open long positions on GBPUSD, you need: From a technical point of view, nothing changed in the first half of the day, except that the bears formed a sell signal for the pound, which I spoke about in my morning forecast. If you look at the 5-minute chart, you will see how sellers are approaching the resistance of 1.2463, the test of which forms a sell signal and begins a rapid decline in the pound. However, it is not quite correct to say that the bears have regained control of the market since trading remains on a side channel. In the case of a repeated test of the resistance of 1.2463, its breakdown may take place in the second half of the day, however, I recommend opening long positions from there only after fixing above this level, in the expectation of updating the highs of 1.2536 and 1.2607, where I recommend fixing the profits. Also, buyers need to protect the support of 1.2395, where only the formation of a false breakout will be a signal to open long positions in the expectation of a return to the resistance of 1.2463, where the moving averages pass. In the first half of the day, the pair did not reach the level of 1.2395. If there is no activity in the support area of 1.2395, it is best to abandon long positions before updating the minimum of 1.2334 and buy the pound there for a rebound in the expectation of correction of 30-40 points within the day. Also, do not forget about the interest of major players.
To open short positions on GBPUSD, you need: The bears achieved their goal and actively returned to the market after updating the resistance at 1.2463. However, this only led to a downward movement of 35 points, after which the pressure on the pound eased, which threatened to take sellers out of the market if they returned to the range of 1.2463 again. It is best to sell from this level in the afternoon only after the formation of a false breakdown. However, as long as the trade is below 1.2463, it is correct to count on updating the support of 1.2395, which is the first target of the bears for today. Its breakdown will take place only in the case of good data on the US economy, as data on retail sales and the Bank of England's minutes did not put pressure on the British pound in the first half of the day. A breakout of 1.2395 will open a direct path to the minimum of 1.2334, where I recommend fixing the profits. If the bulls are stronger and break above the level of 1.2463, it is best to postpone short positions until the major resistance is updated at 1.2536 and sell the pound from there for a rebound in the expectation of correction of 30-40 points within the day.
Signals of indicators: Moving averages Trading is conducted below the 30 and 50 daily averages, which act as a resistance for buyers. Note: The period and prices of moving averages are considered by the author on the hourly chart H1 and differ from the general definition of the classic daily moving averages on the daily chart D1. Bollinger Bands Only a break in the upper limit of the indicator around 1.2460 will strengthen the demand for the pound. A break in the lower border of the indicator at 1.2395 will lead to another wave of decline in the pair. Description of indicators
|
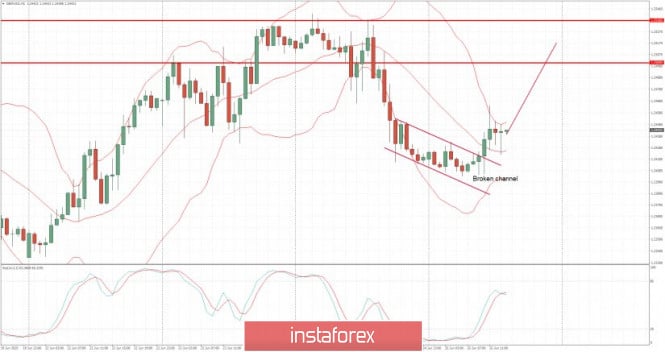
| GBP/USD analysis for June 25, 2020 - Further bigger rally in the play towards the 1.2500 Posted: 25 Jun 2020 04:06 AM PDT Corona virus summary: The world faces a shortage of oxygen concentrators as coronavirus infections climb by about 1 million per week – and look set to reach 10 million by the end of this week, the World Health Organization head said on Wednesday. "Many countries are now experiencing difficulties obtaining oxygen concentrators," WHO Director General Tedros Adhanom Ghebreyesus told a news conference. "Demand is currently outstripping supply." Technical analysis: GBP has been trading downwards in the background towards the 1,2400 but I found strong rejection and broken channel, which are signs for the further rally. I see GBP higher with potential targets at 1,2500-1,2550. Trading recommendation: Watch for potential buying opportunities on thte pullbacks watching the intraday frames like 15/30 minutes for better entry timing. Upward target is set at the price of 1,2500-1,2550. Support level is found at 1,2400 The material has been provided by InstaForex Company - www.instaforex.com |
| You are subscribed to email updates from Forex analysis review. To stop receiving these emails, you may unsubscribe now. | Email delivery powered by Google |
| Google, 1600 Amphitheatre Parkway, Mountain View, CA 94043, United States | |








No comments:
Post a Comment