Forex analysis review |
- Forecast for EUR/USD on June 30, 2020
- Forecast for AUD/USD on June 30, 2020
- Forecast for USD/JPY on June 30, 2020
- AUDJPY facing bearish pressure, potential for further drop!
- USDCAD bounce in progress towards descending trendline resistance!
- Hot forecast and trading signals for the GBP/USD pair on June 30. COT report. Boris Johnson pulled down the pound. Decline
- Hot forecast and trading signals for the EUR/USD pair on June 30. COT report. Buyers made an unsuccessful attempt to break
- Overview of the EUR/USD pair. June 30. The "swing" continues. Coronavirus is back in focus. Markets fear not a second wave
- Short-term technical analysis of EURUSD for June 29, 2020.
- Short-term technical analysis of Gold for June 29, 2020.
- Comprehensive analysis of movement options for commodity currencies AUD/USD, USD/CAD, and NZD/USD (H4) on June 30, 2020
- Major economic events to form US dollar's trajectory this week
- June 29, 2020 : GBP/USD Intraday technical analysis and trade recommendations.
- June 29, 2020 : EUR/USD Intraday technical analysis and trade recommendations.
- GBP comes under pressure
- Evening review on EURUSD for June 29, 2020
- EUR/USD: Germany's economy inspires bulls, but main challenge awaits ahead
- EUR / USD at crossroads: between hopes for global recovery and fears of pandemic
- Oil prices dropped as scares of second wave of virus arise
- Stock markets rushed down
- Chinese shares losing value
- BTC analysis for June 29,.2020 - Sellers in control and potentia for drop towards the $8.200
- Commodities: outlook for second half of 2020 remains troubling
- EUR/USD analysis for June 29 2020 -Both upward targets has been reached at 1.1280. Strong upward trend and potential for
- GBP/USD: plan for the American session on June 29
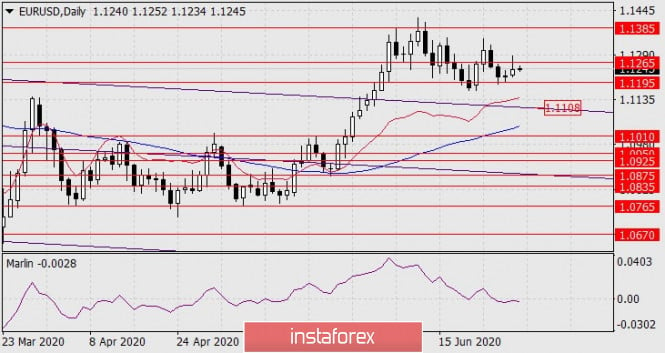
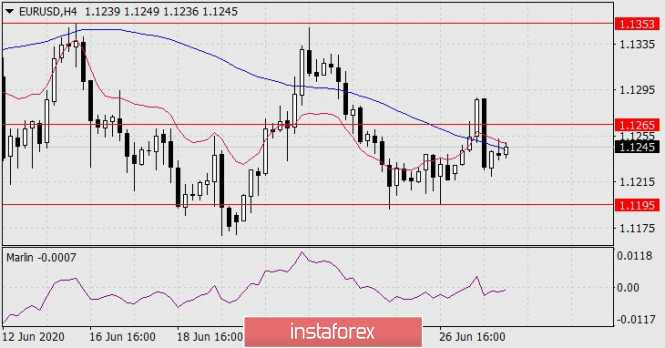
| Forecast for EUR/USD on June 30, 2020 Posted: 29 Jun 2020 07:57 PM PDT EUR/USD The euro tried to break the technical level of 1.1265 on Monday, due to news of closures of organizations in California as a result of the second wave of the viral epidemic. But in general, the markets were not going to panic, the technical resistance was stable, and the euro showed a daily growth of 23 points. The Marlin oscillator continues to decline in the negative area, the downward trend and the previous target of 1.1108 along the price channel of the weekly scale remain. The price returned to the area under the MACD line (blue indicator) on the four-hour chart, the signal line of the Marlin oscillator also returned to a downward trend. The first goal of the euro is 1.1195, it is also the signal level for moving to the main goal of 1.1108. |
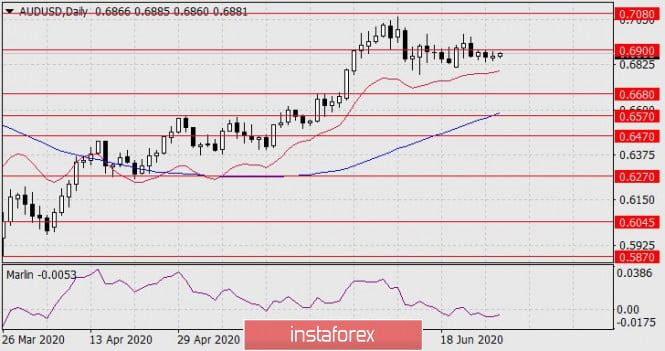
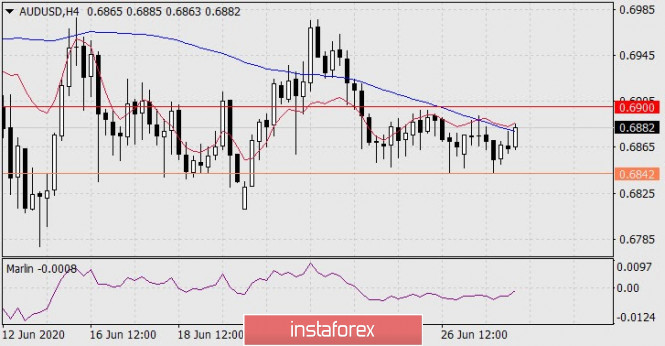
| Forecast for AUD/USD on June 30, 2020 Posted: 29 Jun 2020 07:54 PM PDT AUD/USD The Australian dollar showed little volatility yesterday, continuing to consolidate at 0.6900. The technical situation has not changed, the target at 0.6680 for the March 9 high remains. The previous day's price did not go beyond the MACD line on the four-hour chart, the Marlin oscillator is slightly growing, but does not leave the decreasing trend zone. Consolidating the price under the signal level 0.6842 paves the way for the Australian currency to the specified target of 0.6680. |
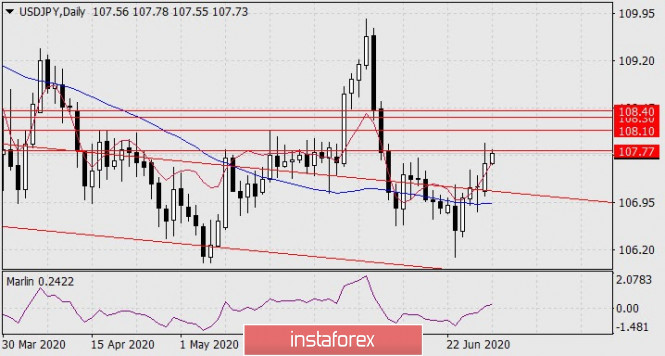
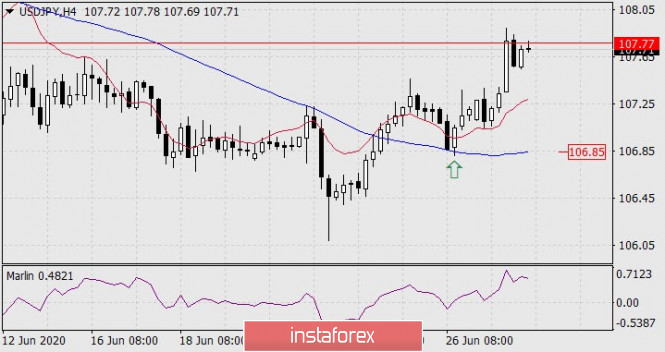
| Forecast for USD/JPY on June 30, 2020 Posted: 29 Jun 2020 07:48 PM PDT USD/JPY The yen enthusiastically reacted to the growth of European and US stock indices on Monday, although it ended lower in Asian markets. The Nikkei 225 lost 2.29% yesterday, but with the S&P 500 up 1.47% today, the Japanese index rose 1.77%. The price reached the first target level of 107.77. The Marlin oscillator has moved into the growing trend zone, the price has the opportunity to develop growth first to 108.10, then afterwards, to the target range of 108.30/40. The four-hour chart shows that the price reversal from the MACD line turned out to be very effective. The trend is upward in both charts under review, we are waiting for the price to grow to the first target of 108.10 (May 19 high). |
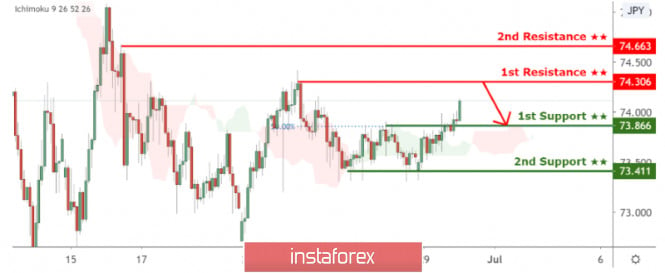
| AUDJPY facing bearish pressure, potential for further drop! Posted: 29 Jun 2020 07:15 PM PDT
Trading Recommendation Entry: 74.31 Reason for Entry: Horizontal swing high resistance Take Profit :73.87 Reason for Take Profit: 50 fib retracement Stop Loss:74.66 Reason for Stop loss: Horizontal swing high resistance The material has been provided by InstaForex Company - www.instaforex.com |
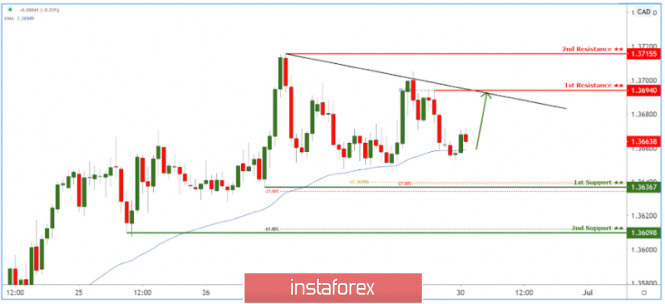
| USDCAD bounce in progress towards descending trendline resistance! Posted: 29 Jun 2020 07:08 PM PDT
Trading Recommendation Entry: 1.36588 Reason for Entry: Moving average support Take Profit: 1.36970 Reason for Take Profit: 78.6% Fibonacci retracement, descending trendline resistance. Stop Loss: 1.36367 Reason for Stop Loss: -27.2% Fibonacci retracement, 100% Fibonacci extension The material has been provided by InstaForex Company - www.instaforex.com |
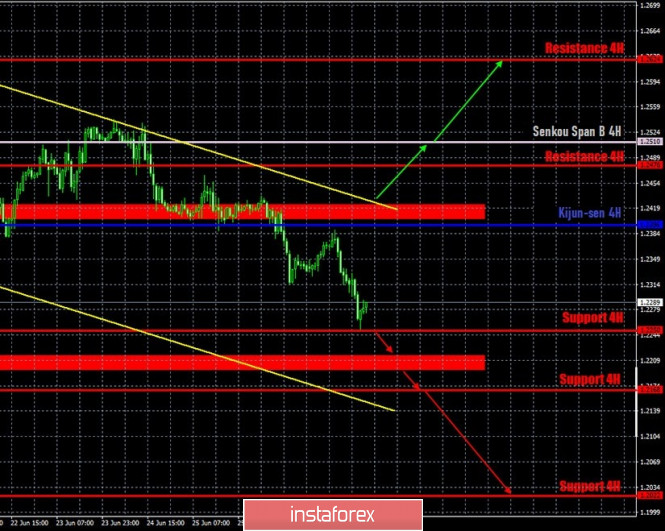
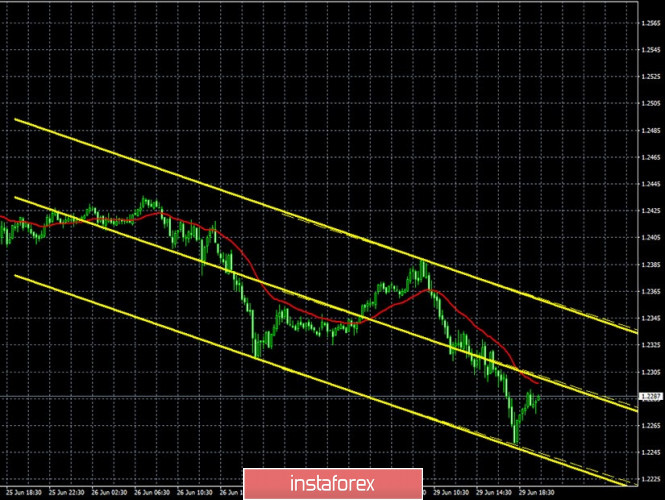
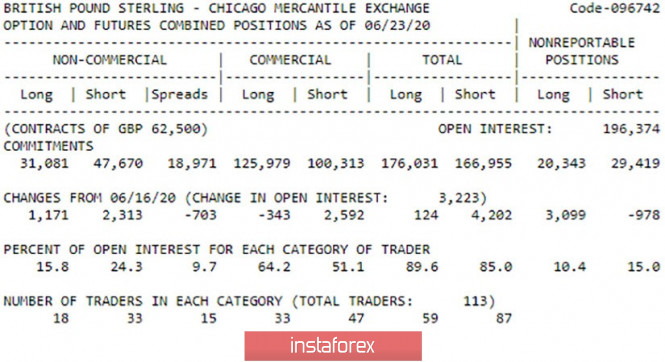
| Posted: 29 Jun 2020 06:09 PM PDT GBP/USD 1H The GBP/USD currency pair, unlike the EUR/US, simply continued its downward movement and worked out the first support level of 1.2250 on Monday. Thus, the bears continue to use any chance in order to continue to get rid of the British currency. The descending channel clearly shows the current trend and as long as the quotes do not get out of it, buyers will remain in the shadows. However, the British currency's next fall is not surprising, given the general fundamental background. However, more on that below, and in this section we can only say that there are several important supports below the pound/dollar pair, which could be difficult for bears to overcome. GBP/USD 15M Both linear regression channels continue to be downward on the 15-minute timeframe, so the overall trend remains downward in the short term. Quotes of the pair are also located below the moving average line, so for the time being we are not even talking about an upward correction in the short term. COT Report The latest COT report, which covers dates June 17-23, shows minimal changes. A group of professional traders were extremely inactive in the indicated period of time and only opened 3,500 new transactions. Of these, 1,200 for purchase and 2,300 for sale. At the same time, the group of hedgers were even less active and closed 343 contracts for the purchase and opened 2,500 contracts for the sale. This is very small. However, this was enough for the pound to resume its decline. This happened after June 23, a time period that is not covered by the latest COT report. Thus, no conclusions can be drawn from the latest report. The mood of traders has not changed, and the total number of open positions opened by a group of professional traders remains with an advantage in short positions. Despite the rather low activity of professional traders, the British currency will have a tendency to decline further. The fundamental background for the GBP/USD pair was negative again on Tuesday. The head of the Bank of England Andrew Bailey is set to give a speech on this day. However, traders were not interested in his speech. On the same day, British Prime Minister Boris Johnson made a speech, saying the following: "This (coronavirus crisis) was a disaster. Let's not downplay our words, I mean, it was an absolute nightmare for the country, and the country experienced a deep shock." After these words, the British pound resumed its decline, as traders quite reasonably interpreted Johnson's words in a negative context. Obviously, the British economy, which had problems even before the coronavirus crisis due to Brexit, experienced a real shock thanks to the pandemic and quarantine. Accordingly, recovery can be much more difficult and longer than in Europe or the United States. The UK is set to publish GDP for the first quarter on Wednesday, June 30, which, according to forecasts, could lose only 1.6% in annual terms and 2.0% in quarterly terms. These figures are much smaller than in America or the European Union, however, they are unlikely to support the British currency. There are two main scenarios as of June 30: 1) Since the support area of 1.2403-1.2423 was passed, the downward movement resumed. The trend remains downward, however, a price rebound from the first target of 1.2250 triggered a round of corrective movement. Thus, traders need to wait for it to end and only after that should they resume selling the pair with goals 1.2168 and 1.2022. Potential Take Profit in this case will be from 130 to 260 points. 2) Buyers need to wait until the price consolidates above the Kijun-sen line and above the downward channel, which will give them a chance to resume moving upward with targets at resistance levels 1.2478 and 1.2624. Potential Take Profit in this case will be from 40 to 190 points. The material has been provided by InstaForex Company - www.instaforex.com |
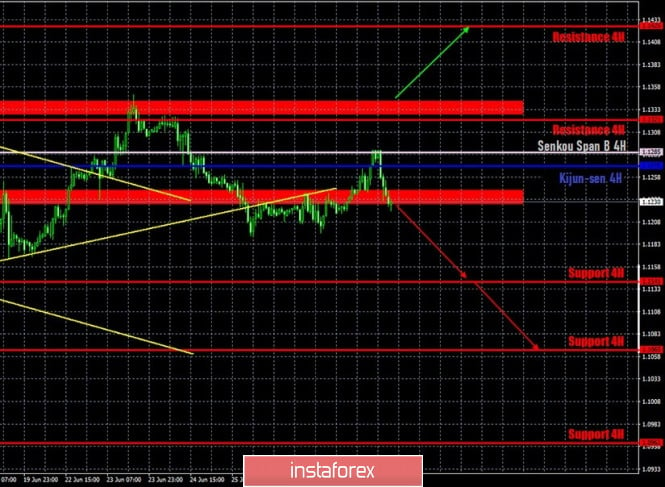
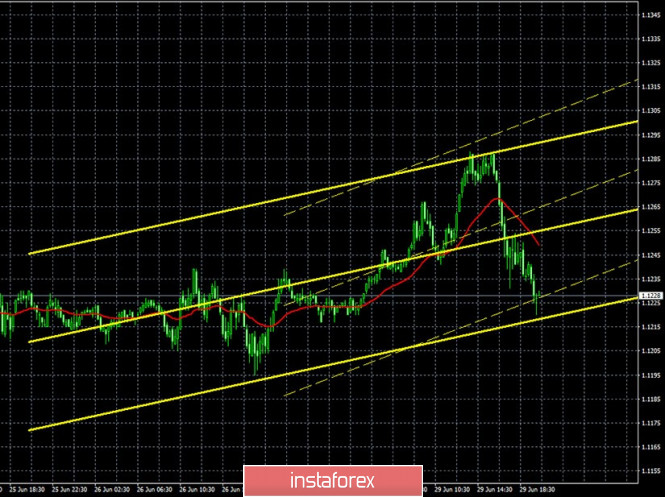
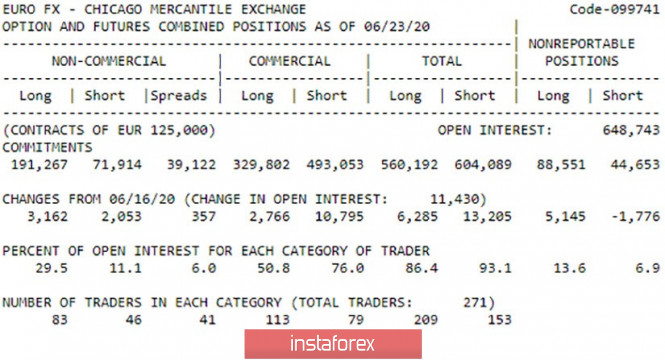
| Posted: 29 Jun 2020 06:09 PM PDT EURUSD 1H The EUR/USD pair was traded in different directions on the hourly timeframe on June 29, while perfectly working out the key lines and levels. The Senkou Span B and Kijun-sen lines were worked out, from which a rebound followed with the resumption of the downward movement. Thus, the bears dominate the market after formally overcoming the ascending trend line, but at the same time they clearly do not have enough strength for new sales of the pair. Perhaps they will be given an impetus by a rebound from the Senkou Span B line and overcoming the support area of 1.1227-1.1242. In general, the pair has made two important rebounds over the past few days, from the resistance area of 1.1327-1.1342 and the Senkou Span B line. Thus, buyers continue to stay out of the market and can not even play against weak bears on equal terms at this time. EUR/USD 15M Both linear regression channels turned up on the 15-minute timeframe, signaling an upward trend in the short term. But traders managed to gain a foothold below the moving average line and fall to the lower lines of both channels by the end of Monday, so it is possible to resume the downward movement. COT Report The new COT report, which was released last Friday, as we expected, showed no major changes. The pair has been trading in different directions for the last ten days, and there is no pronounced trend. The trend seems to be downward, but sellers do not have a clear advantage. The most interesting group of professional traders for us, which includes various organizations that enter the foreign exchange market in order to make a profit, only opened 3,000 transactions for the purchase and 2,000 transactions for the sale in the reporting week, which is very small. A group of hedgers were more active, but it did not drive the market. The total number of transactions increased by almost 20,000, short positions had an advantage. However, in general, we can call this report boring and uninformative. The mood of major players remained virtually unchanged over the reporting week. Recent trading days that are not included in the latest COT report do not add any clarity, since the pair continues to trade in different directions. The general fundamental background for the EUR/USD pair was practically absent on Monday. We do not even analyze the report on inflation in Germany, which, from our point of view, did not matter to traders. In recent months, market participants with pleasure and ease have ignored much more significant data, continuing to trade the pair for their own reasons, which often do not coincide with the fundamental background. Moreover, more and more attention has recently been paid to the epidemic rather than to economic factors. Experts seriously fear that the whole world will be overwhelmed by a new wave of pandemics, which will have to introduce a new total quarantine. And even if the quarantine is not as strict as the first one, there will still be certain restrictions that will at best slow down the recovery of the economy, and at worst contribute to its new decline. First of all, this now concerns the United States, where the lockdown did not bring any results. Isolated by someone or something, Anthony Fauci finally went on the air, saying only that the current numbers of infected people in the United States are frightening. However, few people listened to Fauci when the virus was just beginning to take over America. Now, it is unlikely that the White House will go to a new total quarantine because of fears that China will take away the world's leadership and strengthen its influence on other countries, while the United States is mired in a crisis and epidemic. Well, don't forget about the presidential election. A new lockdown, a new fall in the economy can finish off Donald Trump's chances of re-election. Based on the foregoing, we have two trading ideas for June 30: 1) The bears seemed to have overcome the upward trend line, but failed to extract anything for themselves from this signal. Thus, sales orders with the support levels of 1.1141 and 1.1065 remain relevant until the quotes remain below two key lines, Senkou Span B and Kijun-sen. However, it is worth remembering that now there is a high probability of a flat. Potential Take Profit range from 80 to 150 points. 2) Buyers can still return to the market, but have too many barriers to form new upward trend. Therefore, we advise you to wait until the 1.1327-1.1342 area has been overcome before buying the EUR/USD pair with a target at the resistance level of 1.1425. Potential Take Profit in this case is about 75 points. The material has been provided by InstaForex Company - www.instaforex.com |
| Posted: 29 Jun 2020 05:45 PM PDT 4-hour timeframe
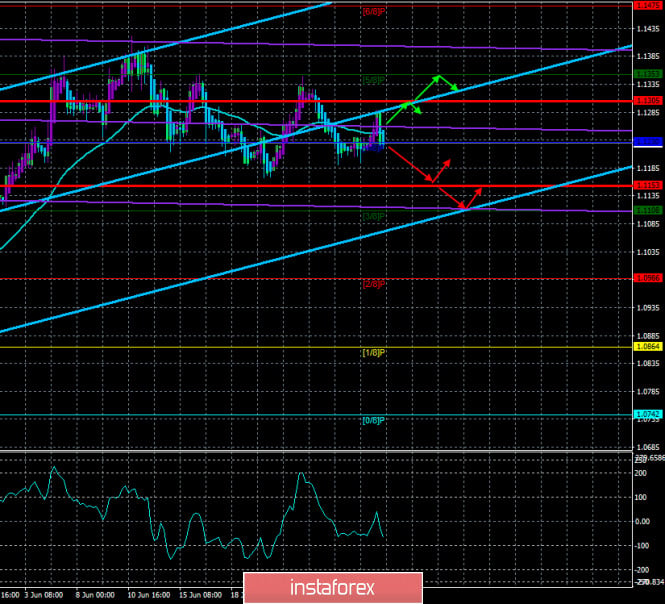
Technical details: Higher linear regression channel: direction - upward. Lower linear regression channel: direction - sideways. Moving average (20; smoothed) - sideways. CCI: -63.5571 Well, if a few days ago we doubted that the euro/dollar pair could go into a sideways movement since there were a sufficient number of technical factors that speak in favor of the beginning of a new downward trend, now we can say with confidence that the euro/dollar quotes are trading in a side channel. During the past day, the pair again failed to continue the downward movement, so a new upward turn was made and a new round of upward movement was started with a new overcoming of the moving average line, which ended very quickly. At the same time, the prospects for the European currency remain very vague, since no positive news is coming from Europe right now. However, the situation in America now can not be interpreted as "positive". The fact is that in recent weeks, the problem of the "coronavirus epidemic" has again become acute across the ocean. At least, this is what most analysts and representatives of the healthcare sector believe. However, we believe that the first wave was not completed in the United States either. Just in contrast to the more conscious countries that were not in a hurry to remove quarantine measures, and more far-sighted rulers who think not only about the upcoming elections and political ratings, there was no decline in the growth rate of the virus in America. This is why the United States remains in first place in the world in terms of the number of diseases. This is not about the number of tests performed or the size of the country's population. And the country probably does not need to say what the repeated "lockdown" threatens. On the first trading day of the week, there were no important reports or events in Europe or the United States. In Germany, the consumer price index for June was published, which was better than the forecast values and amounted to 0.9% y/y. However, this is not surprising, since the European economy has begun to recover, and Europe has managed to stop the spread of infection with the help of strict quarantine measures. Even in the most infected countries, such as Italy and Spain, the daily increase in new cases is minimal. Therefore, it is the European economy that can now fully embark on the path of recovery, although Christine Lagarde expects it to shrink by almost 9% by the end of 2020, while in America they expect a fall of 5-6%. However, its future will still depend on the results of the fight against "coronavirus" infection. If the second wave of the disease begins in Europe, then the growth of the European GDP will be slowed down. At the same time, after a long break, the chief epidemiologist of the United States Anthony Fauci went on the air, who said that the situation with the"coronavirus" in the United States is beginning to become very serious. Anti-records for the number of new cases are updated daily in the United States. However, many health officials believe that the actual number of infected people in the United States is much higher than the official number. In general, all this situation does not add optimism to buyers of the US currency. So far, the dollar is not under pronounced pressure, but in the future, if COVID-2019 continues to spread across the US at the same pace, it will affect the US economy. Accordingly, the country's macroeconomic indicators may continue to decline instead of recovering. Meanwhile, Donald Trump just can't live a day without a scandal. On June 28, Donald Trump posted a video of one of his supporters on his Twitter page, which clearly shows a white man shouting the phrase "White Power" several times. The fact that the American President deliberately retweeted this video to his page means that he approves of what is happening in the video. Naturally, a new racist scandal immediately unfolded on the network, and the video was deleted a few hours later. The White House immediately made it clear that Donald Trump did not notice any racist chants and does not support them. However, most Americans who do not encourage Trump's policies immediately concluded that the president has racist tendencies. To be honest, we continue to believe that Trump is doing everything possible not to be re-elected in November 2020... On the second trading day of the week, the European Union is scheduled to publish the consumer price index for June in a preliminary value. It is expected that the main indicator in annual terms will be 0.1%, while the base indicator (excluding food and energy prices) may be 0.8% y/y, continuing to slow down. However, much more important and significant events are planned for the second half of the day, when the US will host speeches by the head of the Federal Reserve Jerome Powell and Treasury Secretary Steven Mnuchin. Naturally, it is not known what the two main financiers of the country will say, but these are potentially two very important speeches. We continue to hold our opinion that in the current conditions, Mnuchin and Powell simply can't tell the markets anything but negative. For sure, both economists will touch on the topic of a new package of financing for the US economy, as well as the topic of "coronavirus", which can lead to a new downturn in the economy. If their speech is overly "dovish", the US dollar may continue its decline, which began at the beginning of the new trading week. Also scheduled for the US trading session is a speech by ECB Vice-President Luis de Guindos, who, in turn, can share prospects and forecasts related to the European economy.
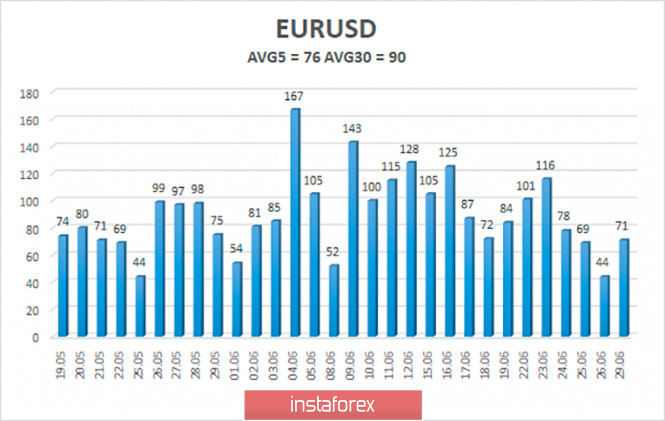
The average volatility of the euro/dollar currency pair as of June 30 is 76 points and is characterized as "average", but in general, the volatility continues to decrease. We expect the pair to move today between the levels of 1.1153 and 1.1305. A new turn of the Heiken Ashi indicator upward will signal a new round of upward movement, possibly within the side channel. Nearest support levels: S1 – 1.1230 S2 – 1.1108 S3 – 1.0986 Nearest resistance levels: R1 – 1.1353 R2 – 1.1475 R3 – 1.1597 Trading recommendations: The euro/dollar pair managed to change the direction of a movement twice over the past day and finally settled again below the moving average line. Thus, at this time, short positions with the goals of 1.1153 and 1.1108 are relevant, which it is recommended to keep open until the MACD indicator turns up. At the same time, there is a probability of a price rebound from the level of 1.1170 – the previous local minimum. It is recommended to return to buying the pair not before fixing the price above the moving average with the goals of 1.1305 and 1.1353, but these goals are very close, and the probability of a flat is high. The material has been provided by InstaForex Company - www.instaforex.com |
| Short-term technical analysis of EURUSD for June 29, 2020. Posted: 29 Jun 2020 12:25 PM PDT EURUSD started trading this new week where it left us on Friday. No real direction today as price makes no progress. Short-term trend remains unclear as long as price is trading above 1.12 and below 1.13.
Red line - resistance Green line - support EURUSD remains stable on Monday with volatility at its lowest. Price is trapped between 1.12 and 1.13 with no clear direction. If support at 1.12 fails to hold we expect price to move towards 1.1080-1.11 support area. If resistance at 1.13 breaks, then we should expect bulls to push price towards 1.14 to test the recent highs. My most probable scenario is to see EURUSD break below 1.12 towards 1.11. The material has been provided by InstaForex Company - www.instaforex.com |
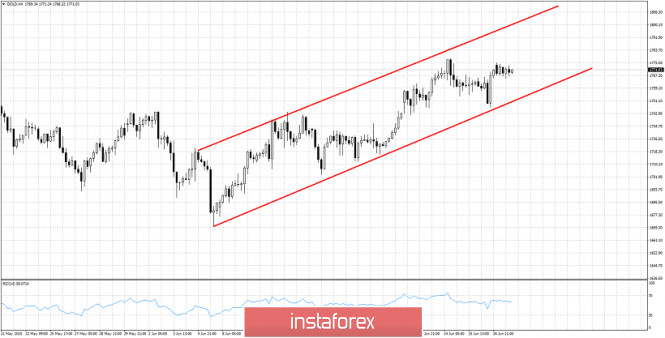
| Short-term technical analysis of Gold for June 29, 2020. Posted: 29 Jun 2020 12:20 PM PDT Gold price has a slow start for the week with low volatility and no clear direction. Trend remains bullish as price is still inside the short-term upward sloping channel created at the beginning of June. Since then price continues to make higher highs and higher lows while breaking out and above the two month consolidation.
Gold price is near its 2020 highs. Price remains in bullish trend as long as we trade above $1,750. We should not forget that price is now trading above the two month consolidation range and has already broken an inverted head and shoulders pattern. Both break outs had $1,780 as first target and $1,825 as second target. As long as price remains supported we continue to expect price to reach the second target area. The material has been provided by InstaForex Company - www.instaforex.com |
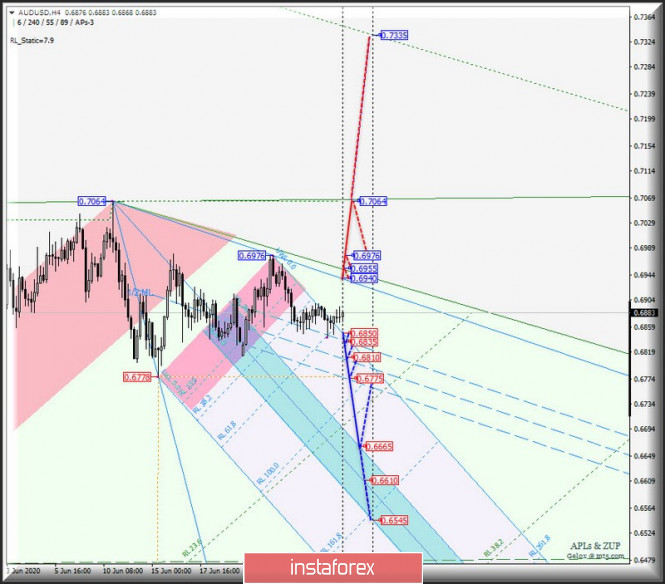
| Posted: 29 Jun 2020 09:42 AM PDT Minute operational scale (H4) What did the commodity currency instruments AUD/USD, USD/CAD, and NZD/USD prepare for us in early July (H4) - development options for the movement on June 30, 2020. ____________________ Australian dollar vs US dollar From June 30, 2020, the development of the movement of the Australian dollar AUD/USD will be determined by the development and direction of the breakdown of the range:
At a joint breakdown:
And the subsequent update of the local maximum of 0.6976, the upward movement of the Australian dollar can be continued to the maximum of 0.7064, with the update of which it will be possible to reach the warning line UWL38.2 (0.7330) in the Minute operational scale. In the case of breakdown of the initial line SSL of the Minuette operational scale forks - the support level of 0.6850 and the level of 0.6835, the movement of the AUD/USD will continue to the channel 1/2 Median Line Minuette (0.6835 - 0.6810 - 0.6775), and when breaking the lower border (0.6775) of this channel, the downward movement of the tool can be continued to the zone equilibrium (0.6665 - 0.6610 - 0.6545) of the Minuette operational scale forks. The AUD/USD movement options from June 30, 2020 are shown on the animated chart.
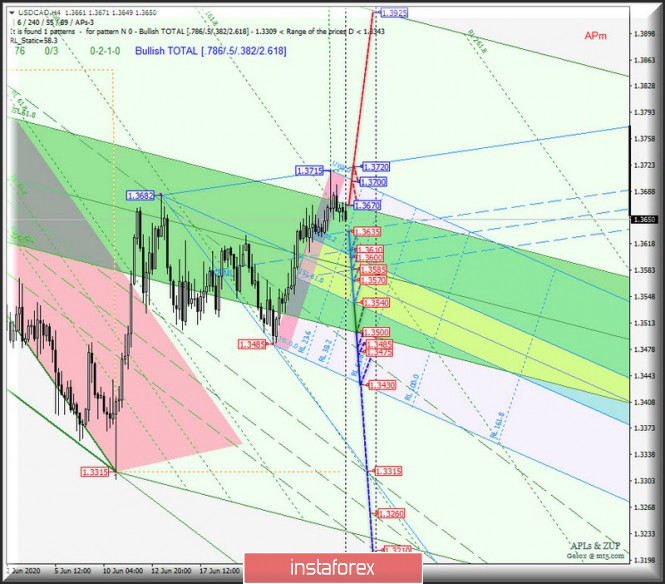
____________________ US dollar vs Canadian dollar Range development and breakdown direction:
If the support level of 1.3635 breaks down, the movement of the Canadian dollar will continue within the boundaries of the 1/2 Median Line channel (1.3635 - 1.3610 - 1.3585) and equilibrium zones (1.3600 - 1.3570 - 1.3540) of the Minuette operational scale fork with the prospect of achieving the goals:
Breakdown of the upper border of ISL61.8 of the balance zone of the Minute operational scale forks - resistance level 1.3670 - option to resume the development of the upward movement of USD/CAD to the goals:
Options for USD/CAD movement from June 30, 2020 are shown on the animated chart.
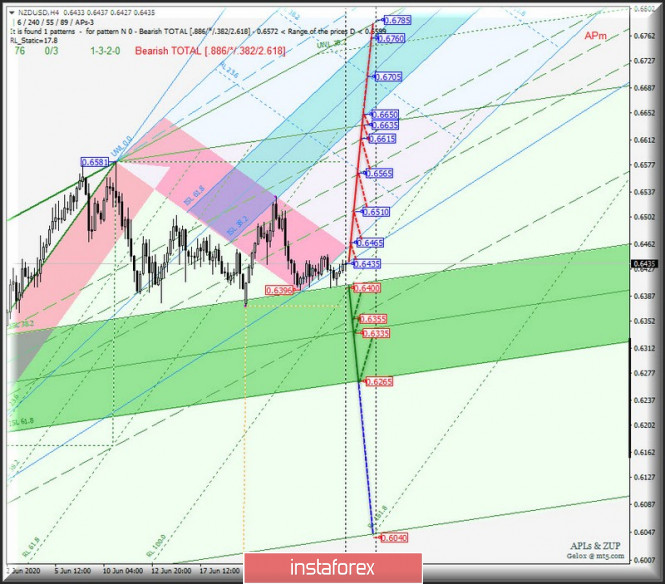
____________________ New Zealand dollar vs US dollar The further development of the movement of the New Zealand dollar NZD/USD from June 30, 2020 will depend on the development and direction of the breakdown of the range:
In the breakdown of the resistance level of 0.6435 on the line of control LTL of the Minuette operational scale fork movement of the New Zealand dollar will be directed to the starting line SSL Minuette (0.6465) and the channel borders 1/2 Median Line (0.6510 - 0.6565 - 0.6615) trading recommendations with a view to achieving the price of the initial line SSL Minute (0.6635) and lower bounds ISL38.2 (0.6650) equilibrium zone of the Minuette operational scale fork. In the event of a breakout of ISL38.2 Minute - the support level of 0.6400 - the movement of NZD/USD will develop in the equilibrium zone (0.6400 - 0.6335 - 0.6265) of the Minute operational scale fork. The markup of the options for the NZD/USD movement from June 30, 2020 is shown on the animated.
____________________ The review is compiled without taking into account the news background, the opening of trading sessions of the main financial centers, and is not a guide to action (placing "sell" or "buy" orders). The material has been provided by InstaForex Company - www.instaforex.com |
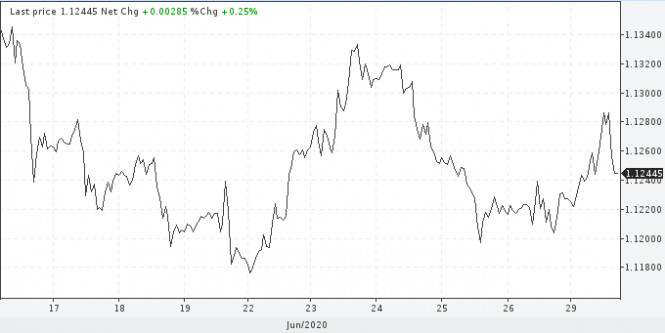
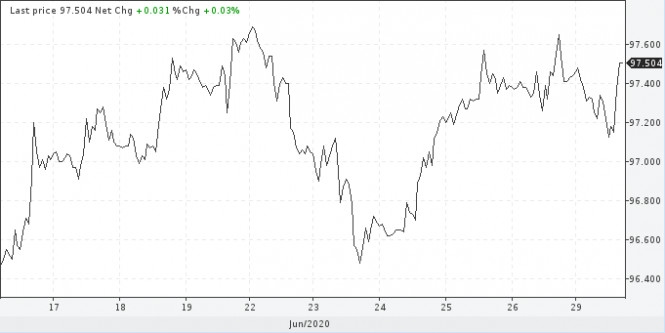
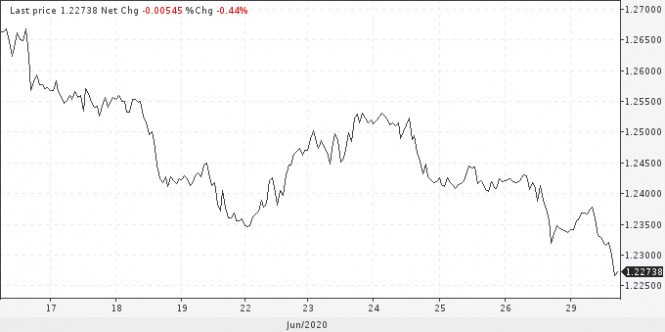
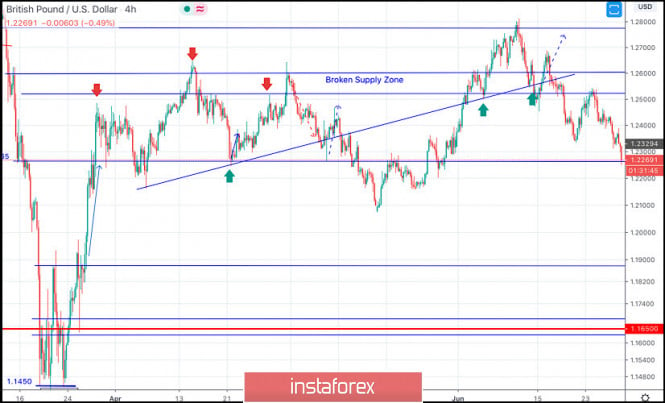
| Major economic events to form US dollar's trajectory this week Posted: 29 Jun 2020 09:38 AM PDT Global markets started the new week with choppy trading. Investors' erratic actions could be explained by the short trading week which is going to be full of events. In particular, traders will focus on the Fed announcement and the macroeconomic data from the US, including reports from the labor market. On Tuesday, Fed's Chair Jerome Powell will talk about the program of purchasing corporate bonds, and the next day the minutes from the last meeting of the US regulator will be published. On the one hand, the changes in the monetary policy could calm down the markets while they will be analyzing new signals for further actions. Yet, this could lead to strong price fluctuations. As this is going to be a short business week, traders are likely to make their decisions by July 3. In the US stock market, this could lead S&P 500 breaking through an important level of 3,000 points. On Forex, the EUR/USD pair is likely to hit the mark of 1.1200 and move lower to the level of 1.1000 afterwards. EUR/USD On Monday, the main currency pair was moving upwards to 1.1280 but failed to hold at this level. The pair pulled back in the course of the New York session. In the near future, the euro/dollar pair may follow the downtrend to as low as 1.1150. After passing this mark, the pair may drop even further. However, a serious structural reversal is possible only after testing the area of 1.1025–1.1000. In general, the European currency has been trading mixed. The local issues of the eurozone are put on halt, and worries regarding a new outbreak of coronavirus are challenging German exports. Today, the American currency has managed to make a rebound. However, it has formed a gap when trading against the basket of major currencies. The rebound in the US dollar can be viewed as promising only after the greenback wins back its losses. Worsening market sentiment can contribute to the dollar's advance. The US dollar index opened this week in negative territory. Yet, it recouped its losses during the American session and edged higher to trade at around 97.50. USDX Last week, the US dollar gained ground and is now looking for further direction. Despite decreasing risk appetite, there are still many short positions opened on the US dollar. Traders tend to sell the greenbacks on hopes that the Fed will continue to inject liquidity into the market. The British pound stays in focus this week. GBP/USD completed the last week's session at the level of 1.2340. Later on Monday, the rate was 1.2270. Despite the attempts to regain ground in the morning trade, the sterling failed to maintain momentum. In the meantime, the pound/dollar pair is likely to sustain a strong bearish trend. GBP/USD The US macroeconomic reports published on Friday indicate that the American currency may soon extend its gains. In addition, the signs that the Fed is going to stop pumping markets with liquidity have also supported the dollar. Last week, the Fed's balance sheet shrank by $75.5 billion, while a week earlier it dropped by $28 billion. What is more, the persistent uncertainty around Brexit trade deal continues to weigh on the pound. Once again, trade negotiations have come to a standstill. The talks will resume soon but their outcome is unpredictable. Therefore, market participants remain rather skeptical about the pound's prospects. The material has been provided by InstaForex Company - www.instaforex.com |
| June 29, 2020 : GBP/USD Intraday technical analysis and trade recommendations. Posted: 29 Jun 2020 08:31 AM PDT
Recently, Bullish breakout above 1.2265 has enhanced many bullish movements up to the price levels of 1.2520-1.2590 where temporary bearish rejection as well as a sideway consolidation range were established (In the period between March 27- May 12). Shortly after, transient bearish breakout below 1.2265 (Consolidation Range Lower Limit) was demonstrated in the period between May 13 - May 26. However, immediate bullish rebound has been expressed around the price level of 1.2080. This brought the GBPUSD back above the depicted price zone of 1.2520-1.2600 which failed to offer sufficient bearish rejection. Hence, short-term technical outlook has turned into bullish, further bullish advancement was expressed towards 1.2780 (Previous Key-Level) where signs of bearish rejection were expressed. Short-term bearish pullback was expressed, initial bearish destination was located around 1.2600 and 1.2520. Moreover, a bearish Head & Shoulders pattern (with potential bearish target around 12265) is being demonstrated on the chart. That's why, bearish persistence below 1.2500 ( neckline of the reversal pattern ) pauses the bullish outlook for sometime and should be considered as an early exit signal for short-term buyers. Any bullish pullback towards 1.2520-1.2550 (recent supply zone) should be watched by Intraday traders for a valid SELL Entry. Trade recommendations : Intraday traders can wait for the current bearish movement to persist below 1.2340 for another valid SELL Entry. S/L should be placed above 1.2375 while T/P level to be located around 1.2265 and 1.2200. The material has been provided by InstaForex Company - www.instaforex.com |
| June 29, 2020 : EUR/USD Intraday technical analysis and trade recommendations. Posted: 29 Jun 2020 08:26 AM PDT
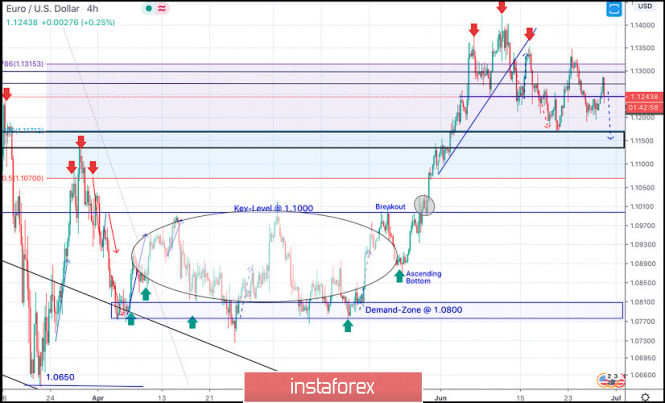
On March 20, the EURUSD pair has expressed remarkable bullish recovery around the newly-established bottom around 1.0650. Bullish engulfing H4 candlesticks as well as the recently-demonstrated ascending bottoms indicated a high probability bullish pullback at least towards 1.1065 (Fibo Level 50%). Shortly after, a sideway consolidation range was established in the price range extending between 1.0770 - 1.1000. On May 14, evident signs of Bullish rejection as well as a recent ascending bottom have been manifested around the price zone of (1.0815 - 1.0775), which enhances the bullish side of the market in the short-term. Bullish breakout above 1.1000 has enhanced further bullish advancement towards 1.1175 (61.8% Fibonacci Level) then 1.1315 (78.6% Fibonacci Level) where bearish rejection was anticipated. Although the EUR/USD pair has temporarily expressed a bullish breakout above 1.1315 (78.6% Fibonacci Level), negative divergence as well as bearish rejection were being demonstrated in the period between June 10th- June 12th. This suggested a probable bearish reversal around the Recent Price Zone of (1.1270-1.1315) to be watched by Intraday traders. Hence, Bearish persistence below 1.1250-1.1240 (Head & Shoulders Pattern neckline) was needed to confirm the pattern & to enhance further bearish decline towards 1.1150 Trade recommendations : The recent bullish pullback towards the price zone around 1.1300-1.1350 (recently-established supply zone) was recommended to be watched by Intraday Traders as a valid SELL Signal.T/P levels to be located around 1.1175 then 1.1100 while S/L to be lowered to 1.1350 to offset the associated risk. The material has been provided by InstaForex Company - www.instaforex.com |
| Posted: 29 Jun 2020 07:57 AM PDT Today, the pound sterling is coming under strong pressure due to the UK government reorganization. In the morning, the British national currency failed to go far from its monthly lows and after a slight pullback started to test those values again. Moreover, even the weaker US dollar did not support the British currency. The pound came under pressure after the British Prime Minister stated that the authorities were planning to double investment costs. According to Boris Johnson, a return to a saving regime is out of the question, since the state should focus on a quick recovery from the crisis triggered by the COVID-19 pandemic. In support of Johnson's words, the country's interior minister said yesterday that the authorities would be ready to reveal a new list of infrastructure spending on Tuesday. Recall that earlier, the pound reacted quite positively to the news on increased infrastructure spending in the UK. But now the question of a trade agreement with the EU arises. It may change the pound's trend. This week, investors focus largely on trade negotiations between Britain and the European Union, which leaders cannot reach an agreement due to a great number of disputes and differences. If the agreement is reached, the pound sterling is likely to gain ground significantly. Meanwhile, it is suffering losses against the already weak US dollar. In the morning, the pound was trading at the level of 1.2324. Notably, the US national currency dipped amid fears of a second wave of the coronavirus pandemic, as evidenced by a significant increase in the number of new cases in the United States. The pound also lost ground against the common European currency. The British currency declined by 0.3% to 91.20, the lowest value since the end of March this year. One way or another, until the EU and UK are able to agree, disputes between the wto sides are expected to continue to exert some downward pressure on the currency, dragging it down. Moreover, the escalating internal conflict in the government only exacerbates the situation. The material has been provided by InstaForex Company - www.instaforex.com |
| Evening review on EURUSD for June 29, 2020 Posted: 29 Jun 2020 07:48 AM PDT
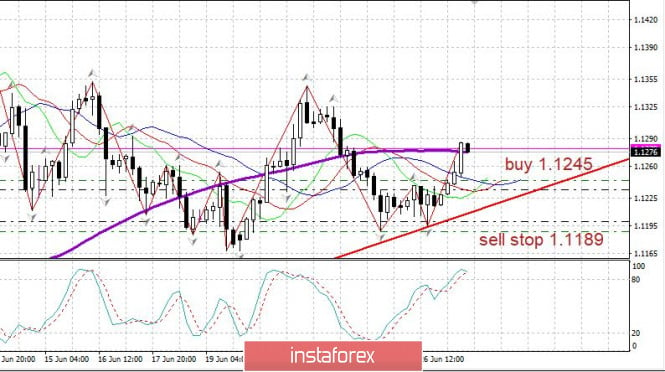
EURUSD: We entered the breakdown this morning from 1.1245, and upside by 30 points in the 4-digit which is not so bad. The targets for the growth are 1.1350 - 1.1420 - 1.1500 onwards Stop at 1.1200. Alternative: turn down and sale from 1.1189. The material has been provided by InstaForex Company - www.instaforex.com |
| EUR/USD: Germany's economy inspires bulls, but main challenge awaits ahead Posted: 29 Jun 2020 07:40 AM PDT On Monday, EUR/USD is trading with the highest volatility among major currency pairs. On the whole, the US dollar is losing confidence across the board, but traders are in no hurry to take advantage of it. Meanwhile, most currency pairs are trading quietly. GBP/USD reversed downwards in light of bold statements from Boris Johnson. The British Premier said over the weekend that London is ready to terminate further talks with Brussels on a full-fledged trade deal. At the same time, Boris Johnson admitted the so-called Australian scenario. In its trade relations with the EU, Australia sticks to the principles of the World Trade Organization, though there are separate agreements for particular kinds of goods. In other words, the UK Premier unveiled a negative scenario which is bearish for the sterling. Therefore, GBP/USD is trading lower today despite the broad-based weakness of the US dollar. Back to EUR/USD. It is trading with the opposite dynamic. The pair surged sharply, having hit a 5-day high which mirrors a correctional climb of the single European currency. The greenback's weakness is of secondary importance as the euro is holding the upper hand. Statistics from Germany accounts for such developments. Investors cheered inflation data published today. The overall CPI came in better than expected. The index grew to 0.6% month-on-month (the strongest score since April 2019) while then annual inflation accelerated to 0.9% (stronger than the expected 0.6%). The HICP also rose more than expected on month from a zero value previously which is the highest metric over the latest 14 months. In annual terms, the HICP climbed to 0.8%, the same value like in March this year. The data released today promise upbeat figures for the eurozone which will be posted tomorrow. Still, the consensus is rather pessimistic. Analysts fear that the composite CPI could dip into the negative territory for the first time for a few years. The CPI is expected at -0.1%. The core CPI is likely to show a negative value as well at -0.8%. In case the June CPI for the euro area turns out to be at least 0.1% better than the forecast, the euro will find solid support. In the context of the higher inflation in Germany, there are some grounds for the same scenario in the eurozone. The bullish move of EUR/USD is propelled by the coronavirus factor. While Europe is reopening its state borders, the US is on the verge of the second pandemic wave. Today the European Commission approved the list of the countries which receive permission to open their borders from July. A different source says about August. The greenlight is given to such countries as Monte Negro, Serbia, Georgia, Canada, Algeria, Australia, Japan, Morocco, New Zealand, Rwanda, South Korea, Thailand, Tunisia, Uruguay, and China on condition of mutual steps. The red with travel restrictions contains the US, Russia, and Brazil. These are top three countries with the anti-rating in terms of the coronavirus rates. The situation in the US is the most worrisome with the daily rate of over 40,000 new cases. The number of the infected people topped 2.5 million over the weekend. In other words, every fourth COVID-19 victim in the world comes from the US. The cluster has shifted from New York towards the South and the West of the country. 20 states report growing infection rates with Florida and Texas the worst affected. This weekend, Florida set a new record in coronavirus cases. 9,585 cases were logged there in a single day. Over the latest 7 days, the anti-record has been beaten by Arizona in terms of new cases per one million citizens. South Carolina, Arkansas, and Utah come in descending order. So, investors are alarmed by the statistics despite the fact that the White House has ruled out the second shutdown Nevertheless, in early June the daily growth of new cases was 17-25,000. As of now, the daily count is over 40,000 cases. This dynamic is putting pressure on the US dollar. To sum up, EUR/USD has an excuse for a correctional growth on Monday. Still, long deals look risky. If the eurozone's inflation data comes out worse than expected, the currency pair will reverse abruptly down at least towards support of 1.1160 (the lower border of Bollinger Bands which coincides with the Kijun-sen on the daily chart). At the moment, the price on the daily chart is in the middle of Bollinger Bands. Trend indicators have not formed any clear-cut signals yet. Nevertheless, if buyers assert themselves and the pair trades firmly above 1.1280, the Ishimoku Cloud will make the bullish signal – the Display of all 5 lines. In this case, it would be a good idea to consider long positions with the target of 1.1380 (the upper border of Bollinger Bands). The material has been provided by InstaForex Company - www.instaforex.com |
| EUR / USD at crossroads: between hopes for global recovery and fears of pandemic Posted: 29 Jun 2020 07:18 AM PDT
Investors are at a crossroads. On the one hand, the latest statistical data signal the restoration of economic activity in the world, which contributes to a return of risk appetite. On the other hand, the emergence of new foci of coronavirus infection in the United States makes market participants think about the likelihood of a new wave of the pandemic. The euro is close to showing the best two months against the greenback in a year and a half. Thanks to hopes for a joint EU response to coronavirus and a quick recovery in the region, the euro managed to strengthen by about 2.5% since early May. The EUR / USD pair was able to win back some of its recent losses and headed for the round mark of 1.1300. The euro was supported by news that the German Constitutional Court allowed the Bundesbank to independently decide on participation in the ECB's asset purchase program. In addition, the epidemiological situation in Europe seems more favorable than in the United States. Against this background, the USD index retreated from the weekly maximum reached on Friday and slipped to 97.1 points. Although the greenback is cheaper relative to most major currencies, according to some experts, it will strengthen against the backdrop of an increase in the incidence of COVID-19 in the United States and other countries. "The more stringent and widespread the new restrictions are, the slower the US economy will recover, and the higher will be the demand for the safe-haven assets, which include the US dollar," CBA analysts said. "We continue to expect a steady recovery in the global economy, which should support the strengthening of the euro in the coming months. However, at this stage, we would not recommend long positions in EUR / USD for investors who choose "shorts" for the dollar, and for whom, in our opinion, the yen remains the best option, "noted The Goldman Sachs strategists. "Given the high sensitivity of the euro area to world trade, we expect that global uncertainty around the pandemic will restrain growth in EUR / USD," ANZ Bank experts said. The previous five-day period turned out to be quite volatile for the main currency pair, however, there will be plenty of opportunities for movement this week. Fed Chairman Jerome Powell will deliver a speech on Tuesday. On Wednesday, the ISM manufacturing index will be published, and on Thursday, ahead of Independence Day in the United States, a report on the American labor market will be released. The material has been provided by InstaForex Company - www.instaforex.com |
| Oil prices dropped as scares of second wave of virus arise Posted: 29 Jun 2020 06:14 AM PDT
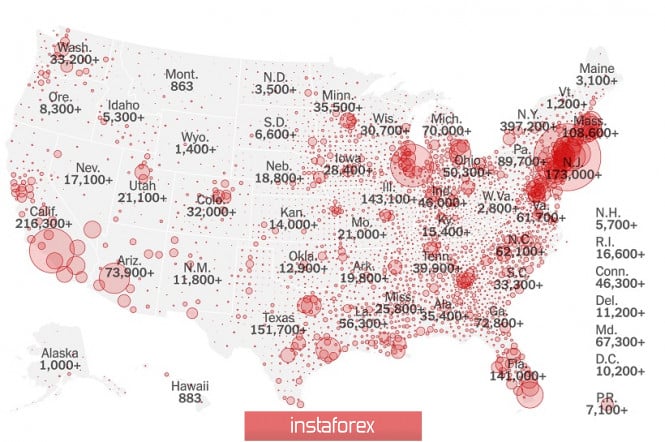
The price of crude oil this morning continued to decline, and the growing concerns of market participants about the second wave of coronavirus pandemic remain to be the indicator of which. The number of cases is rapidly increasing not only in the United States of America but also in other regions and states. According to recent data, the total number of COVID-19 patients in the world has already reached more than 10 million, and the number of deaths has exceeded 500 thousand. In some US states, authorities were forced to withdraw quarantine measures in preventing further spread of the virus. It is possible to introduce new restrictions as the situation continues to intensify every day. The southern and western states of the USA are particularly affected, where the number of cases is growing rapidly, however, the situation in the rest of the country is beginning to deteriorate significantly. Investors are seriously concerned about this, which is reflected in the cost of crude oil. At present, a new jump in the incidence rate may lead to a re-stop of the economy, since it is likely to entail a return to restrictive measures. The raw materials sector will be the first to suffer from such actions, as there will be serious pressure on demand, which is already recovering rather weakly. The second wave of the pandemic could cause irreparable damage to the black gold market. Nevertheless, analysts are more positive and still inclined to believe that the second wave of restrictions should not be expected. At least strict implementation of quarantine measures is not expected. That is why they predict a further recovery in demand, even if it does not pass as fast as investors would like. The price of futures contracts for Brent crude oil for delivery in August on a trading floor in London this morning fell by 1.8% or 0.74 dollars. The current level of value was at around $ 40.28 per barrel, which is still above the strategically important level of $ 40 per barrel. Recall that according to the results of Friday's trading last week, the cost of this raw material also slightly decreased by 0.03% or 0.07 dollars, which sent it to the area of 41.02 dollars per barrel and became evidence of the negative beginning on the market. Also this morning, the price of futures contracts for WTI light crude oil for delivery in August on an electronic trading floor in New York fell 1.84% or 0.71 dollars, which moved it to the mark of 37.78 dollars per barrel. On the last business day last week, this raw material also fell in price by 0.6% or 0.23 dollars, and the price stopped at around 38.49 dollars per barrel. In general, according to the results of the past week, Brent crude oil began to cost 2.8% less, and WTI crude oil dipped even more by 3.4%. Thus, a negative trend was formed, which the oil market has not yet been able to cope with. Meanwhile, a little positive comes against the background of a decrease in the number of drilling rigs for oil and gas production in the United States. Their number continues to stay below the minimum values of more than a decade ago. This cannot but cause rejoice, since other oil producers, on the contrary, are opening new drilling stations amid rising oil prices. Last week, approaching the end of June 26, the number of drilling stations in America was another 1 less, reaching a level of 188 units. This means that the total volume of raw materials production will also become lower in the near future, which is a positive factor for the market in this situation. Recall that the number of rigs in the United States ceased to grow at the beginning of March, and since then their number has been steadily decreasing. The total number of oil and gas installations are also at a minimum mark of 265 units, which is much lower at 73% from the previous value of 702 units. For the first month of summer, the reduction was 36 units. Nevertheless, the main factor for the movement of oil quotes is still the news about the spread of the COVID-19 pandemic. The growing concerns of the second wave of which seriously puts pressure on the cost of crude oil, and there are no reasons for breaking the current trend. The situation is also warmed by the growth of black gold reserves expected by experts in the United States, which is due in the current week. Thus, the positive is clearly less, which is likely to cause raw material prices to decline even more. The material has been provided by InstaForex Company - www.instaforex.com |
| Posted: 29 Jun 2020 06:13 AM PDT
This morning, stocks in the Asia-Pacific region are experiencing an almost universal decline, still caused by the continuous spread of coronavirus infection and scares of a possible second wave of a pandemic. To date, the number of deaths caused by the virus has exceeded the mark of 500 thousand, and the number of cases has exceeded the level of 10 million. Such a high number of cases seriously scared the markets, which immediately responded with a decline. Japan's Nikkei 225 Index immediately fell 1.94% in the morning. The indicator of retail sales in the country over the past month rose by 2.1% compared with the previous month. In average annual terms, it decreased by 12.3%. Real numbers did not coincide with preliminary assumptions of analysts who expected a decline in no way lower than 11.6%. In addition, sales have been declining for three consecutive months, the main reason for which is the negative impact of the COVID-19 pandemic on demand. The April indicator was 9.9% lower than the previous month, and in annual terms, the decline was 13.9%. Japan's corporate sector is negative. Investment companies, as well as automobile and electronics manufacturers, are particularly affected. China's Shanghai Composite Index also fell 0.68% in the morning. Hong Kong's Hang Seng Index followed and declined even further to 1.19%. The statistics on the level of profit of the largest enterprises of the industrial sector of the PRC for the last month of the spring of this year were quite encouraging. Profit level rose by 6%, which is associated with the restoration of large-scale production and the resumption of sales as quarantine measures related to the pandemic are lifted. The total profit in the large industry was 582.34 billion yuan, which corresponds to 82.25 billion dollars. Recall that the April indicator was in the negative zone, which reflected a decline of 4.3%. The Kospi South Korea index also went on a downward correction today and sank to 1.61%. The electronics and car manufacturing sectors have also shrunk. Australia's S&P/ASX 200 index showed a significant decline of 1.79%. The country's banking sector is recording a rapid decline on all fronts. Securities of National Australia Bank, which dipped by 2.6% in the morning, were especially affected. State mining companies are also in the red. The stock markets of the United States of America also win back the news about the growing number of infected in the world and in the country. The last trading day last week ended with a decline, which led to the lowest level of almost all indices over the past two weeks. Investors are extremely concerned about the number of new COVID-19 cases in some states of America. The authorities even had to stop the lifting of quarantine measures, which caused even greater tension among market participants. The prospect of a repetition of the events of spring, of course, pleases no one. Stock indices are under significant pressure amid a slowdown in the already not-so-fast pace of economic recovery. Securities of the US banking sector adjust down. They could suffer the most significant losses amid the ongoing pandemic crisis. According to preliminary estimates, losses could amount to about $ 700 billion, which is quite a large sum for the US economy. In order to support and save the capital of financial companies, the main regulator of the country which is the US Federal Reserve has decided to stop the process of repurchasing own shares of banks for the entire third quarter of this year. Some members of the organization even advocated a complete exemption from such payments, but so far such actions are not considered. In addition, on the last business day of last week, statistics were released on the level of spending in the United States for the last month of spring. As it became known, this indicator showed a significant increase, despite the fact that the income of the Americans also fell significantly. Costs grew by 8.2%, while in April it fell at a record 12.6%. Revenues in May decreased by 4.2%, while in April there was an increase of 10.8%. The Dow Jones Industrial Average last week closed its trading with a drop of 2.84% or 730.05 points, which sent it to 25 015.55 points. The Standard & Poor's 500 index fell 2.42% or 74.71 points. Thus, its level was in the region of 3,009.05 points. The Nasdaq Composite Index dipped 2.59% or 259.78 points, which made it jump to 9,757.22 points. In general, over the past week, the Dow Jones index fell by 3.3%, the S&P 500 decreased by 2.9%, and the Nasdaq lost less than the rest with only 1.9%. The negative impact of an unfavorable epidemiological situation in the world is also felt on the European stock exchanges. The possibility of a second wave of a pandemic makes the indices of Western European countries shrink. The International Monetary Fund has already made a statement that securities markets may face another and, possibly, more significant wave of sales. It will be especially serious if restrictive measures are introduced again. The ECB is confident that the crisis has not yet peaked, thus the main difficult moments are yet to come, and the current decline in the stock market is a sign of an impending crisis wave. The total index of enterprises in the European region Stoxx Europe 600 following the auction on Friday fell by 0.39% and was at around 358.32 points. The German DAX Index fell 0.73%. The French CAC index also fell by 0.18%. Same with Italy's FTSE MIB index at 0.57%. The Spanish index showed the most serious negative dynamics with 1.26%. But the UK FTSE 100 index, on the contrary, began to move in the opposite direction and recorded a growth of 0.2%. The material has been provided by InstaForex Company - www.instaforex.com |
| Posted: 29 Jun 2020 05:55 AM PDT
Economic recovery is still under pressure of COVID-19 due to the rapid growth in the number of new cases. This caused a fall in Chinese shares. On Wall Street, stocks dropped by more than 2% last week. The Shanghai Composite Index fell by 0.61% to 2,961.52 points, while the blue-chip CSI300 index ended down 0.71% to 4.109.72 points. The financial sector sub index was down by 1.42%, the consumer goods sector added 0.37%, the real estate index dropped by 1.65%, and the health sector grew up to 0.5%. The ChiNext Composite startups index decreased by 0.42%. The biggest losers are Anhui Xinli Finance Co, China National Medicines Corp and Ningbo Heli Mold Technology Co shares, which lost 10.02%, 10% and 9.97% respectively. The Hong Kong Hang Seng Index fell down by 1.01% to 24,301.28 points, while the Hang Seng China Enterprises Index shed 0.97% to 9,757.69 points. The material has been provided by InstaForex Company - www.instaforex.com |
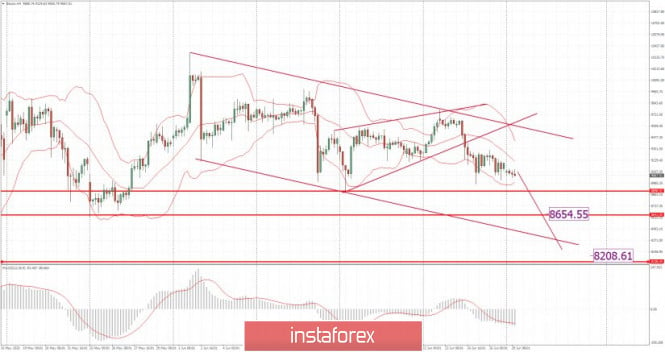
| BTC analysis for June 29,.2020 - Sellers in control and potentia for drop towards the $8.200 Posted: 29 Jun 2020 04:57 AM PDT Corona virus summary:
Boris Johnson has admitted the coronavirus crisis has been "an absolute nightmare for the country", while declaring it was time for a "Rooseveltian approach to the UK" but not yet time for an inquiry. "I don't think the moment is right now for consecrating a huge amount of official time to all that, but we are learning lessons the whole time and we obviously will draw the right conclusions for the future." Technical analysis: BTC has been trading downwards. The price tested the level of $9,075. I see further downside continuation due to the breakout of the rising wedge in the background. Trading recommendation: Watch for selling opportuntiies on the rallies due to breakout of rising wedge in the background and downward channel in control. The material has been provided by InstaForex Company - www.instaforex.com |
| Commodities: outlook for second half of 2020 remains troubling Posted: 29 Jun 2020 04:55 AM PDT
Coronavirus pandemic has negatively affected markets. So, in the first six months, prices of most commodity assets slumped. Nevertheless, the next six months could also be difficult. Market could face the second wave of COVID-19 and an active presidential race in the United States. This, in turn, may have an impact on oil, gas, gold, copper, and other commodity assets prices. Oil During six months, oil prices were falling and rising. At first, quotes collapsed due to disagreements between Russia and Saudi Arabia. Then the coronavirus pandemic made oil prices nosedive. May WTI oil futures fell below zero and reached $-40 per barrel for the first time in history. However, in just two months, oil prices reached $40 per barrel. It is hard to say what oil prices should expect in the second half of the year. It depends on how COVID-19 would develop. Perhaps demand will recover amid the global reviving from the quarantine. Or, on the contrary, demand may collapse due to the second wave of coronavirus. Gold Gold rose in price by 16% in six months due to increasing demand for safe-haven assets and the unlimited printing of money by the Fed. Goldman Sachs experts suggest that gold prices could reach $2,000 per ounce in the next 12 months. However, experts at Capital Economics, on the contrary, expect a drop in gold prices amid falling demand for defensive assets. Copper Experts suggest that the price of this industrial metal may grow despite a worsening epidemiological situation in the world. Jefferies analysts note that in the largest countries of the world there was a shortage of copper supply even during quarantine because not all employees returned to work. That is why the level of scrap recycling remains extremely low. Copper is quite popular in China because it is used in a huge amount of goods from automobiles to electronics. Experts consider copper the most attractive commodity. Natural gas A fall in demand for the "blue fuel" amid the spread of COVID-19 has led to lower prices. However, the situation could improve as winter will begin soon in the Northern Hemisphere and gas will be needed for heating. Nevertheless, the European gas storage facilities are already full by 78%. Analysts warn that their quick filling could lead gas prices to zero or even lower, as happened with May WTI oil futures. Iron ore Iron ore prices rose due to low supply and high demand from China, where steel production reached record levels. However, Morgan Stanley suggests an oversupply in the second half of the year and iron ore prices will return to $80. The material has been provided by InstaForex Company - www.instaforex.com |
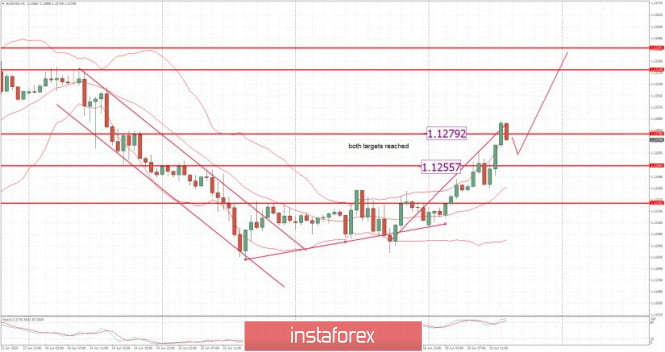
| Posted: 29 Jun 2020 04:51 AM PDT Corona virus summary:
China's military has approved a coronavirus vaccine for use within its ranks that has been developed by its research unit and a biotech firm. More than half of 17 candidate vaccines identified by the World Health Organization that are in clinical evaluation involve Chinese companies or institutes. Hong Kong-listed CanSino Biologics said in a filing to the stock exchange that data from clinical trials showed the Chinese military vaccine had a "good safety profile" and potential to prevent disease caused by the coronavirus. Technical analysis: EUR/USD has been trading upwards as I expected. The price reached our second target from Friday at the price of 1,1280. Anyway, I still see potential for the upside continuation and rally towards the 1,1325 and 1,1350. Trading recommendation: Watch for buying opportunities on the dips due to strong upward trend and breakout of the 2-day balance to the uspide. Upward targets are set at the price of 1,1325 and 1,1350. The material has been provided by InstaForex Company - www.instaforex.com |
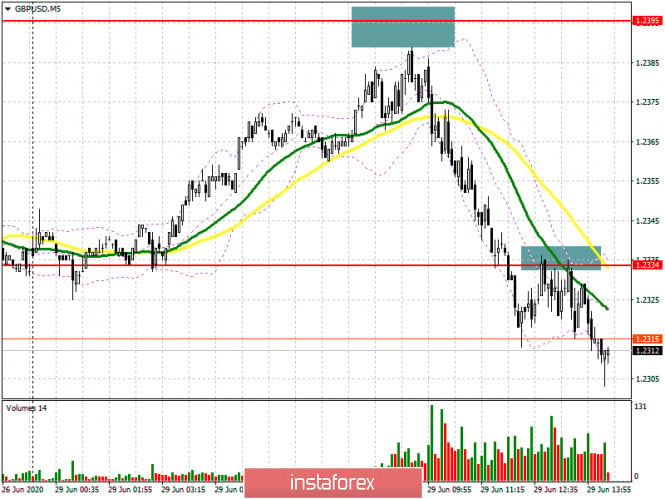
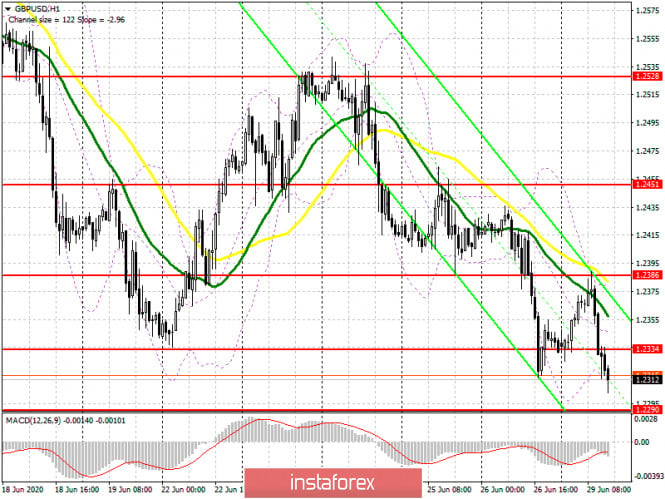
| GBP/USD: plan for the American session on June 29 Posted: 29 Jun 2020 04:50 AM PDT To open long positions on GBPUSD, you need: Buyers failed to take advantage of the Asian upward momentum and retreated from the market after a sluggish attempt to update the resistance of 1.2395, which I drew attention to in my morning forecast. If you look at the 5-minute chart, you will see how the bulls tried to test the level of 1.2395, but nothing came of it, after which the pound quickly went down. Unfortunately, it was not possible to wait for a good entry point from this level, which can not be said about the support of 1.2334. Immediately from the first time, the bears broke below this range and gained a foothold under it, making a fairly successful test from the bottom up, which was a signal to open short positions. The key task of the bulls in the second half of the day will be to return to the level of 1.2334, since only then can we expect a repeated growth of the pound to the area of 1.2385, where I recommend fixing the profits. It will be possible to talk about the formation of a larger upward correction and the end of the bearish trend only after the breakout of the level of 1.2385 and the update of the maximum of 1.2451. In the scenario of a further decline in GBP/USD, and while everything is going to this, it is best to consider long positions from the level of 1.2290 only after the formation of a false breakout there, but I recommend buying the pound immediately for a rebound from the minimum of 1.2237 in the calculation of correction of 30-40 points within the day.
To open short positions on GBPUSD, you need: The bears achieved their goal and broke below the level of 1.2334, forming a good sell signal there. While trading will be conducted below this range, you can expect to continue reducing the GBP/USD to the support area of 1.2290, where the first attempt to fix profits will occur, but more persistent sellers will expect to update the minimum of 1.2237, from which I recommend completely leaving the market. An equally important task for the bears will be to protect the resistance of 1.2334. Opening new short positions from this level, in case of returning to it in the afternoon, is possible only after the formation of a false breakdown. I recommend selling GBP/USD immediately for a rebound only after testing the morning high of 1.2386, counting on correction of 30-35 points within the day.
Signals of indicators: Moving averages Trading is conducted below the 30 and 50 daily averages, which act as a resistance for buyers. Note: The period and prices of moving averages are considered by the author on the hourly chart H1 and differ from the general definition of the classic daily moving averages on the daily chart D1. Bollinger Bands A break in the lower border of the indicator at 1.2310 should increase the pressure on the British pound. If there is no rapid downward movement, it is best to abandon sales at the lows. Description of indicators
|
| You are subscribed to email updates from Forex analysis review. To stop receiving these emails, you may unsubscribe now. | Email delivery powered by Google |
| Google, 1600 Amphitheatre Parkway, Mountain View, CA 94043, United States | |








No comments:
Post a Comment