Forex analysis review |
- Forecast for AUD/USD on July 14, 2020
- Forecast for USD/JPY on July 14, 2020
- Hot forecast and trading signals for the GBP/USD pair on July 14. COT report. Buyers gave the initiative into the hands of
- Hot forecast and trading signals for the EUR/USD pair on July 14. COT report. Buyers have minimal advantage over sellers.
- Overview of the GBP/USD pair. July 14. China is imposing retaliatory sanctions against the US. The British pound continues
- Overview of the EUR/USD pair. July 14. The focus is once again the "coronavirus." Anthony Fauci is in conflict with Donald
- July 13, 2020 : EUR/USD Intraday technical analysis and trade recommendations.
- USD: chance of growth remains
- Evening review on EURUSD for July 13, 2020
- July 13, 2020 : GBP/USD bulls are testing the mid-range level at 1.2650, would it hold ?
- Comprehensive analysis of movement options for the commodity currencies AUD/USD & USD/CAD & NZD/USD (H4) on July
- GBP/USD. Tomorrow's economic release may boost pound sterling
- Gold aims for long rise
- Global stocks rise amid anticipation on new statistics
- Japanese yen gains momentum
- Will the "Australian" catch a fair wind?
- EUR/USD: coronavirus knocks USD down that is bullish to EUR
- Analysis of EUR/USD and GBP/USD for July 13. What could result in a new outbreak of coronavirus in the US? Disappointing
- GBP/USD: plan for the American session on July 13
- EUR/USD: plan for the American session on July 13
- EUR/USD analysis for July 13 2020 - Resistance at the price of 1.1330 on the test. Potential for the drop towards the 1.1258
- Analysis of Gold for July 13,.2020 - Potential for the drop tue to slopping upside price action and resistance on the test.
- Trading recommendations for the EUR/USD pair on July 13, 2020
- BTC analysis for Jully 13,.2020 - Fake breakout of the trading range and potential for bigger drop towards the $7.800
- Technical analysis of EUR/USD for July 13, 2020
| Forecast for AUD/USD on July 14, 2020 Posted: 13 Jul 2020 08:41 PM PDT AUD/USD The Australian dollar fell for the third consecutive day on Monday. Even if it's a little, but the triple divergence on the Marlin oscillator is at risk on the daily chart. The signal line of the oscillator is now in the negative zone, a further decline in the price below the level of 0.6900 may lead to a further fall to 0.6745 and possibly develop a medium-term decline (0.6600 and below). An exit of the price above the signal level of 0.7000, which is marked on the four-hour chart, can prevent the development of a downward movement. In this case, the triple divergence on Marlin will continue to form and the targets 0.7080 and 0.7190-0.7225 will open before the price. Pulling down the price below the target level of 0.6900 opens the target of 0.6745. But first, the price needs to get a foothold under the MACD line on H4, that is, below yesterday's low. |
| Forecast for USD/JPY on July 14, 2020 Posted: 13 Jul 2020 08:41 PM PDT USD/JPY The USD/JPY pair rebounded in growth on Monday, adding 40 points. But the growth was late (the yen strengthened all week amid horizontal movement of stock indexes), or, more precisely, out of place, as the US stock market ended yesterday by falling: S&P 500 -0.94%, Nasdaq -2.13%, only the Dow Jones was in the black by a symbolic 0.04%. Asian indexes are also falling today: Nikkei 225 -1.05%, China A50 -0.80%, Kospi SEU -0.55%. The price showed a reversal from the MACD line (blue indicator) on the daily chart, but it was broken through by a deep lower shadow last Friday, which is a sign of the falsity of the subsequent upward movement, that is, growth on Monday. Accordingly, the most likely scenario for further development of events will be for the price to return under the MACD line and its decline to the lower line of the price channel to the level of 105.70. The price needs to go above the nearest target level of 107.77 for further growth – the goals of 108.38 and 108.95 are sequentially opened. The MACD line stopped yesterday's price growth on the four-hour chart. The price also failed to go over the red balance indicator line, that is, the growth occurred within the speculative framework of a downward trend. A further decline in the price below the signal level of 106.95 will correspond to the price leaving the area under the MACD line on the daily scale. After that, we wait for the price at 105.70. The material has been provided by InstaForex Company - www.instaforex.com |
| Posted: 13 Jul 2020 05:46 PM PDT GBP/USD 1H The GBP/USD currency pair also settled below the ascending channel on the first trading day of the week, which means that the trend has changed to a downward one. In addition, the pair's quotes are also pinned below the critical Kijun-sen line, so we can say that the sellers of the British pound have much more clearly defined their position than the sellers of the euro, who failed to develop their success. The bulls never managed to overcome the resistance area of 1.2668–1.2688, and three attempts were made. Thus, we now expect a new downward trend to form, at least in the short term. The question is, will the bears have enough strength and fundamental grounds to start a powerful downward movement? As we have already said, the fundamental backgrounds of the euro/dollar and the pound/dollar are different. GBP/USD 15M Both linear regression channels turned down on the 15-minute timeframe, which means the beginning of a downward movement in the most short-term plan. Thus, two timeframes at once speak in favor of changing the trend to a downward one. As for the latest COT report, it turned out to be absolutely logical and reflects the essence of what is currently happening in the currency market for the pound/dollar pair. Professional traders opened 6,743 Buy-contracts and as many as 12 sell-contracts during the reporting week. Thus, the total net position in the commercial category immediately increased by 6,700. But the category of commercial market participants actively closed both Sell and Buy contracts. At the same time, Buy in much larger quantities. However, as we can see, this did not affect the overall strengthening of the British currency. Thus, the COT report speaks in favor of further strengthening the British currency. However, we remind you that any forecast based on a COT report must be confirmed (usually technical). At this time, the technical picture is such that it is more reasonable to expect a movement down. The fundamental background for the GBP/USD pair did not change on the first trading day of the new week, as no fundamentally new and important information was available to traders on July 13. As we have already found out in the fundamental reviews, we should not expect traders to strongly react towards the US inflation report, and to reports on GDP and industrial production in the UK. But information continues to arrive about the balance of forces in the election race between Joe Biden and Donald Trump. We have already written that at the moment, Biden leads in the polls by 6-10% on average across all states in the US. But we also said that due to the peculiarities of the electoral system in America, the results of voting in the so-called "wavering" states will be of great importance. According to the latest information, the Democratic candidate is ahead of Trump in at least two of these states, which were won by Trump in 2016. We are talking about Florida and Texas. The situation in Arizona is also very controversial. It should be noted that these three states are "severely affected" by the coronavirus epidemic and many sociologists believe that the opinion of their residents can be very strongly influenced by the COVID-2019 pandemic, on a large scale, which many blame it on Trump, who initially did not attach much importance to it, and until recently even refused to wear a medical mask, thus not setting the right example to Americans. There are two main scenarios as of July 14: 1) The bullish outlook dramatically worsened at the start of the new trading week. At this time, the pair's purchases are already impractical and not recommended, as there are several technical signals at once to complete the upward movement. Thus, we recommend returning to the purchase of the British pound no earlier than overcoming the resistance area 1.2668-1.2688. The goal in this case is the resistance level of 1.2791. Potential Take Profit in this case will be about 90 points. 2) For sellers, you are advised to trade lower for support with a support level of 1.2497 and Senkou Span B line (1.2422), since the Kijun-sen line is left behind. Today's reports on UK GDP and US inflation are unlikely to fundamentally change the mood of traders, however, do not lose sight of them. There may be surprises. Potential Take Profit range from 40 to 120 points. The material has been provided by InstaForex Company - www.instaforex.com |
| Posted: 13 Jul 2020 05:46 PM PDT EUR/USD 1H Buyers again actively traded the euro/dollar pair for an increase on the hourly timeframe on July 13. Despite the fact that the quotes were pinned below the ascending channel a day earlier, thus forming a signal for the end of the upward trend. However, during the past day, the bulls rushed to attack and brought the pair to the upper border of the 1.1200–1.1350 side channel. Formally, the upper limit of this channel was overcome, and even a weak upward trend has formed in the last two weeks, which was illustrated by the ascending channel, but we still can not say that the current movement with very frequent and deep corrections, first, can be called a trend, and secondly, is convenient. We are still inclined to the option that the bulls are not strong enough to develop a real trend, so we see corrections every day that match the size of the impulsive areas. Moreover, buyers retreated again after reaching the resistance level of 1.1366, so we now expect a new round of downward correction. EUR/USD 15M Both linear regression channels are directed upwards on a 15-minute timeframe, which clearly signals an upward trend in the most short-term plan. However, not overcoming the level of 1.1366 can pull down the quotes. The latest COT report from July 7 was quite boring. As usual, we are most interested in changes to contracts in the commercial category, which represents professional traders entering the foreign exchange market in order to make a profit. Speculators in the reporting week opened almost 6,000 Buy-contracts and only 1,700 Sell-contracts. Thus, the total net position for this category has increased by about 4,000, which, simply put, means an increase in the bullish mood of major players. However, do not forget that the COT report only shows changes that have already occurred, so it always requires confirmation as a forecasting tool. At this time, the technique indicates a high probability of going down. Or, at least, the weakness of the upward trend, which is extremely inconvenient to work with. The fundamental background for the EUR/USD pair did not change at all on Monday, as no important reports were scheduled for the day. If we talk about the fundamental background from Europe, the most important event now is the summit scheduled for July 17-18, during which the issue of forming a 750 billion European economic recovery fund will be discussed again, on which the EU member states have accumulated a lot of disagreements, as well as on the budget for 2021–2027. As for ordinary reports and statistics, data on industrial production will be published in the European Union today, but it is unlikely for it to have a serious impact on the mood of market participants. In some ways, technique and foundation currently contradict each other, since there was a signal to end the upward trend when the quotes left the ascending channel. At the same time, the pair easily reached the previous local high of 1.1371 yesterday. Thus, before the EU summit, we believe that data on the number of daily diseases COVID-2019 in the US will be more important for market participants, rather than economic statistics. Based on the foregoing, we have two trading ideas for July 14: 1) Buyers again returned the pair to the level of 1.1366, which was already reached last Thursday. And, like last Thursday, buyers can now put the initiative in the hands of bears for a short time. One way or another, but we do not expect the pair to continue growing right now, although formally overcoming the level of 1.1366 will allow us to open long positions with the target at the level of 1.1432. Potential Take Profit in this case is about 60 points. 2) The bears seemed to be able to seize the initiative at the end of last week, but they failed to gain a foothold below the Senkou Span B line and buyers returned to dominate. Now, sellers need to wait for a new chance in the form of consolidating the pair below the Kijun-sen line (1.1314), which will make it possible to sell the euro with goals Senkou Span B line (1.1265) and the support level of 1.1238. Potential Take Profit in this case is from 40 to 70 points. The material has been provided by InstaForex Company - www.instaforex.com |
| Posted: 13 Jul 2020 05:26 PM PDT 4-hour timeframe
Technical details: Higher linear regression channel: direction - upward. Lower linear regression channel: direction - upward. Moving average (20; smoothed) - upward. CCI: 32.9645 The British pound spent the first trading day of the new week in a new round of corrective movement. Buyers did not find the strength, and in the news feed – the reasons to continue buying the British currency and selling the dollar. However, this does not mean that the upward trend is complete. At the moment, the pound has fallen by only a few dozen points and failed to work out even the moving average line, which is considered the main goal in the "linear regression channels" system for all corrections. Thus, the upward movement may resume on Tuesday. Recall that the main helper of the British currency is now America. It is the current situation across the ocean that does not allow traders to buy the US currency. First of all, we are referring to the "coronavirus" epidemic, which does not abate at all and only acquires new and new scales. In the second place, we are talking about the confrontation between China and the United States, which is still flaring up. There are a huge number of contentious issues between Beijing and Washington, so it is not worth expecting to establish relations in the coming months. Plus, we should not forget that China is not a fan of the current US President and is waiting for a change of power in the country to have a dialogue with the new President, who is most likely to be Joe Biden, who has always been favorable and friendly to China. Third, we are talking about a political crisis, about Donald Trump, whose ratings have declined significantly in 2020, and the fans of his manner of doing business have noticeably decreased. These factors allow the British currency to strengthen so far. However, we will remind you once again that the British pound is unlikely to be able to go far on these factors. These factors are strong, however, the situation in the UK is no better. From 2021, British businesses will have to trade with EU countries under WTO rules, that is, with tariffs, quotas and duties. Brexit will be "tough", which the UK Parliament fought against for three years, and the British are likely to expect higher taxes and fees since somehow the UK government will need to patch the holes in the budget that caused the "coronavirus crisis" and Brexit. Thus, the welfare of British people is likely to continue to deteriorate in the coming years. And with it, attitudes toward conservatives may begin to deteriorate... Meanwhile, the theme of the China-US confrontation has developed. As it became known on Monday, Beijing responded to Washington's sanctions, which it imposed earlier because of the oppression of Uighurs in the Xinjiang region. China has decided to impose mirror measures against American officials, which will include several Republican senators, several other representatives of the US Congress, as well as the entire congressional Committee on relations with China. "This law deliberately distorts the human rights situation in Xinjiang, viciously discredits the policy of the Chinese government, violates the basic norms of international law and international relations, and is a gross interference in the internal affairs of the PRC. The Chinese government and people express strong indignation and strongly protest," the Chinese Foreign Ministry said in an official statement. At the same time, former assistant to US President Steve Bannon in an interview with the British newspaper Sunday Mirror said that some employees of the laboratory in Wuhan have fled the country and are now cooperating with Western intelligence services. According to Bannon, lab workers in Wuhan, where the COVID-2019 virus was released, are presenting evidence of the Chinese Communist Party's guilt in the incident. Bannon also said that US intelligence, along with British intelligence, is thoroughly investigating the case and collecting evidence of China's guilt to prepare materials for the court case. It seems that the tension between the United States, Britain, and China continues to grow. On the second trading day of the week in the UK, several fairly important macroeconomic publications are planned. First of all, we recommend paying attention to the GDP for May. It is expected to grow by 5%. On the one hand, this is a good figure, on the other - it still needs to be achieved, and against the background of losses a month earlier, 20.4% is a negligible recovery. Recall that it is the British economy that will suffer the greatest losses in 2020 among the EU countries. Therefore, +5% of GDP in May is unlikely to overwhelm the optimism of buyers of the pound. Moreover, the pound is now growing not due to statistics or "foundation" from the UK, but due to low demand for the US currency. Industrial production for May will also be published with a forecast of -20.9% y/y and +6% m/m. The same can be said about these figures. After the strongest cuts of all macroeconomic indicators in April, the currently expected gains look just like a small pullback, rather than the beginning of economic recovery. Thus, we believe that all these important data in conjunction with US inflation will be ignored by market participants, and the pair's movement will continue following technical factors and the overall fundamental background. And the fundamental background for the British pound remains sharply negative. We believe that as soon as the situation in the US improves a little (if this happens), the British pound will immediately begin a new round of decline against the US currency. Too much pressure has now formed on the British economy and in recent years this pressure has not eased. And in 2021, it can only increase, as we have repeatedly said. The fact that the negotiations between the groups of David Frost and Michel Barnier failed is no longer of interest to market participants. Who is interested in learning about another failure and lack of progress? Thus, in principle, we can safely expect the moment when Boris Johnson will announce the termination of negotiations with Brussels, as he promised earlier. As for other factors, both channels of linear regression are currently directed upwards, as is the moving average. Therefore, all trend indicators now indicate an upward trend. Based on this, we expect a move to the previous local maximum of about $ 1.28. Only the consolidation of quotes under the moving will allow us to consider the option of ending the upward trend.
The average volatility of the GBP/USD pair continues to remain stable and is currently 97 points per day. For the pound/dollar pair, this value is "average". On Tuesday, July 14, thus, we expect movement inside the channel, limited by the levels of 1.2506 and 1.2700. Turning the Heiken Ashi indicator upward will indicate a possible resumption of the upward movement. Nearest support levels: S1 – 1.2573 S2 – 1.2512 S3 – 1.2451 Nearest resistance levels: R1 – 1.2634 R2 – 1.2695 R3 – 1.2756 Trading recommendations: The GBP/USD pair started a new round of downward correction on the 4-hour timeframe. Thus, today it is recommended to open new buy orders with the goals of 1.2695 and 1.2756, after the reversal of the Heiken Ashi indicator to the top. It is recommended to sell the pair after fixing quotes below the moving average with the first goals of 1.2512 and 1.2451. The material has been provided by InstaForex Company - www.instaforex.com |
| Posted: 13 Jul 2020 05:26 PM PDT 4-hour timeframe
Technical details: Higher linear regression channel: direction - upward. Lower linear regression channel: direction - upward. Moving average (20; smoothed) - upward. CCI: 175.7121 For the EUR/USD pair, the first trading day of the week was held in absolutely familiar trading recently. The pair was still trading in the side channel, limited by the levels of 1.1200-1.1350, near its upper border. Quotes again approached the Murray level of "5/8"-1.1353, but at the moment it is still impossible to say that this level has been overcome, and now the pair is waiting for the formation of a new upward trend. The most interesting thing is that in recent weeks, a pronounced upward trend has formed inside the side channel. In other words, the pair does not trade from the lower border to the upper and Vice versa. It shows a long movement in one direction with very frequent and deep corrections. Thus, this time is still far from the most favorable for trading the euro/dollar. On Monday, as is often the case, the calendar of macroeconomic events in Europe and the United States was completely empty. In principle, volatility during the day perfectly reflects the almost absent fundamental background. However, one topic does not give rest to investors and traders and does not allow the US currency to start growing again. Many believe that the US dollar is the world's number one currency. That is the currency that everyone buys when the world has another crisis. This is partly true. However, one remark must be made here. If at the same time the crisis in the United States themselves is also quite large, and in addition to the crisis there are a huge number of other problems, then the US dollar will no longer become more expensive, "because there is a coronavirus in the world". Recent weeks are a great confirmation of this, as the euro and pound are growing. The euro simply does not have any good fundamental reasons for strengthening, and the pound, according to all the canons of fundamental analysis, should move in any direction but not up. However, both currencies are growing quite confidently. And the reasons, as we have said more than once, should be sought exclusively in the United States. And one of the most likely causes is "coronavirus". As we have already said, Europe has managed to win a relative victory over the epidemic. At least the daily growth rates of diseases have fallen to their minimum values, which means that the number of people recovering is greater than those infected, therefore, the total number of patients is decreasing, and the burden on the health sector is also decreasing. In the United States, the opposite is true. The rate of disease growth is growing day by day and is beating all the anti-records. It is hardly necessary to list once again what the United States may face if the virus continues to spread, "as in a crowded minibus". It is obvious that sooner or later most of the US population will get sick. But even if we are talking about 20% of the entire population, it will mean the collapse of the medical system. Hospitals simply cannot cope with the influx of sick people who need hospitalization or ventilators. Not to mention that Americans are unlikely to run for work in the face of a national epidemic. What it can end up with, it's scary to imagine. The US government will of course pay unemployment benefits, otherwise, it will not be possible to avoid new rallies and protests, which will be far from the most peaceful. However, the national debt will continue to grow. Donald Trump is not afraid of this, but sooner or later this "bubble" will burst. And the bigger this "bubble", the stronger the "explosion". The country's chief epidemiologist, Anthony Fauci, who spent several weeks in isolation and made no comment, said "the world is only at the very beginning of the COVID-2019 pandemic". "The virus will continue to spread if countries do not take countermeasures," Fauci said. Fauci also noted that "the situation with coronavirus in the United States is out of control". "The coronavirus will remain with us for a long time until we take effective containment measures and develop a vaccine," the epidemiologist concluded. What is remarkable is that Fauci made these terrible statements to an Italian newspaper, not to an American publication. We have already drawn attention to the fact that the country's chief virus expert has abruptly stopped commenting on the pandemic. Regarding the causes of the new COVID outbreak, Fauci said that "the country and some states were in a hurry to lift all restrictions and resume economic activity, which led to new infections." Meanwhile, the White House, or better yet, Donald Trump personally, does not find a common language with Dr. Fauci. The country's chief epidemiologist has worked under six presidents, but (why aren't we surprised?) couldn't cooperate only with Trump. It is noted that the White House blames Fauci for many wrong statements. There is even a whole list of the scientist's sayings, which consists of excerpts from his previous interviews and comments. Sources close to Trump and Fauci claim that the President and the epidemiologist stopped communicating with each other a few weeks ago (just when Fauci abruptly disappeared from the air). At the same time, according to many publications and experts, the problem is not in the doctor's statements, but in the fact that these statements contradict the sayings of the US President. Fauci allowed himself to openly object to Trump, to disagree with his opinion. In response, Trump also began to criticize Fauci, saying that he made too many mistakes. However, as we can see, it is more likely that Trump can be accused of making too many mistakes on the issue of the pandemic. It is his underestimation that has led to more than 3 million people being infected in the United States. And from our point of view, such a confrontation with the country's chief epidemiologist will not benefit Trump. First, it's not Fauci who needs to be re-elected in November. Secondly, according to many sociologists, Americans trust Fauci's opinion more than Trump on issues of the pandemic (which is not surprising, given the number of "discouraging" statements by the leader of the nation). As a result, the United States continues to cause serious concerns, since it is not possible to stop the "coronavirus", but the "coronavirus" can calmly stop and paralyze the American economy. Today, Germany is scheduled to publish the consumer price index for June and several reports from the ZEW Institute, reflecting the mood in the business environment. In the European Union today, the report on industrial production for May with a forecast of +14.5% m/m, and in the United States - inflation for June with a forecast of 0.6% y/y. However, in the current conditions, traders of the euro/dollar pair are unlikely to pay attention to this data. As we have already said, inflation is now completely uninteresting to traders, since its fall or too strong growth is a normal phenomenon for any crisis. Industrial production is an interesting report, but everything will depend on how much the real value and forecast differ.
The volatility of the euro/dollar currency pair as of July 14 is 79 points and is characterized as "average". We expect the pair to move between the levels of 1.1291 and 1.1449 today. A new reversal of the Heiken Ashi indicator downwards will signal a new round of downward movement within the side channel. Nearest support levels: S1 – 1.1230 S2 – 1.1108 S3 – 1.0986 Nearest resistance levels: R1 – 1.1353 R2 – 1.1475 R3 – 1.1597 Trading recommendations: The EUR/USD pair continues to trade near the moving average line, inside a side channel with a slight upward slope. Thus, it is recommended to open long positions if traders manage to overcome the level of 1.1353, which is the approximate upper limit of the channel, with the goals of 1.1449 and 1.1475. It is recommended to open sell orders no earlier than the 1.1200 level with the goal of 1.1108. The material has been provided by InstaForex Company - www.instaforex.com |
| July 13, 2020 : EUR/USD Intraday technical analysis and trade recommendations. Posted: 13 Jul 2020 09:55 AM PDT
On March 20, the EURUSD pair has expressed remarkable bullish recovery around the newly-established bottom around 1.0650. Shortly after, a sideway consolidation range was established in the price range extending between 1.0770 - 1.1000. On May 14, evident signs of Bullish rejection as well as a recent ascending bottom have been manifested around the price zone of (1.0815 - 1.0775), which enhances the bullish side of the market in the short-term. Bullish breakout above 1.1000 has enhanced further bullish advancement towards 1.1175 (61.8% Fibonacci Level) then 1.1315 (78.6% Fibonacci Level) where bearish rejection was anticipated. Although the EUR/USD pair has temporarily expressed a bullish breakout above 1.1315 (78.6% Fibonacci Level), bearish rejection was being demonstrated in the period between June 10th- June 12th. This suggested a probable bearish reversal around the Recent Price Zone of (1.1270-1.1315) to be watched by Intraday traders. Hence, Bearish persistence below 1.1250-1.1240 (Head & Shoulders Pattern neckline) was needed to confirm the pattern & to enhance further bearish decline towards 1.1150. However, the EURUSD pair has failed to maintain enough bearish momentum to do so. Instead, a narrow-ranged bullish channel is being expressed while re-approaching the price levels of 1.1380-1.1400 where the upper limit of the channel is located. Please note that any bullish breakout above 1.1400 will probably lead to a quick bullish spike directly towards 1.1500. Trade recommendations : The current bullish movement towards the price zone around 1.1380-1.1400 should be watched cautiously by Intraday Traders for any signs of bearish rejection.T/P levels to be located around 1.1315, 1.1250 then probably 1.1175 while S/L to be placed above 1.1400 to minimize the associated risk. The material has been provided by InstaForex Company - www.instaforex.com |
| Posted: 13 Jul 2020 09:22 AM PDT The new week is very full of macroeconomic publications, including for the US. Traders are waiting for data on retail sales, which most likely increased on the restart of the economy. At the same time, consumer sentiment may have suffered due to the recent tightening of quarantine measures. The pandemic and the response from the US government will remain as the main driver of the currency market. The number of cases of coronavirus in the United States rose again over the weekend. Only Florida reported an increase of more than 15,000 per day. This is a record for any state, and it exceeded the peak level in April in New York. The World Health Organization has warned that the coronavirus pandemic could get even worse if all countries do not comply with basic health precautions. "Too many countries are moving in the wrong direction," Director General Tedros Adhanom Ghebreyesus said at a virtual WHO briefing in Geneva. According to Reuters, on Monday, the number of infected people in the world exceeded 13 million people, in just five days, the pandemic has claimed the lives of more than half a million people. Meanwhile, the dollar is losing for the fourth consecutive week. The greenback sharply fell by 0.3% against a basket of competitors on Monday evening. Investors continue to bet that the worst of the pandemic is already over and buy risky assets. Most market players are waiting for the continuation of the broad fall of the dollar. Today, traders also paid attention to the joint statement of the German biotech company BioNTech and the American pharmaceutical giant Pfizer. Two experimental vaccines against COVID-19 received accelerated review status. However, the protective functions of the US currency may still prevail. It is not just the deterioration of the epidemiological situation that will slow down the pace of economic recovery. Relations between the US and China are gradually heating up. The day before, US President Donald Trump said that he was not even thinking about negotiations on the second phase of the trade deal, as the countries' relations were seriously damaged due to the situation with the coronavirus. This gave investors new ground to think about. Now they believe that the fragile trade truce that was signed earlier will fall apart before the end of the year. The prospect of a trade war may be the main fundamental trigger for the long-term growth of the US dollar. Traders need to monitor the level of 95.70 on the dollar index. While it is trading higher, the dollar bulls have more chances to maintain the initiative. USDX If the macroeconomic environment deteriorates, the Federal Reserve, as promised, will resort to additional stimulus measures. New volumes of liquidity will appear on the market, which in the recent past have already provoked a sell-off of the dollar. Now the interbank market in London and New York is experiencing a negative situation for the US currency. In London, the three-month Libor rate updated its low for the last four years and came close to the upper limit of the Fed's rate range – 0.25%. This suggests that European banks do not feel a shortage of dollars. In New York, the regulator canceled REPO auctions, as there were no requests for refinancing from commercial banks. There is a lot of money, and bankers do not have problems with dollar liquidity. The material has been provided by InstaForex Company - www.instaforex.com |
| Evening review on EURUSD for July 13, 2020 Posted: 13 Jul 2020 08:57 AM PDT
EURUSD: The euro attempts on another upward trend and the question of whether the euro will be able to break above 1.1370 and gain a foothold above is currently being solved. Last week, the euro attempted to maintain an upward trend and aimed for a higher position. This, however, was not achieved. In the morning, we entered the market from 1.1340. Stop at 1.1295. If in case the upward trend fails to carry through and a downward pullback takes place, sell from 1.1250. On July 15, Thursday, the ECB meeting is expected to take place and note that this will be important for the euro. An attempt to grow is a tab on strong statements from the ECB. The material has been provided by InstaForex Company - www.instaforex.com |
| July 13, 2020 : GBP/USD bulls are testing the mid-range level at 1.2650, would it hold ? Posted: 13 Jul 2020 08:52 AM PDT
The previous bullish breakout above 1.2265 has enhanced bullish movement up to the price levels of 1.2520-1.2590 where temporary bearish rejection as well as a sideway consolidation range were established (In the period between March 27- May 12). Shortly after, transient bearish breakout below 1.2265 (Consolidation Range Lower Limit) was demonstrated in the period between May 13 - May 26 denoting some sort of weakness from the current bullish trend. However, immediate bullish rebound has been expressed around the price level of 1.2080 bringing the GBPUSD back above the depicted price zone of 1.2520-1.2600 which failed to offer sufficient bearish rejection, and the broken uptrend line as well. Further bullish advancement was expressed towards 1.2780 (Previous Key-Level) where signs of bearish rejection were expressed. Short-term bearish pullback was expressed, initial bearish d located around 1.2600 and 1.2520. Moreover, another bearish Head & Shoulders pattern (with potential bearish target around 1.2265) was recently demonstrated around the same price the pair is approaching Today. Recent bearish persistence below 1.2500 ( neckline of the reversal pattern ) paused the bullish outlook for sometime & enabled further bearish decline towards 1.2265. However, last week, significant bullish rejection was originated around 1.2265 bringing the GBP/USD pair back towards 1.2600 - 1.2620 where a cluster of resistance levels are located. Signs of bearish rejection should be watched around the current price zone of 1.2620 - 1.2650 (Mid-channel zone) as it indicates a high probability of bearish reversal. Trade recommendations : Intraday traders can consider the current bullish pullback towards the depicted Supply Zone (1.2600-1.2650) for a valid SELL Entry. Stop Loss should betight, it can be placed above 1.2700 while initial T/P level to be located around 1.2450 & 1.2265. The material has been provided by InstaForex Company - www.instaforex.com |
| Posted: 13 Jul 2020 07:41 AM PDT Minute operational scale (H4) The top of the summer - what's next? Overview of the development options for the movement of AUD/USD & USD/CAD & NZD/USD (H4) on July 14, 2020. ____________________ Australian dollar vs US dollar From July 14, 2020, the development of the movement of the Australian dollar AUD/USD will be determined by the development and direction of the breakdown of the boundaries of the 1/2 Median Line channel (0.6945 - 0.6965 - 0.6980) of the Minuette operating scale - see the animated chart for details of this movement. In case of breaking the lower border of the channel 1/2 Median Line of the Minuette operational scale fork - support level of 0.6945, the movement of AUD/USD may continue to control line LTL Minuette (0.6945) and in the breakdown thereof, it will be possible to achieve the initial line of the SSL (0.6855) of the of the Minute operational scale fork. The breakdown of the resistance level of 0.0985 at the upper border of the channel 1/2 Median Line Minuette, followed by an update of the local maximum 0.7002, the upward movement of the Australian dollar can be continued to the borders of the equilibrium zone (0.7055 - 0.7085 - 0.7110) of the Minuette operational scale fork. The AUD/USD movement options from July 14, 2020 are shown on the animated chart.
____________________ US dollar vs Canadian dollar The development of the movement of the Canadian dollar USD/CAD from July 14, 2020 will be determined by the development and direction of the breakdown of the range:
If the resistance level of 1.3580 is broken, the USD/CAD movement will develop in the 1/2 Median Line Minuette channel (1.3580 - 1.3605 - 1.3635), and when the upper limit (1.3635) of this channel is broken, the price of the instrument can continue moving towards the boundaries of the equilibrium zone (1.3670 - 1.3715 - 1.3760) of the Minuette operational scale fork. If the support level of 1.3520 breaks through on the initial line of the SSL of the Minuette operational scale fork, the downward movement of the Canadian dollar can be continued towards the goals:
Options for USD/CAD movement from July 14, 2020 are shown on the animated chart.
____________________ New Zealand dollar vs US dollar The further development of the movement of the New Zealand dollar NZD/USD from July 14, 2020 will also depend on the development and direction of the breakdown of the range:
If the support level of 0.6540 will determine the movement of NZD/USD in the channel borders 1/2 Median Line (0.6540 - 0.6520 - 0.6500) and equilibrium zone (0.6490 - 0.6460 - 0.6430) of the Minuette operational scale fork. The breakdown of the initial line SSL of the Minuette operational scale fork - resistance level of 0.6589 - and then updating the local maximum 0.6598 and breakdown of the control line UTL (0.6610) of the Minuette operational scale fork will be the actual continuation of the upward movement in the NZ dollar to the borders of the channel 1/2 Median Line (0.6655 - 0.6705 - 0.6765) of the Minute operational scale fork. The marking of options for the movement of NZD/USD from July 14, 2020 is shown on the animated chart.
____________________ The review is compiled without taking into account the news background, the opening of trading sessions of the main financial centers and is not a guide to action (placing "sell" or "buy" orders). The material has been provided by InstaForex Company - www.instaforex.com |
| GBP/USD. Tomorrow's economic release may boost pound sterling Posted: 13 Jul 2020 07:37 AM PDT Today, currency pairs of the so-called "major group" showed relatively weak volatility. Only the euro/dollar pair is trying to rise ahead of the EU summit, which is due to take place at the end of this week. The rumors preceding this event are encouraging: the parties are likely to agree on a 750-billion-euro anti-crisis plan of the European Commission. This general confidence (in my opinion, it is premature) pushed the euro up, including against the US dollar. On Monday, the pound/dollar pair also traded well during the Asian session. The pair once again tested the resistance level of 1.2660 (the upper line of the Bollinger Bands indicator on the daily chart). However, at the beginning of the European session, the price fell. The pound/dollar bears are very phlegmatic, but still persistently trying to return the pair to the area of the 25th pattern. In general, market participants took a wait-and-see approach. Traders have no intention to open positions on Monday against the background of almost empty economic calendar. Today, a speech of the head of the Bank of England, Andrew Bailey is the most significant event. Andrew Bailey will take part in a webinar organized by the Federal Reserve Bank of New York. However, during such events, regulators rarely voice specific intentions in the context of the monetary policy prospects (as a rule, only advantages and disadvantages of a particular scenario). Therefore, Bailey will hardly influence pound/dollar traders today. However, tomorrow, the UK will publish preliminary data on the British GDP in May. This release is very important. The fact is that the previous report reflected the peak of the coronavirus crisis. Notably, in April, the UK's economy shrank by 20.4%. It was the largest drop in the country's history. Significant losses were also recorded in imports and exports, while the air transport sector collapsed immediately by 92%. Due to the closure of hotels, bars and restaurants, the services sector declined by 88%. Almost all sectors of the country's economy have been affected by the coronavirus crisis. The industrial production indicator also showed an anti-record (-20.3%), and the manufacturing production decreased by almost 30% on a yearly basis. Data on unemployment and inflation only added fuel to the fire. Thus, the number of applications for the unemployment benefits jumped to 528 thousand. Data on wages also came out in the red zone both on the annual and monthly basis. The above figures reflect the April peak of the coronavirus crisis. In May, the UK began to gradually come out of the quarantine, so traders expect to see signs of recovery in the country's economy. Otherwise, the pound sterling may again be under significant pressure. According to preliminary estimates, in May, GDP recovered to 5.5% on a monthly basis. However, on a yearly basis, the indicator declined to -17.5%. In addition, the UK industrial production data will be published tomorrow. Markets expect that it will grow by 6.2% on a monthly basis and drop by 21.2% on a yearly basis. The country's manufacturing production also advanced by 7.5% on a monthly basis and declined by 24.2% on a yearly basis. The monthly and annual dynamic of activity in the country's construction industry will also be published tomorrow. Thus, the indicator may rise on both annual and monthly bases. In other words, traders are expecting a weak but still positive trend. In May, Britain started easing quarantine restrictions, so investors do not expect any breakthrough. The trend is really important. If the indicators enter the "green zone", the pound/dollar pair may again test the resistance level of 1.2660 and even approach the 27th pattern. Otherwise, bears will send the price towards the 24th price level. In my opinion, in any case, only short positions should be opened. The fact is that the issue of further relations between London and Brussels is still hanging in the air. Despite the ongoing negotiations, British Prime Minister Boris Johnson goes on repeating that his country is ready to trade with the EU under the rules of the World Trade Organization. Just a few days ago, the head of the British government announced this to the German Chancellor during a telephone conversation. At the same time, recent surveys showed that no more than 30% of the British companies are ready for the so-called "Australian scenario" (in which almost all types of goods are traded under the WTO rules). Thus, traders ignored the issue. However, the situation may change dramatically as soon as representatives of the negotiating groups meet again. In the near future, the parties are unlikely to please us with a breakthrough in the negotiation process. This means that the growth of the pound/dollar pair is temporary, and therefore, long positions still look risky. Thus, it is recommended to sell the pair from the current positions or from the resistance level of 1.2660 (the upper line of the Bollinger Bands indicator on the daily chart). The material has been provided by InstaForex Company - www.instaforex.com |
| Posted: 13 Jul 2020 07:10 AM PDT
The price of gold rose rapidly on Monday which only strengthened its position at strategic levels above $ 1,800 per troy ounce. The coronavirus pandemic does not in any way frighten precious metals, but only makes its position more stable and firm. Meanwhile, COVID-19 continues to spread at a record pace not only throughout the United States but throughout the world. On Friday new record-breaking COVID-19 cases were recorded in the US alone with 63,000+ in just a day. Gold futures became more expensive this morning by 0.59% and were able to rise to the level of $ 1,812.55 per troy ounce. This well strengthened it above strategically important for the further rise of the precious metal mark at $ 1,800 per troy ounce. The tension in the situation with the spread of coronavirus infection acts as a support on the precious metal, acting as a good support factor. At the same time, analysts believe that there is no reason to doubt the stability of gold growth and that one can continue to hold long positions with confidence in a positive future outcome. As long as the resistance level is above $ 1,765 per troy ounce, the assets of investors in gold will remain safe. At the same time, news about the development and active testing of a vaccine against COVID-19, on the contrary, acts as a growth restrictor for precious metals. Investors can change their high spirits and move on to taking profits in the gold market. However, an unexpected wave of another escalation of the conflict between the United States of America and China, which began today, is also beneficial for gold. A new sanctions list with the names of three more officials from China entered there is presented today in America. In addition, the reluctance so far to conduct active negotiations on a trade agreement between the countries aggravates the situation. Investors are beginning to gravitate to the gold market, even more, trying to take refuge in a "safe haven." The rising price of precious metals can positively affect the movement of other metals, Most particularly the silver. In the meantime, its ratio with gold continues to be consolidated within the minimum values of 1:97 in the entire history. Many experts believe that in the near future there should be a correction to the level of 1:90, which means that the price of gold can still change the vector and drop slightly. However, there are no apparent reasons for the fall yet. The price of silver has increased by 2.04%, which moved its level to $19.05 per troy ounce. The price of palladium also increased by 0.56%, which sent it to the mark in 1981.13 per ounce. Platinum became the leader of the upward trend as it managed to increase 3.47% and reach the mark of $842.77 per ounce. The material has been provided by InstaForex Company - www.instaforex.com |
| Global stocks rise amid anticipation on new statistics Posted: 13 Jul 2020 05:25 AM PDT
The Asia-Pacific stock markets moved on to building major indexes on Monday. The positive dynamics were due to satisfactory forecasts on the global economy's growth and recovery. However, this growth is limited by the rapid increase in the number of COVID-19 cases around the globe, which may hinder prospects of an immediate return to pre-crisis levels. Market participants are waiting for statistics that will reflect changes in China's GDP for the period of April to June this year. Meanwhile, investors are interested in the report on the foreign trade balance, production, and level of investment. In addition to the PRC, Singapore will also present its statistics on the level of GDP, which also arouses the curiosity of traders. Most experts are sure that serious negative changes in the global GDP level for the second quarter of this year should not occur since it was then that the Chinese economy opened after quarantine under COVID-19, and it is known to be the second-largest economy in the world. At least, no extremely negative factors indicating a decline have yet been found. Other important events expected this week will be the meetings of the Central Bank of some countries of the world, including the main regulators of Japan and Europe, which are also closely focused on the views of investors. Market participants are aware of the coming reporting season which may result to be very unexpected. Japan's Nikkei 225 Index gained 2%. The securities of the automaker Mazda Motor took the lead increasing immediately by 8.4%. Other companies in this sector also showed very good results. The China Shanghai Composite Index went up 2.1%. It was followed by the Hong Kong Hang Seng Index which rose to 1.4%. The largest gains here were recorded at Geely Automobile Holdings, whose stock price rose immediately by 8.9%. The Kospi South Korea Index also supported positive momentum and added 1.7% to the previous level. Here, electronics manufacturers have become growth leaders: Samsung Electronics Co. Securities began to cost more by 1.7%, shares of Sharp Corp. increased in price by 2.4%, while LG Electronics rose by 1%. Australia S & P / ASX 200 also went up by 0.9%. The value of shares in the world's largest mining companies BHP Group and Rio Tinto first went up by 2%, and then followed by 1.8%. The US stock exchange also went on a positive trend. The main indices are increasing, mainly due to the news about the successful testing of the vaccine against coronavirus infection. Particularly noteworthy is the rise in the Nasdaq index, which again crossed the border of its record level, which was the third significant growth in a row. On Friday, pharmaceutical company Gilead Sciences Inc. from the United States of America issued a statement stating that the trials of a vaccine against coronavirus infection, which can reduce the death rate from the virus by 62% in the most severe cases of the disease, have been successfully passed. In addition, another vaccine, which is a joint development of the American and German companies, is also actively preparing to receive all the necessary certificates from the official authorities in order to be used for treatment in medical institutions. According to preliminary forecasts, it is expected to be approved for use in December this year. Coronavirus statistics in the United States and other parts of the world remain not so encouraging at all. Last Friday, 63,000 new infections were recorded in America alone. This totals to approximately 3.1 million infected cases with 133,000 fatalities. The situation is strained by clarifying the sanctions list submitted by official US authorities. In the latest reports, three more officials of the PRC were accused of reprisals against the Uyghur population, which is part of the state. Chinese colleagues hastened to answer that they also intend to take appropriate measures in relation to the United States. All this indicates a new wave of escalation of the conflict between the countries, which may undermine the positive mood of investors. American economic statistics are also making adjustments. Thus, the PPI index, which reflects the level of producer prices, over the past month decreased by 0.2% compared with the previous period with an increase of 0.4%. At the same time, preliminary forecasts of analysts, which indicated that an increase of 0.4% should also have occurred in June, did not materialize. The Dow Jones Industrial Average index rose 1.44% or 369.21 points, which allowed it to rise to a mark of 26,075.3 points. The Standard & Poor's 500 Index gained 1.05% or 32.99 points and was at 3,185.04 points. The Nasdaq Composite Index jumped 0.66% or 69.69 points, which moved it to the area of 10 617.44 points. Stock markets in Europe are also on the wave of positive. Growth is recorded in all major areas. Market participants are waiting for the next batch of statistics on the level of economic growth. However, growth here remains under the pressure of a false epidemiological situation in the world. The bullish trend, although it became apparent, could not be fully developed, since the spread of coronavirus infection continues to be recorded. In addition, investors are waiting for new statistics from the largest companies, which are expected to be released this week, as the reporting period begins. Another important event will be the ECB meetings and the summit of the Eurozone leaders. The plans of these events include discussion of the creation of an EU economic support fund of 750 billion euros. Recall that the creation of such a regulator has been negotiated for a long time, but until the matter has moved forward, there are no definite and clear agreements. The overall index of large enterprises of the European region Stoxx Europe 600 increased by 0.76% and was within 369.6 points. The UK FTSE 100 index rose 1.21%. The German DAX Index also went up by 1.12%. The French CAC 40 index showed a positive trend at 0.9%. The Italian FTSE MIB index added 0.57%. Spain's IBEX 35 index managed to increase by 1.21%. The material has been provided by InstaForex Company - www.instaforex.com |
| Posted: 13 Jul 2020 05:16 AM PDT
The US dollar is losing ground due to a rise in the number of coronavirus cases in the United States. The American currency has ceased to strengthen. The Japanese yen, instead, is resistant to shocks. In the United States, more than 60,000 new cases of COVID-19 are confirmed every day. This is the highest level during the entire pandemic period. This leap prevents some American consumers from returning to public places. Moreover, in Tokyo, Hong Kong and Melbourne, where it was previously possible to contain the infection, new outbreaks of coronavirus were registered again. This exacerbates the situation. However, the Japanese yen rose by 0.4% to 106.81 per dollar amid concerns. At the same time, the pound sterling, the Australian dollar and the Norwegian krone are losing ground. China's currency fell by 0.2% to 7.0098 yuan per dollar. However, last week markets saw growth thanks to a recovery in stock prices. Dmitry Vlasov, East Capital's portfolio adviser in Hong Kong, said there was a fairly large influx into fixed-income markets, as interest rate differences also lead to appreciation of the yuan. The material has been provided by InstaForex Company - www.instaforex.com |
| Will the "Australian" catch a fair wind? Posted: 13 Jul 2020 04:58 AM PDT When something goes wrong, it is better to exit the position or close part of it and wait for confirmation signals. More than 20% of the AUD/USD rally from the levels of the March bottom hit a wall of misunderstanding: despite the Reserve Bank's optimism and the impressive support of the Chinese stock market, the "Aussie" is in no hurry to go north. Hedge funds are afraid of a repeated lockdown of the entire economy of the Green continent and prefer to take a wait-and-see position. Especially since the release of data on the Australian labor market for June and the GDP of the Middle Kingdom for the second quarter can rock the boat in any direction. The second wave of COVID-19, contributing to the closure of the state of Victoria, which accounts for a quarter of the contribution to the gross domestic product, called into question the idea of a faster recovery of the Green continent's economy compared to its foreign counterparts. According to RBA Governor Philip Lowe, the return of GDP to the trend will depend on the localization of the coronavirus. Let the growth of leading indicators indicate that the worst for the world economy is over, and the recession in Australia was not as deep as expected. The Reserve Bank at its last meeting left the cash rate at the same level of 0.25% and did not use verbal interventions, although a few days before, its head noted that it is difficult to argue that the rate of the "Aussie" is overvalued. Investors are eagerly awaiting data on the Green continent's labor market, which is scheduled for release on July 16. In April-May, the country lost 800 thousand jobs, and the unemployment rate rose to 7.1%. In June, experts expect it to increase to 7.2% and forecast employment growth of 100 thousand. At the same time, Treasurer Josh Frydenberg claims that if you take into account people who left the idea of finding a job, the unemployment rate will be 13.3%. Dynamics of Australian labor market indicators
If the actual data on the labor market is better than the forecast, the "bulls" for AUD/USD will get a reason to attack. It is expected to continue after the release of statistics on Chinese GDP. The economy of the Middle Kingdom, after sagging by 6.8% in the first quarter, may grow by 2.1% y/y in the second. If it follows the path of a V-shaped recovery, the currencies of those countries for which China is a key trading partner and the main market will benefit. "Aussie" is on this list. The main problems for the Australian dollar could arise from the US stock market, but this is unlikely to happen. Yes, the number of infected COVID-19 in the US has exceeded 60 thousand per day, but the death rate does not want to grow. Yes, Wall Street Journal experts expect corporate profits to fall by 45% in April-June, but the spread of their forecasts is so large that the value of the median estimate is reduced. Moreover, the best data will support not only the S&P 500 but also the AUD/USD bulls. Technically, there is a consolidation on the daily chart of the pair, which sooner or later is replaced by a trend. A break in the resistance by 0.7 and 0.7055 will allow you to form long positions with a target of 161.8% on the AB=CD pattern. It corresponds to the level of 0.727. AUD/USD, the daily chart
|
| EUR/USD: coronavirus knocks USD down that is bullish to EUR Posted: 13 Jul 2020 04:42 AM PDT Last week, the US dollar was knocked down by a new surge in coronavirus cases in the US. It index retreated to the June lows, having shed 0.8% since early July. The US currency opened this trading week with a decline. At present, investors still neglect a resurgence of COVID-19 in the US. Nevertheless, this is poses a threat to a fragile recovery on the global economy, analysts at MUFG comment on the ongoing developments. On Sunday, Florida reported over 15,000 confirmed infection cases for the latest 24 hours. This is the record daily growth among American states since the outbreak in early spring. On the other hand, investors regained risk-on mood in light of the news from the US-based Gilead Sciences. The biopharmaceutical company announced on Friday that its antiviral treatment, remdesivir, enables a 62 percent reduction in the risk of mortality among heavy cases of COVID-19 compared with a standard care. Last week, the economic calendar did not contain meaningful data on the US economy. This week is loaded with macroeconomic data. The US is due to release data on consumer inflation, industrial production, and retail sales for June. Apart from the US data, traders await a survey on the eurozone's economic sentiment from ZEW experts, the monetary policy statement from the ECB meeting on July 16, and the summit of the EU leaders on July 17-18 July. The ECB is likely to make cautious remarks on a recovery in the eurozone's economy at its regular policy meeting on Thursday, analysts at KBC say. The regulator will hardly venture to change its stance under the current conditions. However, the central bank could send a clear message that it is ready to introduce extra stimulus measures if necessary, they added. Experts at Danske Bank do not expect any revision in monetary policy this week. Therefore, the ECB is unlikely to come up with the dovish stance under ongoing programs like PEPP and APP aimed at injecting liquidity. The market has already priced in the current ECB monetary policy. In this context, EUR/USD will depend on the fashion and pace of the global economic recovery. The US dollar will be more vulnerable to the gloomy prospects worldwide, thus giving in to the single European currency. EUR/USD rebounded after hitting a local low at near 1.1265 on Friday. The currency pair extended its climb for a while. The bulls are still waiting for a clear-cut break of 1.1350 to enter the market with long positions. The bullish energy will open the door for the pair to the highs of the last week at near 1.1370 and later towards the round level of 1.1400. From this level, the way will be free to the strongest levels of this year slightly below the key psychological level of 1.1500. Alternatively, in case the pair retreats to the level below 1.1300, the sellers will enter the market at the level of about 1.1250. If this level is breached, the pair will come under stronger selling in the area of 1.1215 – 1.1220. Later, the pair could find support at 1.1200, 1.1170, and 1.1100. Last but not least, an important 200-period moving average is seen at near 1.1045. The material has been provided by InstaForex Company - www.instaforex.com |
| Posted: 13 Jul 2020 04:18 AM PDT EUR / USD On July 10, the EUR/USD pair gained about 15 basis points and thus continues the process of building the expected wave 5 in C in B. The entire wave 5 in C in B can be very long and complex, since at this time the markets are trading very chaotically. However, the current wave markup has not yet been canceled and will remain operational until a successful attempt to break the minimum of the assumed wave 4. Fundamental component: On Friday, there was little economic news from the United States and the European Union. Nevertheless, markets are still very seriously monitoring data on the incidence of coronavirus in the United States. The number of infected Americans is growing exponentially, at least 60 thousand new cases have been recorded daily in recent days. It should be noted that in Europe, it is still possible to restrain the spread of the COVID-19, so the situation there is now relatively calm, although there are reports of new non-large-scale outbreaks from time to time. Nevertheless, it is America that is currently causing the greatest concern. The number of infections is growing more than in 33 states. In three states, hospitals no longer have enough beds for all patients requiring resuscitation. Country Chief Epidemiologist Anthony Fauci, who predicted +100,000 patients every day for two more weeks and claimed that the epidemic had gotten out of control, spoke again, saying that the world was only at the beginning of the epidemic, the virus had not gone away and had not weakened, and countries needed to take restraining measures. And it is America that can be the first to face the consequences of the second wave. There may not be another "lockdown", however, business and economic activity may begin again to seriously decline. The population, fearing for their health and lives, will not seek to go to work and lead an active lifestyle. Thus, instead of the economic recovery announced by Donald Trump, the United States may face a new drop in GDP and other indicators. In addition, countries can be overwhelmed by the health crisis, since hospitals may simply not cope with the influx of patients. Everything that happens in the United States will clearly not help Donald Trump to be re-elected in November. General conclusions and recommendations: The euro/dollar pair presumably continues to build the rising wave C to B. Thus, I recommend buying the instrument with targets located near the calculated levels of 1.1406 and 1.1570, which equates to 161.8% and 200.0% Fibonacci for each signal "up" MACD calculated on the construction of wave 5 in C in B. GBP / USD On July 10, the GBP/USD pair gained another ten basis points, so the current wave counting has not changed at all. I still expect the building of upward wave 5 as part of the upward trend. The minimum goal of this wave is located near the wave peak 3 or C. On the other hand, a successful attempt to break through the level of 1.2816 will indicate the readiness of the markets for further buying the pound. Fundamental component: Nothing interesting happened again in the UK on Friday. The latest news is about a new UK economy program that the UK government has planned. There is no new information on negotiations with the European Union. There were no economic reports on Friday and Monday. Thus, the current wave marking suggests the continuation of the construction of the upward trend section and the news background does not interfere with this yet, although the markets may at some point recall that there are not many reasons for buying the pound now. And even though information about the high degree of coronavirus infection in the United States seems more important for the markets now. General conclusions and recommendations: The pound/dollar pair has greatly complicated the current wave marking, which now involves the construction of a new upward wave. Therefore, I recommend buying the instrument at this time with targets near the levels of 1.2816 and 1.2990, which equates to the peak of wave 3 or C and 100.0% Fibonacci. The material has been provided by InstaForex Company - www.instaforex.com |
| GBP/USD: plan for the American session on July 13 Posted: 13 Jul 2020 03:54 AM PDT To open long positions on GBPUSD, you need: In the first half of the day, I paid attention to the resistance level of 1.2666, from which I recommended opening short positions when forming a false breakout. If you look at the 5-minute chart, you will see how the bears began to actively act when approaching this level at the beginning of the European session and already on the second wave of growth, they did not even allow the bulls to test the area of 1.2666. After that, an active decline in the pound began, and then there was a breakdown of the support of 1.2619, below which the bears are now trying to gain a foothold. If the pressure on the pound persists in the second half of the day, it is best to return to long positions only for a rebound from the support of 1.2569, which acts as the lower border of the side channel, in the expectation of a correction of 20-30 points within the day. An equally important task remains for buyers to return to the middle of the channel of 1.2619, below which they are currently trading. As soon as this happens, we can expect a second wave of growth to the maximum of 1.2666 and its breakdown, which opens up real prospects for updating the level of 1.2742, where I recommend fixing the profits.
To open short positions on GBPUSD, you need: Bears need to keep the market under their control. The bottom-up test of the level of 1.2619 will be an additional signal to open short positions. However, it is important to understand that the movement of the pound down, after the repeated update of the area of 1.2619, should be quite rapid. Otherwise, the bulls will regain this area, which will cancel all plans for further reduction of the pound. While trading will be conducted below the range of 1.2619, you can also count on the continuation of the decline of GBP/USD in the area of the lower border of the side channel 1.2569, the break of which will open a direct road to the minimum of 1.2511, where I recommend fixing the profits. In the scenario of the bulls returning to the resistance of 1.2619, it is best to postpone short positions until the maximum of 1.2666 is updated or sell immediately for a rebound from the new area of 1.2742 in the expectation of a correction of 20-30 points within the day.
Signals of indicators: Moving averages Trading is conducted in the area of 30 and 50 daily averages, which indicates the lateral nature of the market. Note: The period and prices of moving averages are considered by the author on the hourly chart H1 and differ from the general definition of the classic daily moving averages on the daily chart D1. Bollinger Bands Breaking the upper limit in the area of 1.2666 will lead to a new wave of growth of the pound. A break in the lower border at 1.2595 will increase the pressure on the pound. Description of indicators
|
| EUR/USD: plan for the American session on July 13 Posted: 13 Jul 2020 03:50 AM PDT To open long positions on EURUSD, you need: From a technical point of view, there were no changes. Buyers failed to reach the resistance of 1.1347 to form anything on it. Sellers did not reach the support level of 1.1295, where they could expect a false breakout. Low volatility in EUR/USD may continue in the second half of the day due to the lack of fundamental statistics. Buyers will still aim for a breakout and consolidation above the resistance of 1.1347, which will lead to a larger upward trend in the area of the maximum of 1.1395 and 1.1430, where I recommend fixing the profits. In the case of a downward correction of the pair in the second half of the day, only the formation of a false breakout in the support area of 1.1295 will be a signal to open long positions. I recommend buying EUR/USD immediately for a rebound only from a minimum of 1.1257, based on a correction of 30-40 points within a day. To open short positions on EURUSD, you need: The task of sellers has also not changed. They need to return the range of 1.1295, however, it is best to open short positions from it only after fixing under this area. Only such a scenario will return EUR/USD to the area of the minimum of 1.1257 and allow you to count on updating the support of 1.1222, where I recommend fixing the profits. If the bulls continue to be active, then it is best to look at short positions only after forming a false breakout at the level of 1.1347, which they did not reach today in the first half of the day. But you can only sell EUR/USD immediately on a rebound from a larger maximum of 1.1395, counting on a correction of 25-30 points within the day.
Signals of indicators: Moving averages Trading is just above the 30 and 50 daily moving averages, which indicates the sideways nature of the market. Note: The period and prices of moving averages are considered by the author on the hourly chart H1 and differ from the general definition of the classic daily moving averages on the daily chart D1. Bollinger Bands A break in the lower border of the indicator at 1.1295 will increase the pressure on the euro. Growth above the upper limit at 1.1335 will lead to bullish momentum. Description of indicators
|
| Posted: 13 Jul 2020 03:39 AM PDT Technical analysis:
EUR/USD has been trading upwards most recently but the resistance at the price of 1,1330 is on the test and I see potential for the downside rotation. Trading recommendation: Due to the breakout of the rising channell in the background from the last week and test of resistance, I see potential for the drop towards the 1,1258 and 1,1200. Watch for potential selling opportunities on the rallies using the 5/15 minutes time-frame for better entry location. Downward targets are set at the price of $1,1258 and 1,1200. The material has been provided by InstaForex Company - www.instaforex.com |
| Posted: 13 Jul 2020 03:33 AM PDT Technical analysis:
Trading recommendation: Watch for potential selling opportunities on the Gold with the downside targets at the price of $1,796 and $1,790. The material has been provided by InstaForex Company - www.instaforex.com |
| Trading recommendations for the EUR/USD pair on July 13, 2020 Posted: 13 Jul 2020 03:31 AM PDT Last trading week passed in a phase of high fluctuations, but with all this, the movement remained horizontal. This is because speculative activity was concentrated in the upper part of the flat 1.1180 / 1.1250 // 1.1350, where a V-shaped pattern was formed twice, which did not lead to anything cardinal. The most remarkable surge in activity was observed on July 8 and 9, which suggests that the market is evolving and could lead to many trading strategies. Thus, for the development of the market, the first plan is a horizontal move, the duration of which has already occurred more than a month. This means that the upward measures from the end of May no longer play a major role in the development of quotes. However, it is not clear how long the quote will trade in the side channel because in the case of an upward movement, there is the conditional limit in the form of the 1.1440 / 1.1500 area, a breakout from which will lead to changes in the medium-term trend. Meanwhile, for a downward move, the market needs to reduce sales of the US dollar, and then overcome the area 1.1165 / 1.1180 / 1.1190. Analyzing the trading last Friday in detail, we can see that a round of long positions arose at the start of the European session, which led to the quote moving to the value of 1.1324. After which there was a rollback towards the variable level of 1.1300. It led to a volatility of 69 points, which is 12% lower than the average daily dynamics. Nevertheless, activity is within the normal range for the European currency, in which if we analyze the hourly dynamics, we will see an acceleration and speculative mood. As discussed in the previous review, many traders were waiting for a consolidation lower than 1.1250 to open more short positions. However, such a scenario did not happen so local long-term operations were worked out instead towards 1.1300. Analyzing the trading chart in general terms (daily period), we can see that since the beginning of 2020, the EUR / USD pair has had five inertial movements, the last of which arose just before the formation of the current flat. Based on its sequence, we can assume that today's horizontal course is a kind of platform for preparing a new jump in activity. The news published last Friday included an encouraging data on industrial production in Italy and France, which showed that there is a gradual but still recovery, greatly pleasing investors. France, in monthly terms, has grown 19.6% in May, up from a forecast of 15.1%, while Italy set a record, listing a growth of 42.1%, much higher than the forecast of 22.8% It led to an increase in the European currency last week. The data on producer prices in the United States also helped the euro rise. According to the report, the indicator remained at the same level of -0.8%, which contributed to the weakening of the US dollar as experts predicted the index to rise from -0.8% to -0.2%. Meanwhile, concerns about the recession in the European Union remains, which was voiced by the European Commissioner for Economics Paolo Gentiloni on Saturday. "The recession is becoming deeper than expected, and the differences in the economic development of the eurozone countries are becoming more significant than anticipated. We've always confirmed that the recession caused by the pandemic threatens to tear the eurozone apart, "Gentiloni said. To alleviate the problem, the European Commission issued recommendations to EU member states and European businesses to help prepare for the economic upheavals and trials that will occur after December 31, when the Brexit transition period ends. Macroeconomic reports for Europe and the United States are scarce today. What traders are anticipating the most is the final data on US inflation, which will be published tomorrow. Further development Analyzing the current trading chart, we can see that the week began with a local rise in the euro, from which the quotes managed to overcome Friday's high during the Asian session. However, as soon as the European session began, everything changed, and the quotes rushed down, which directly reflects the speculative mood in the market. Since the fluctuations last week have high amplitudes, there is a chance that the channel 1.1250 / 1.1350 (+/- 30p) will remain, and this indicates a downward cycle. Thus, if the quote consolidates below 1.1300, the pair will move to the average level of 1.1250, where a rebound may occur. The quote may also move within the narrow range 1.0300 / 1.1340, which will indicate the readiness of market participants with regards to the upcoming US inflation data. Based on the above information, consider this trading recommendation: [Sell positions lower than 1.1300, with the prospect of a move towards 1.1260] Indicator analysis Analyzing the different sectors of time frames (TF), we can see that the indicators of technical instruments in the hourly and daily periods signal buy but are on the verge of changing into sell, due to the return of prices in the level of 1.1300. Minute intervals, on the other hand, already signal sell due to a surge in short positions during the start of the European session. Volatility per week / Measurement of volatility: Month; Quarter Year The measurement of volatility reflects the average daily fluctuation calculated by Month / Quarter / Year. (July 13 was built, taking into account the time the article is published) The volatility at this current time is 35 points, which is 55% lower than the average daily value. Thus, it can be assumed that if the quotes consolidate lower than 1.1300, acceleration in the market may occur. Key levels Resistance Zones: 1.1350; 1.1440 / 1.1500; 1.1650 *; 1.1720 **; 1.1850 **; 1,2100 Support areas: 1.1250 *; 1.1180 **; 1.1080; 1,1000 ***; 1.0850 **; 1.0775 *; 1.0650 (1.0636); 1,0500 ***; 1.0350 **; 1,0000 ***. * Periodic level ** Range Level *** Psychological level The material has been provided by InstaForex Company - www.instaforex.com |
| Posted: 13 Jul 2020 03:15 AM PDT Technical analysis:
Trading recommendation: Watch for potential selling opportunities on the BTC due to fake breakout of the trading range and the supply trendline in the background. Downward targets are set at the price of $8,900 and $7,800. The material has been provided by InstaForex Company - www.instaforex.com |
| Technical analysis of EUR/USD for July 13, 2020 Posted: 13 Jul 2020 03:13 AM PDT The EURUSD pair continued to move upwards from the level of 1.1273. Last week, the pair has risen from the level of 1.1273 (the level of 0.9887 coincides with the ratio of 23.6% Fibonacci Expansion) to the top around 1.1321. In consequence, the EURUSD pair broke resistance at 1.1292, which turned into strong support at the level of 1.1292. In the H1 time frame, the level of 1.1292 is expected to act as major support today. Currently, the price is moving in a bullish channel. This is confirmed by the RSI indicator signaling that we are still in a bullish market. The price is still above the moving average (100). From this point, we expect the EURUSD pair to continue moving in the bullish trend from the support level of 1.1292 towards the target level of 1.1371 in order to test the double top. If the pair succeeds in passing through the level of 1.1371, the market will indicate the bullish opportunity above the level of 1.1371 so as to reach the second target at 1.1392. At the same time, if the EUR/USD pair is able to break out the level of 1.1273, the market will decline further to 1.1243 (daily support 2). The material has been provided by InstaForex Company - www.instaforex.com |
| You are subscribed to email updates from Forex analysis review. To stop receiving these emails, you may unsubscribe now. | Email delivery powered by Google |
| Google, 1600 Amphitheatre Parkway, Mountain View, CA 94043, United States | |

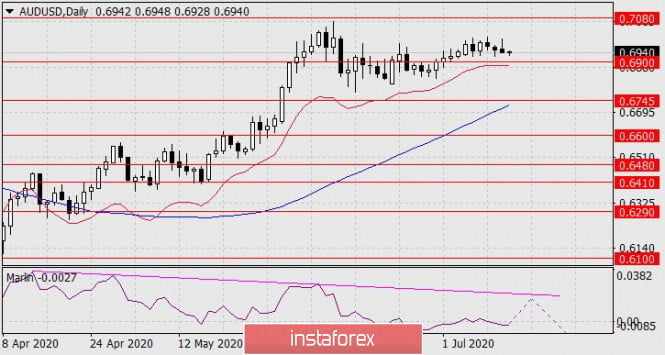
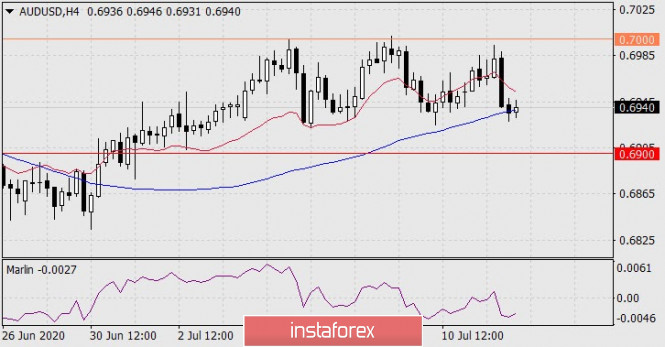
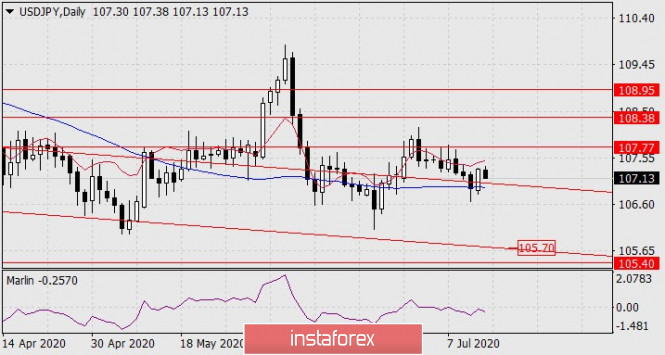
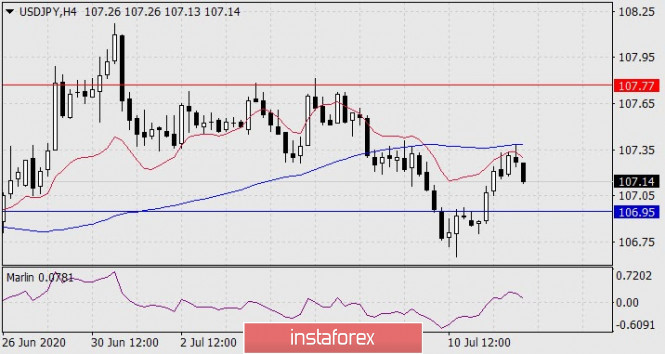
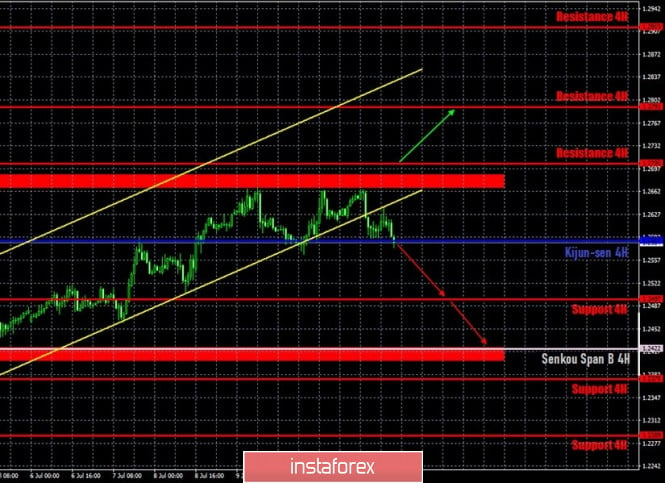
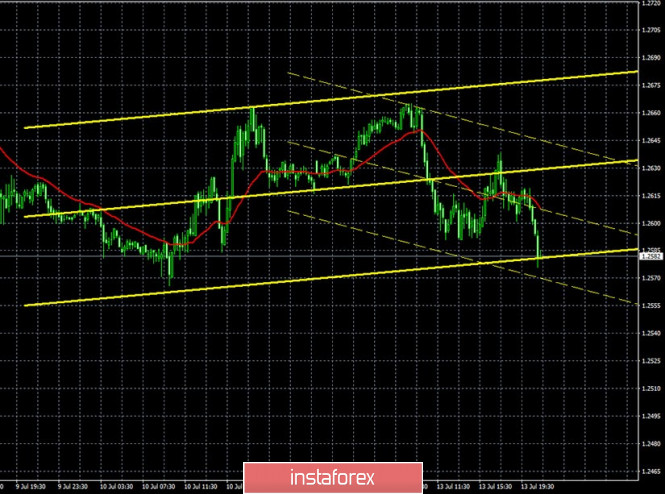
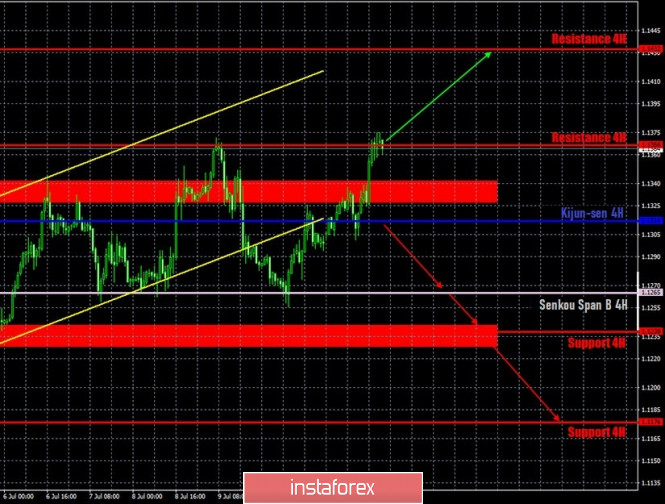
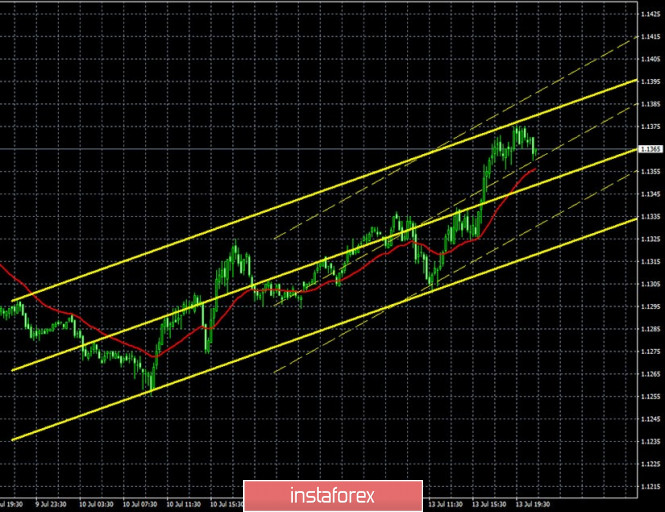
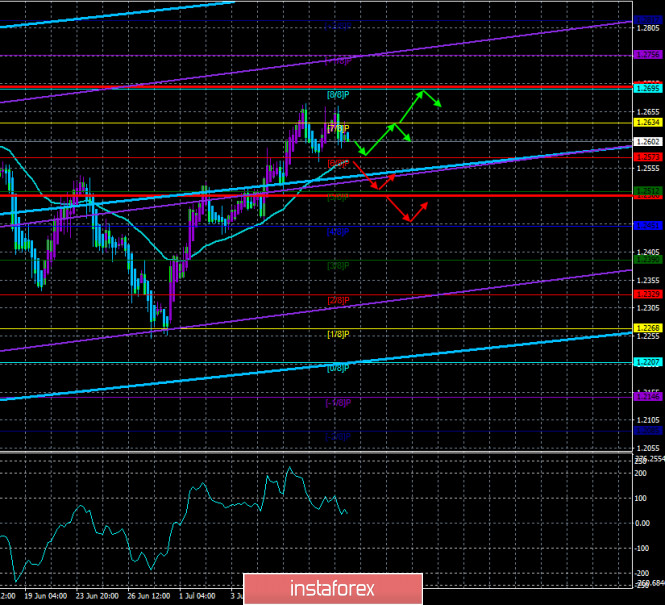
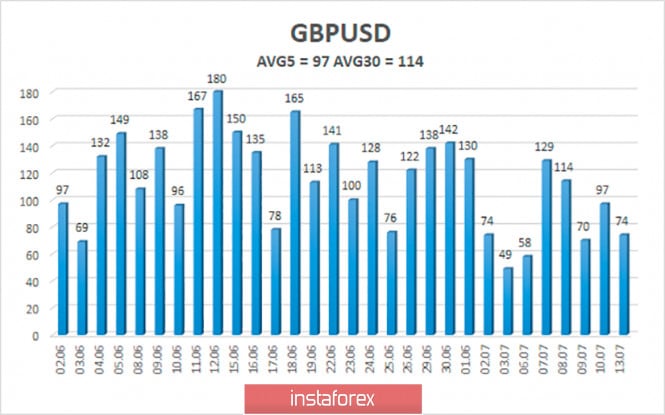
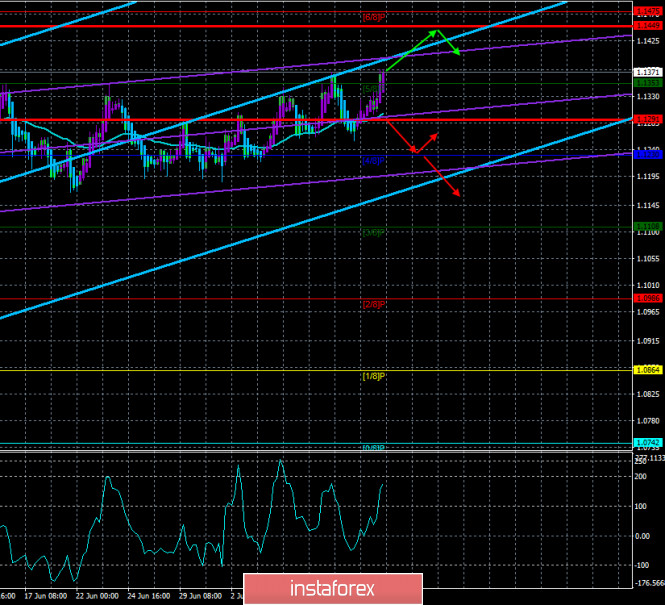
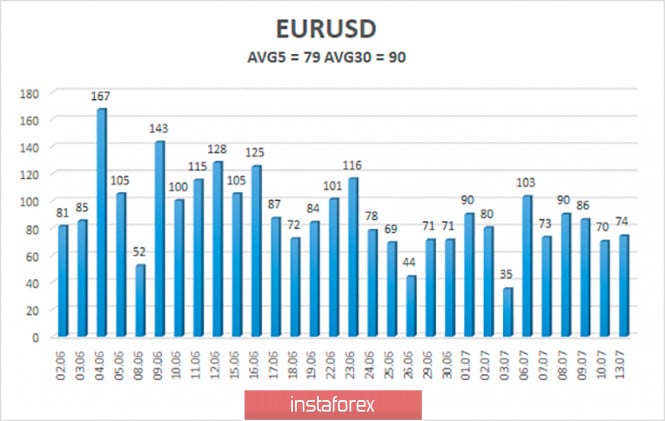
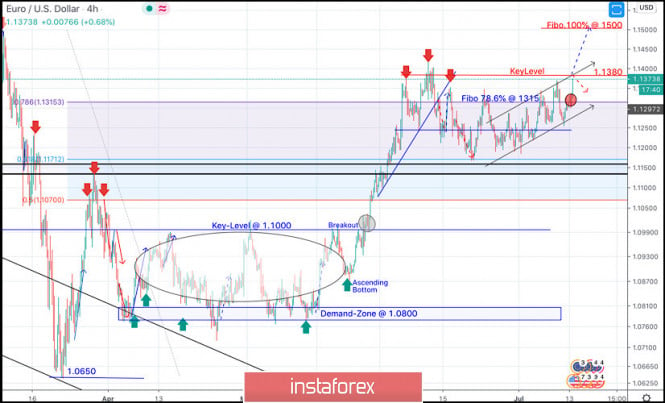

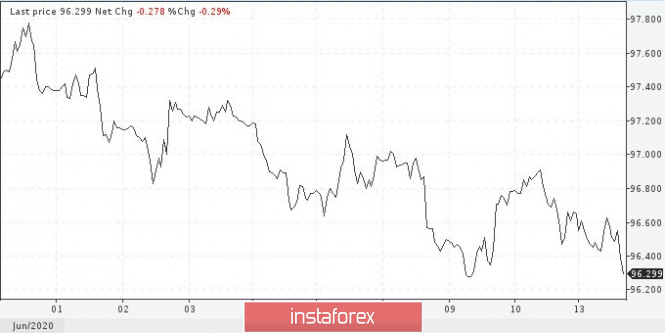
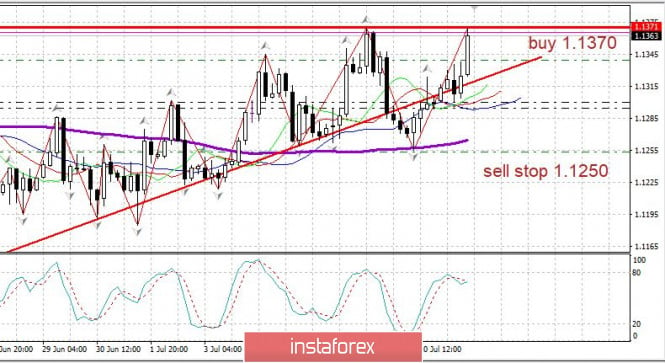
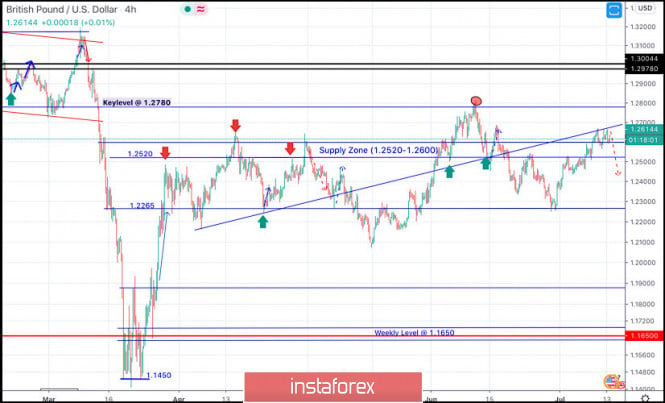
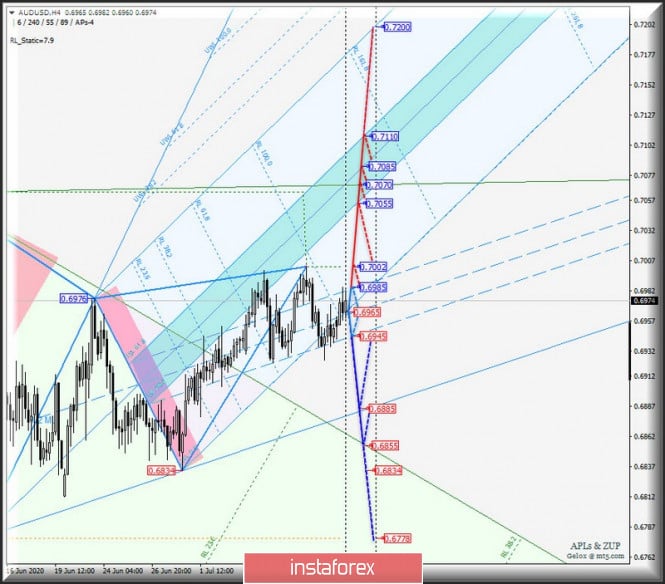
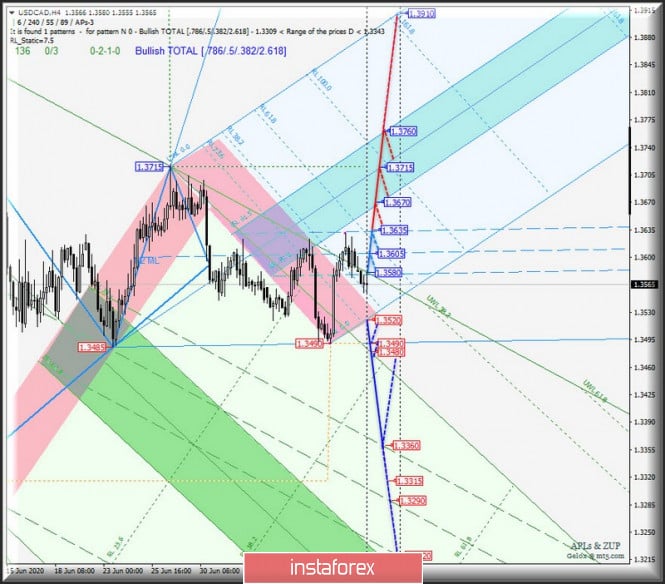
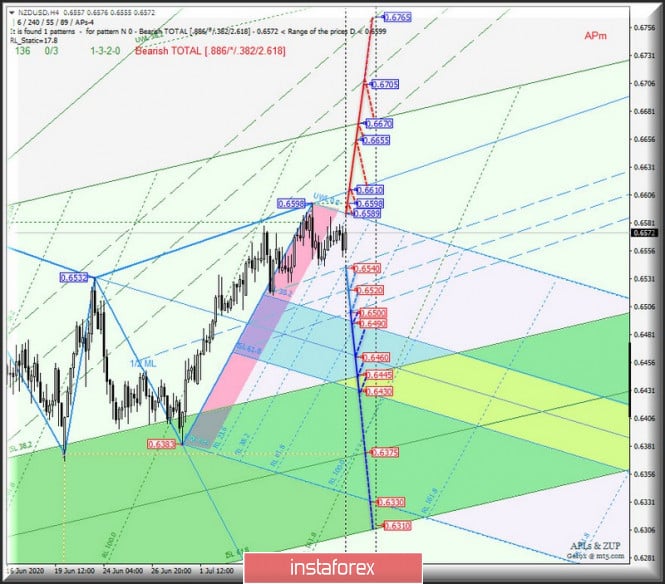
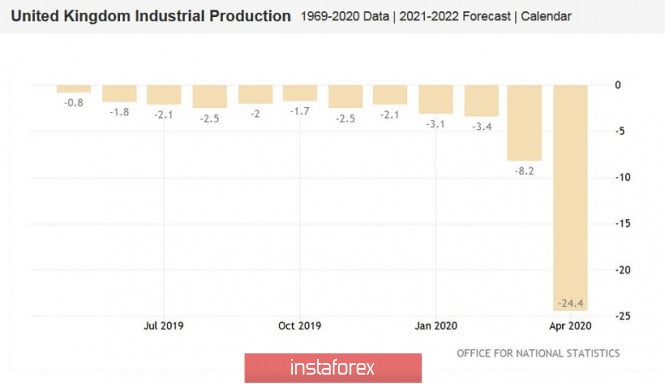



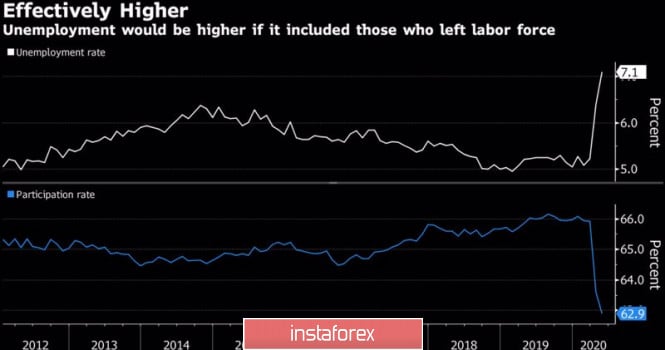
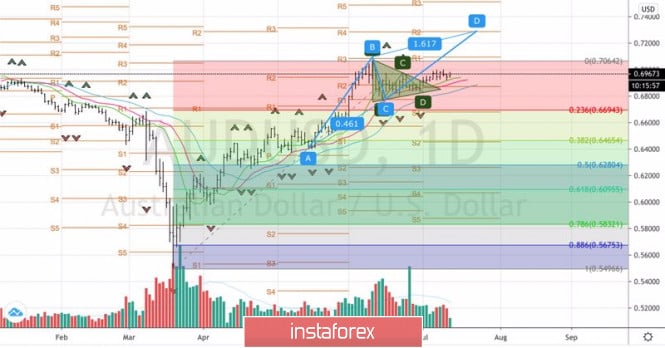
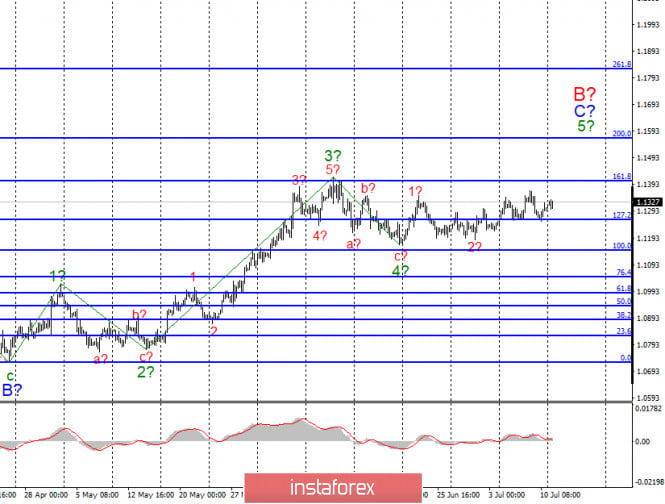
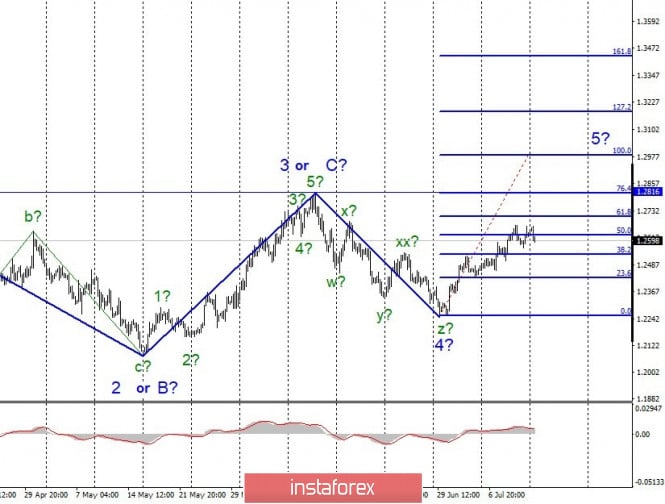
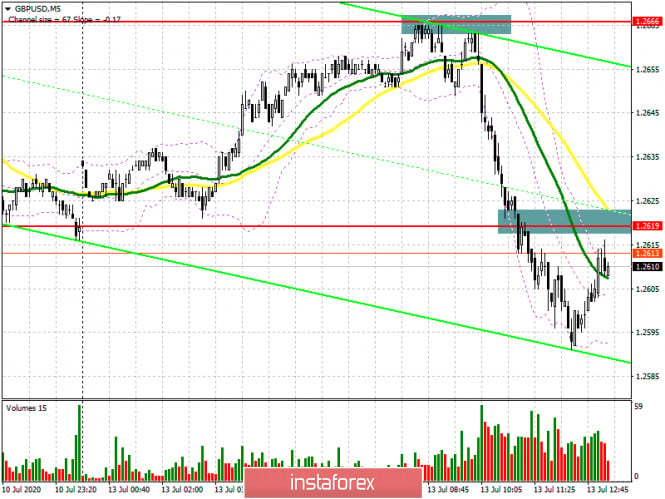
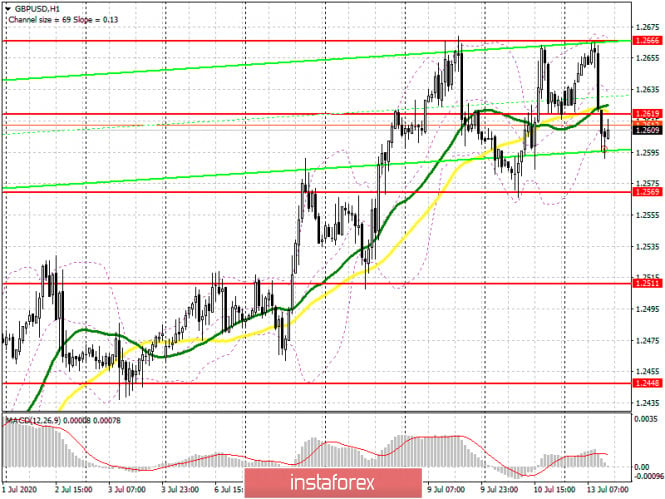
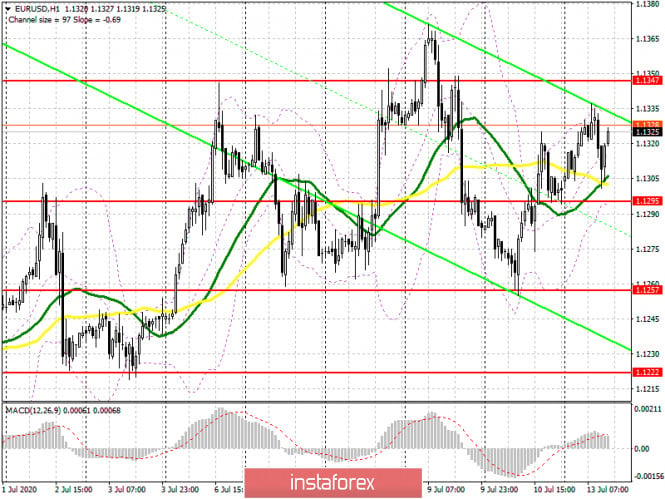
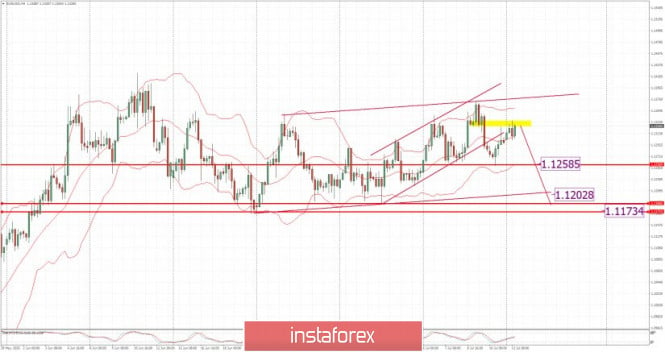
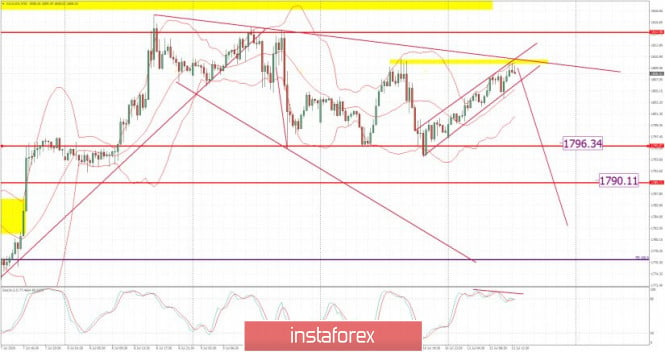

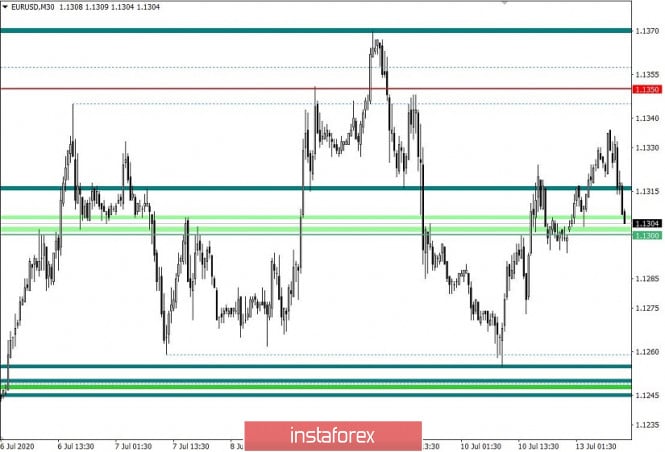
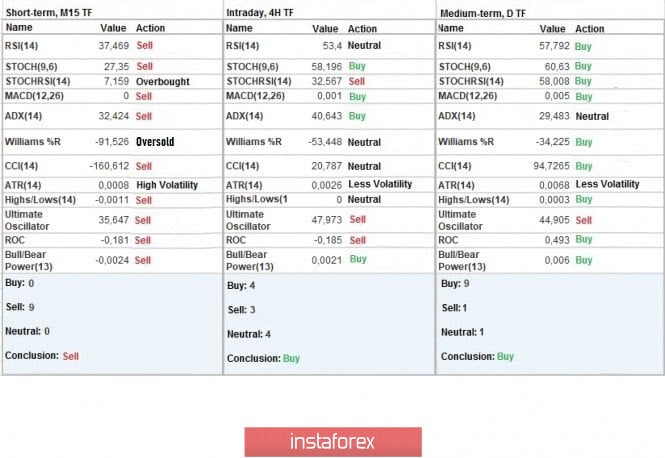
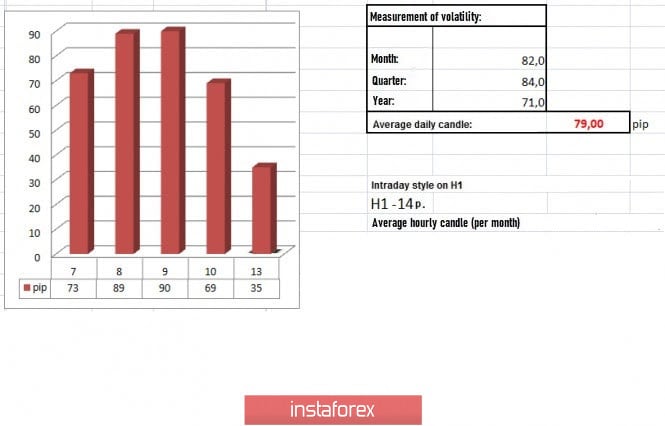
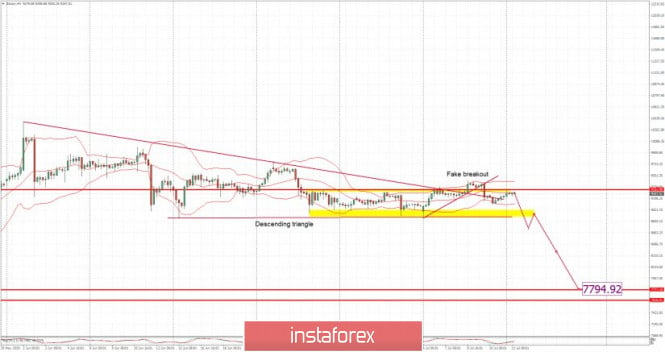
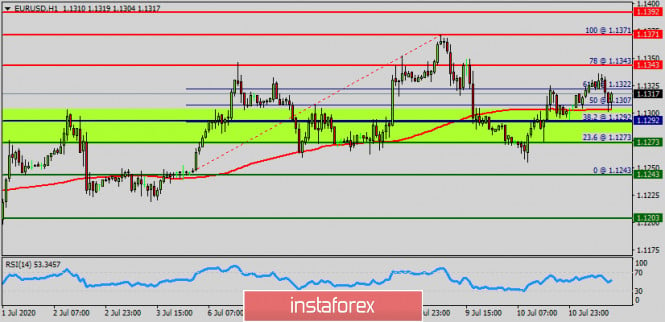
No comments:
Post a Comment