Forex analysis review |
- Forecast for GBP/USD on July 9, 2020
- USDCAD reversing off 1st resistance, more downside!
- Forecast for AUD/USD on July 9, 2020
- Forecast for USD/JPY on July 9, 2020
- GBPJPY holding above trendline support! Further rise expected!
- Overview of the GBP/USD pair. July 9. Boris Johnson's bluff in negotiations with Brussels is not a bluff, but a deliberate
- Overview of the EUR/USD pair. July 9. "Love triangle": China-USA-UK with the center in Hong Kong. Who is right and who is
- Hot forecast and trading signals for the EUR/USD pair on July 9. COT report. Bulls do not retreat, will not give up. Push
- July 8, 2020 : EUR/USD Intraday technical analysis and trade recommendations.
- Gold hits new highs
- Evening review on EURUSD for July 08, 2020
- EURUSD back tests triangle and bounces off support
- Gold price reaches second target area
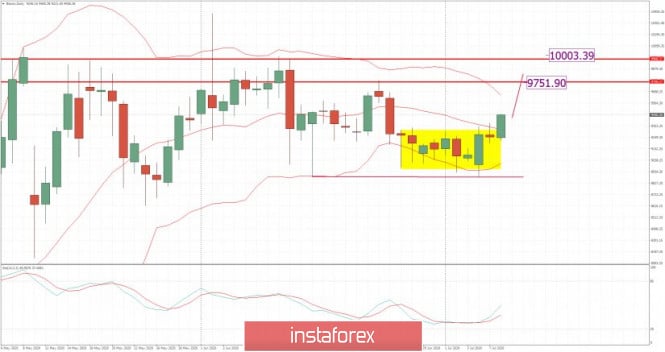
- BTC analysis for July 08,.2020 - Breakout of multi-day balance to the upside. Possible test of $10.000
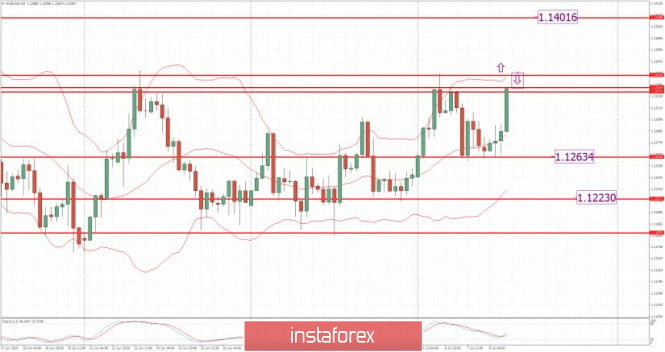
- EUR/USD analysis for July 08 2020 - Major resistance at the price of 1.1330 on the test, watch carefully for the price action
- Bitcoin whales activated dormant accounts
- EU warns about deeper recession
- Nobody needs gas
- Stock markets worldwide declined
- Analysis of Gold for July 08,.2020 - New upside wave started and I see potential for $1.821 on the test
- Oil market remains under pressure, prices are slowly sliding down
- Analysis of EUR / USD and GBP / USD on July 8. The forecast for the Eurozone GDP has worsened, but is still optimistic.
- July 8, 2020 : GBP/USD Intraday technical analysis and trade recommendations.
- #USDX & EUR/USD - h4. Complex analysis of APLs & ZUP market scenarios from July 09, 2020
- Greenback strengthens amid coronavirus fears
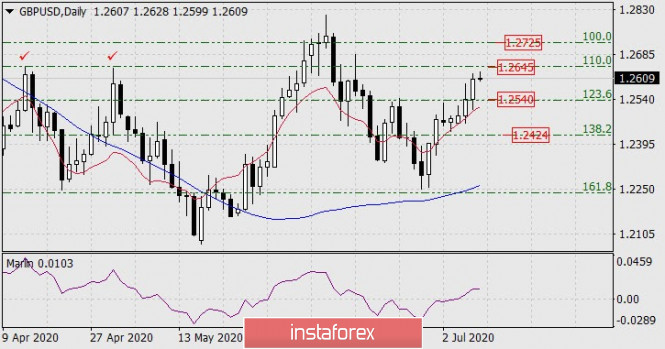
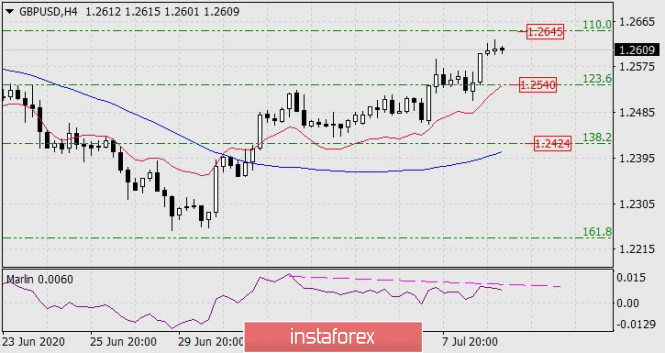
| Forecast for GBP/USD on July 9, 2020 Posted: 08 Jul 2020 08:02 PM PDT GBP/USD The British pound took full advantage of the dollar's weakness yesterday and showed an increase of 66 points. As usual, the price was supported by the balance line on the daily chart (red indicator). There are less than 40 points left to reach the first target level of 1.2645. The level is strong, the market could not overcome it on April 14 and 30 (check marks). Success will allow the price to grow to the Fibonacci level of 100.0% at the price of 1.2725. The price develops above the balance and MACD indicator lines on the four-hour chart. A divergence is outlined for the Marlin oscillator, but it is not ready yet, so its formation is marked by a dashed line. As a result, it is quite possible to reverse the price from the nearest target of 1.2645. But it is impossible to determine how deep this reversal will be – a very powerful growing sentiment formed on the daily chart, breaking it will require a lot of effort from the pound, perhaps the only factor that can do this is if Brexit negotiations failed. While we are waiting for a correction to the Fibonacci level of 123.6% at the price of 1.2540. The material has been provided by InstaForex Company - www.instaforex.com |
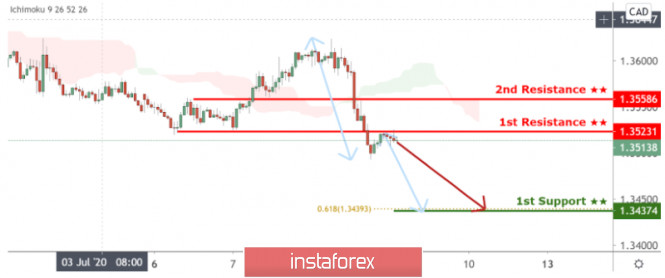
| USDCAD reversing off 1st resistance, more downside! Posted: 08 Jul 2020 08:02 PM PDT
Trading Recommendation Entry: 1.3523 Reason for Entry: Horizontal overlap resistance Take Profit :1.3437 Reason for Take Profit: 61.8 fib extension Stop Loss:1.3559 Reason for Stop loss: Horizontal swing high resistance The material has been provided by InstaForex Company - www.instaforex.com |
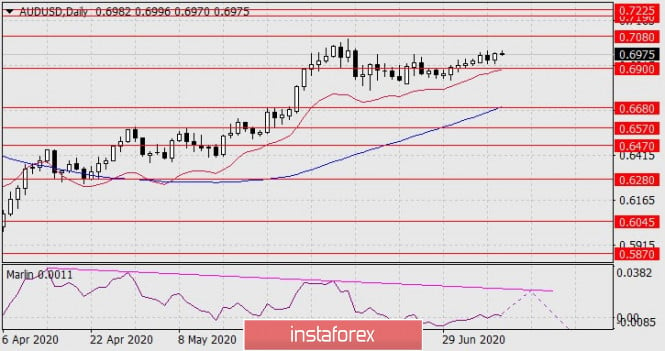
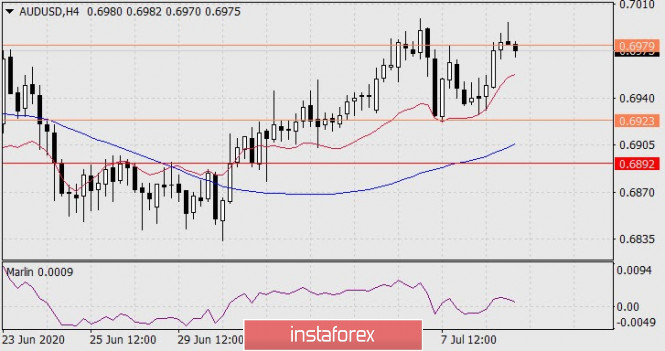
| Forecast for AUD/USD on July 9, 2020 Posted: 08 Jul 2020 07:48 PM PDT AUD/USD The Australian dollar attacked the signal level of 0.6979 on Wednesday before attacking 0.7080. Our plan remains: the price will reach the target range of 0.7190-0.7225, form a triple divergence with the Marlin oscillator and turn into a medium-term decline. The price is slightly below the control level of 0.6979 on the four-hour chart at the moment, the Marlin oscillator is in the growing trend zone. The first growth target is 0.7080, breaking the level opens the way to the range of 0.7190-0.7225. The material has been provided by InstaForex Company - www.instaforex.com |
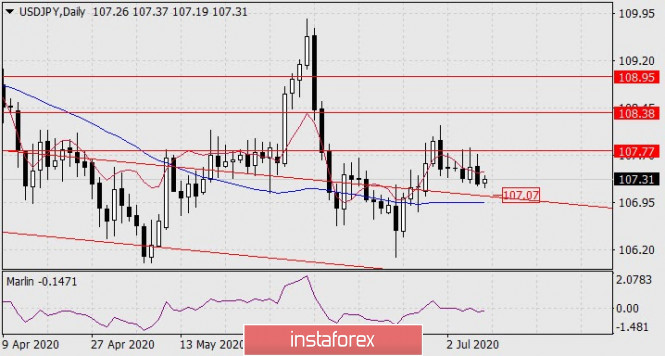
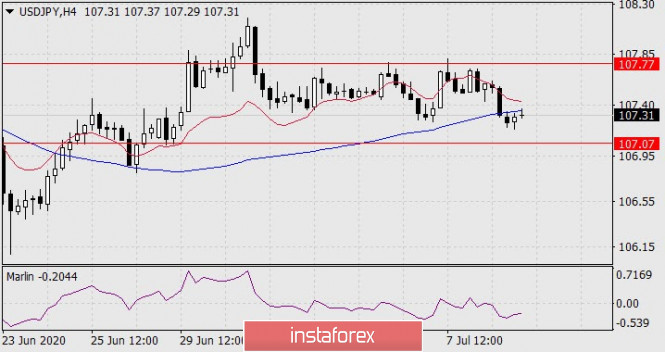
| Forecast for USD/JPY on July 9, 2020 Posted: 08 Jul 2020 07:48 PM PDT USD/JPY The volatile nature of the stock market pushed the USD/JPY pair by 25 points on Wednesday. The price is back under the balance indicator line on the daily chart. The US market still closed in the same territory; S&P 500 0.78%, Russell 2000 0.41%, this growth is supported today on Asian markets: Nikkei 225 0.32%, Kospi SEU 0.61%. The dollar has every chance to continue strengthening, and the price will once again attack the resistance of 107.77. Overcoming the level will open the second goal of 108.38. It is much more difficult to develop a downward movement for the price – the support for the embedded price channel line at 107.02 is at the bottom, and the support for the MACD line is just below it. The MACD line (indicator blue) kept the price from growing on the four-hour chart, the Marlin oscillator is in the negative zone, the price needs to grow above 107.50 so that the price intention to take 107.77 is confirmed and at the same time technical support. The material has been provided by InstaForex Company - www.instaforex.com |
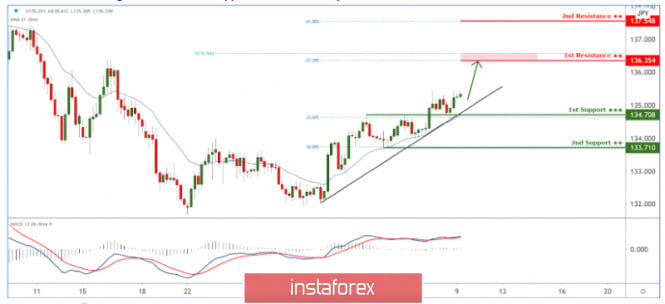
| GBPJPY holding above trendline support! Further rise expected! Posted: 08 Jul 2020 06:34 PM PDT
Trading Recommendation Entry: 134.708 Reason for Entry: Moving average support, 23.6% Fibonacci retracement, ascending trendline support Take Profit: 136.354 Reason for Take Profit: -27% Fibonacci retracement, 200% Fibonacci extension Stop Loss: 133.710 Reason for Stop Loss: 50% Fibonacci retracement The material has been provided by InstaForex Company - www.instaforex.com |
| Posted: 08 Jul 2020 05:27 PM PDT 4-hour timeframe
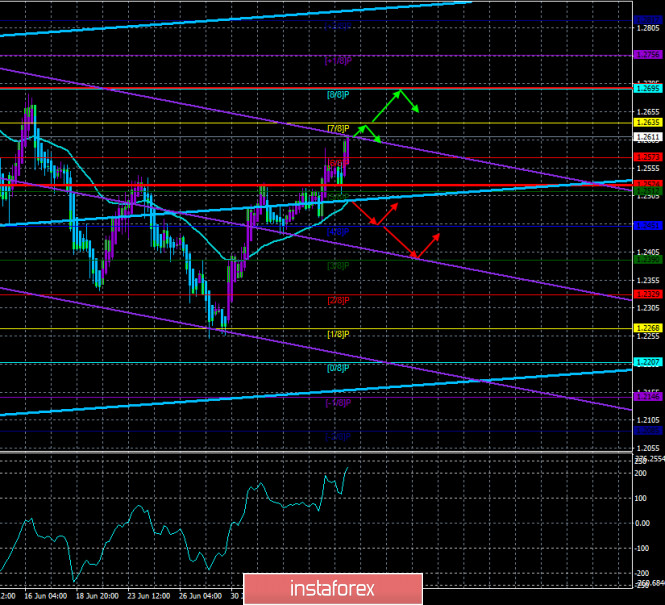
Technical details: Higher linear regression channel: direction - upward. Lower linear regression channel: direction - downward. Moving average (20; smoothed) - upward. CCI: 225.7567 The British pound resumed its upward movement in the second half of the past day. And since the European currency has also become more expensive, we can conclude that the basis for this movement should again be sought in the United States. However, in the last days, there is nothing supernatural in America that did not happen. Except for the "coronavirus" that continues to spread, as in a crowded minibus, and the already familiar news related to Donald Trump, nothing happened. However, there was nothing supernatural yesterday, and the pound was still getting more expensive. Thus, we still believe that most traders ignore the macroeconomic background, paying attention only to the long-term fundamental one. And it is based on these considerations that all the problems of America, current, and potential, for some time blocked the already well-worn topic of "Brexit". Plus, do not forget that the British currency is very fond of getting more expensive in recent years on rumors and speculation, which in most cases are not confirmed by anything. Meanwhile, we believe that the key figure in the negotiation process between Brussels and London is not David Frost, but Boris Johnson. While the whole world is wondering whether Johnson's position in the negotiations is a bluff, we believe that this is a bold and slightly reckless, but not a false position of the British Prime Minister. Recall that this week, the next round of negotiations on a free trade agreement began. Not even that. London wants a free trade agreement, and Brussels wants a comprehensive agreement that will define relations between countries in all areas. Boris Johnson first said that the terms of the "transition period" would not be extended. The latest information indicated that the British Prime Minister intends to agree at the end of the summer. This week it became known that the UK, according to Johnson, is ready to trade with the European Union under the rules of the WTO, if "an agreement can not be reached". In principle, no one doubts this option. For if there is no agreement, then there will be no other option for trade relations between the Kingdom and the Alliance. The question is that all economists say with one voice that the British economy will come under another massive blow if there is no agreement. Of course, it will not collapse, but it has already been suffering from Brexit for about 4 years, plus the "coronavirus crisis" and the epidemic itself, which is unclear how it will manifest itself and what other impacts it will leave on the British and world economy. Thus, an additional blow to the British economy was not needed even before the "coronavirus epidemic", and now even more so. However, we remind you that from the very beginning of his reign, Boris Johnson was not only not against, but also for leaving the European Union without any agreements. It was this option that he pushed hard from the very beginning, but it was desperately blocked from time to time by the Parliament. Only under pressure from Parliament, Johnson had to go to negotiate a "deal", which was again blocked by Parliament, considering it not attractive enough for the UK. After the December parliamentary elections, Johnson and his supporters received full carte blanche and immediately returned to the original version, which provided for the severing of all ties with the EU. As a fallback option, Johnson leaves the option of an agreement, but only one that will benefit London. If not, then he will personally be satisfied with the option without any agreements. Thus, it is Johnson who can "swing the rights" in negotiations with the European Union, and we can only guess whether Brussels will make concessions? The latest information also says that the European Union seems to be ready to concede a little in the "fish" issue. However, this is still a rumor that has not been confirmed. Meanwhile, the "parade of funny stories" continues in the US. Donald Trump, dissatisfied with the work of WHO in the case of "coronavirus", told the US Congress that the country is leaving the organization. However, according to the rules of the organization, the United States will be able to leave it only in a year, that is, on July 6, 2021, when the president of the country, quite possibly, will not be Trump. Naturally, the American President immediately came under criticism from the Democrats. In particular, Senator Bob Menendez wrote on Twitter: "Congress has received a message that the US President has officially withdrawn the country from the WHO. Calling Trump's response to the coronavirus pandemic chaotic and inconsistent is not enough. This decision will not protect the lives or interests of Americans, it will leave them sick and America alone." And the most interesting thing is the "cherry on the cake" - the reaction of Joseph Biden, who immediately announced via Twitter that he would return the United States to the WHO if he won the election. "Americans are safe when America participates in promoting global health. On the first day of my presidency, I will return the United States to WHO and restore our leadership on the world stage," Biden said. Also, there was a speech by the Minister of Finance of Great Britain Rishi Sunak. He said on Wednesday that the British government has approved a 30 billion pound program that will be aimed at fighting unemployment and reducing taxes for the tourism industry. Under the plan, employers will receive 1,000 pounds for each employee who returns to work from unpaid leave caused by the coronavirus pandemic and quarantine. Also, the UK government is going to spend several billion pounds to create 350,000 temporary jobs for young people aged 18 to 24. This category of British people is called the most vulnerable in the crisis. "Young people have always borne the brunt of the economic crisis, but now they are particularly at risk as they work in the sectors most affected by the pandemic. We understand that youth unemployment has long-term consequences... and we don't want this to happen to this generation," Sunak said. It is also reported that the UK economy may shrink by 14% in 2020, which exceeds the potential losses of both the European and American economies. This is to the question that the additional blow to the economy caused by the lack of a free trade agreement with the EU is unnecessary for the British...
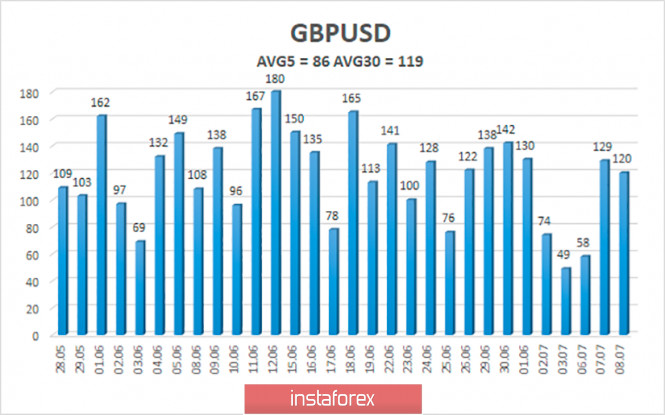
The average volatility of the GBP/USD pair continues to remain stable and is currently 86 points per day. For the pound/dollar pair, this value is "average". On Thursday, July 9, thus, we expect movement within the channel, limited by the levels of 1.2524 and 1.2696. Turning the Heiken Ashi indicator downward will indicate a new round of downward correction. Nearest support levels: S1 – 1.2573 S2 – 1.2512 S3 – 1.2451 Nearest resistance levels: R1 – 1.2634 R2 – 1.2695 R3 – 1.2756 Trading recommendations: The GBP/USD pair continues its upward movement on the 4-hour timeframe. Thus, today it is recommended to stay in the purchases of the pound/dollar pair with the goals of 1.2635 and 1.2695 and keep them open until the Heiken Ashi indicator turns downward. It is recommended to sell the pair after fixing quotes below the moving average with the first goals of 1.2451 and 1.2390. The material has been provided by InstaForex Company - www.instaforex.com |
| Posted: 08 Jul 2020 05:27 PM PDT 4-hour timeframe
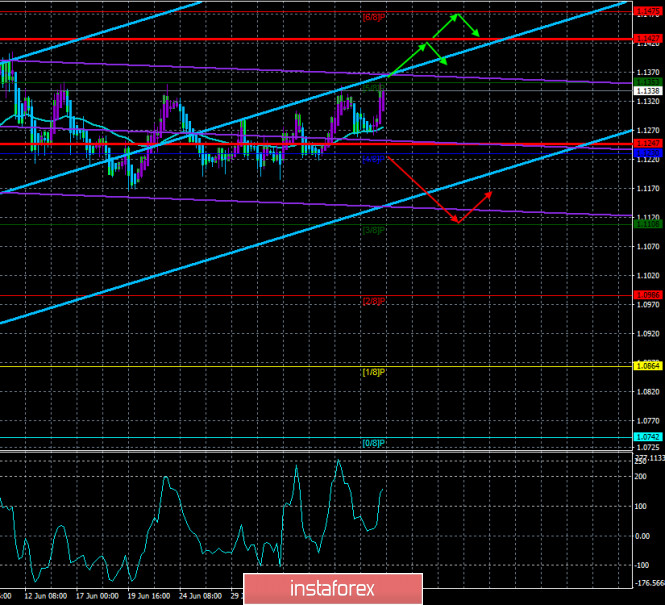
Technical details: Higher linear regression channel: direction - upward. Lower linear regression channel: direction - sideways. Moving average (20; smoothed) - upward. CCI: 159.1110 The EUR/USD currency pair spent the third trading day of the week in absolutely calm trading. The pair's quotes fell to the moving average line the day before, so yesterday there was a question: will the moving average be overcome or will there be a rebound? Second option. Thus, the pair can now return to the Murray level of "5/8"-1.1353, which it has tested for strength three times already and which remains the approximate upper limit of the side channel in which the pair has been trading for several weeks. We believe that until this level is overcome, it will be difficult for buyers and the euro currency to expect anything more than they have now. At the same time, the fundamental background remains extremely contradictory. There are a lot of important topics now, but it is unclear what traders are paying attention to, and whether they are paying attention at all. Thus, as before, we recommend that you first pay attention to technical factors. On Wednesday, July 8, no important macroeconomic statistics were published either in the United States or in the European Union. Thus, absolutely nothing affected the movement of the currency pair. However, the huge mass of important topics that can potentially affect the currency market and the entire world economy, does not allow traders to relax and trade on pure "technology". One of these topics is the confrontation between China and the United States. Superpowers, like ordinary states, constantly compete with each other. This principle is the basis of the entire universe. It is a competition that provokes growth and development. This is not surprising. It is not surprising that the government of each country is always guided by its interests in foreign policy. Thus, even the absurd decisions of Donald Trump, of which we have seen a huge number over the past 4 years, are by and large absolutely "normal" for the United States. There was always only one problem. If a particular power, its government, or its leader was too much "buried" in the promotion of their interests and spat on the interests of others, then there was almost always a counteracting force. If we were living in the 18th or 19th century, there would probably be a war between the United States and China. However, now the 21st century and everyone understands perfectly well that there are no winners in any war, and while there will be recovery from destruction, other states will take the first roles in the world. Therefore, the war is simply not profitable for anyone, and there are no good reasons for it to start. But there is a constant conflict of interests. Donald Trump started a trade war with China, as a result, it was from China that the "coronavirus" broke out, which easily brought the world economy to its knees. While European countries managed to stop the spread of the epidemic and localize the foci, that is, to bring COVID-2019 under relative control, the situation in the United States does not change much. And now, who can say with confidence that "coronavirus" is not China's response to the US or personally to Donald Trump in the two-year trade war? Who can say for sure that the virus was not released intentionally? Who can say that the infected Chinese were not sent specifically to the United States with a very clear purpose? After all, in any country, there are special services, secret departments, state security departments, espionage departments, and so on. Everything for conducting secret activities in the international arena. Thus, as soon as there is a conflict between the major players, everyone immediately needs to strain, since everyone can get it. Now, a new conflict is growing between China and the United States. This time because of Hong Kong. America's interests in Hong Kong are obvious. For America, Hong Kong is a window into China through which you can operate more covertly and freely, which is less monitored by the Chinese authorities. Beijing also understands this. Amid another trade conflict that could turn into a cold war, Beijing does not want Washington to have the ability to influence China from within. Thus, since July 1, the resonant law "on national security in Hong Kong" came into force, which deprives the district of autonomy from China and cancels the principle of "one country – two systems". Everything would even be good for everyone except Hong Kong, which will lose a lot of American trade preferences and become just "part of China", if half of Europe and, most importantly, the United Kingdom, which has an agreement with Beijing dated 1984, according to which Hong Kong should remain an independent state until at least 2047, and Beijing is delegated only defense and foreign affairs issues. Thus, Beijing violates the Joint Sino-British Declaration on the transfer of Hong Kong, and London immediately responded that it would make it easier for Hong Kong citizens to obtain British citizenship. Thus, in theory, up to half of the population of Hong Kong can freely leave the no longer autonomous district and move to live and work in Britain. Of course, if Beijing does not "close" the district. Naturally, such a step will cause a new storm of indignation from the world community, but Beijing has long been acting regardless of what others say, that is, it is guided solely by its interests. The United States, the United Kingdom, and others can only threaten Beijing with sanctions. However, it is not profitable for Washington to escalate relations with Beijing. This is two years ago, Trump easily started a trade war with China, now, a few months before the presidential election, it is not necessary for Trump, as retaliatory sanctions will follow or even the January trade agreement will be terminated, which will further hurt the American economy and bury the chances of Trump's re-election. In fact, in most cases, the President of the United States, who wants to stay for a second term, was re-elected. There have only been a few cases in the history of the United States where this has not happened. But Trump, who has turned half the world and half the United States against him, may just fall into the category of exceptions. But while he has not lost all chances, we believe that he will not escalate the situation in the confrontation with China. No important macroeconomic publications are scheduled for the last two trading days of the week in the US and the European Union. The EU will only hold a meeting of the Eurogroup, in which the economic recovery fund can theoretically be discussed. Nothing else interesting is planned for the last days of the week.
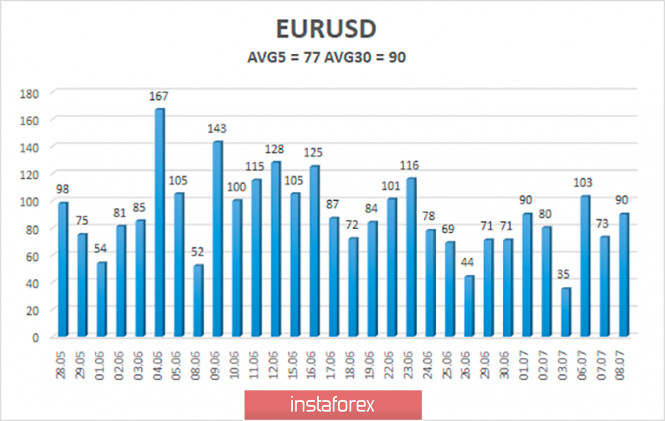
The volatility of the euro/dollar currency pair as of July 9 is 77 points and is characterized as "average". We expect the pair to move between the levels of 1.1247 and 1.1427 today. A new reversal of the Heiken Ashi indicator downwards will signal a new round of downward movement within the side channel if the level of 1.1353 is not overcome before this. Nearest support levels: S1 – 1.1230 S2 – 1.1108 S3 – 1.0986 Nearest resistance levels: R1 – 1.1353 R2 – 1.1475 R3 – 1.1597 Trading recommendations: The EUR/USD pair continues to trade near the moving average line, inside the side channel. Thus, at this time, it is recommended to trade down if traders manage to overcome the level of 1.1200, which is the approximate lower limit of the channel, with the goal of 1.1108. It is recommended to open buy orders not earlier than the Murray level of "5/8" - 1.1353 with a target of 1.1475. The material has been provided by InstaForex Company - www.instaforex.com |
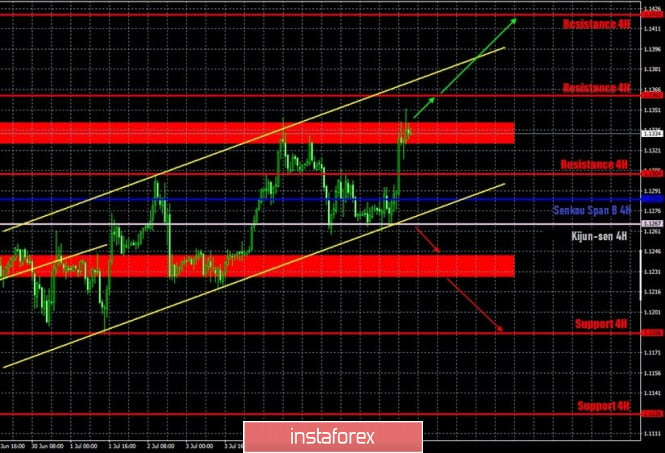
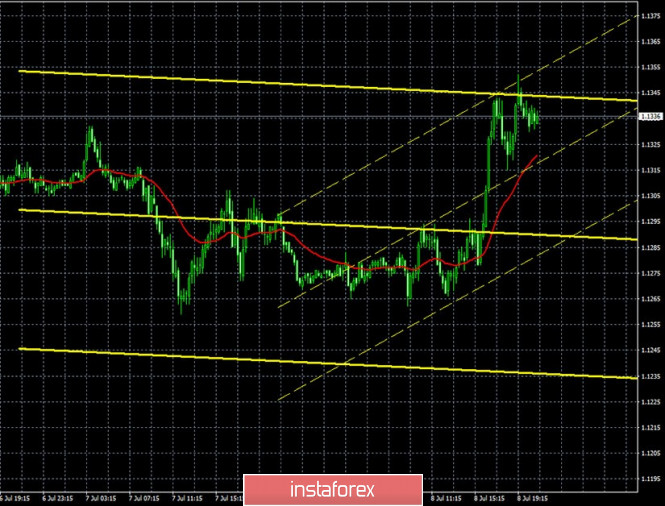
| Posted: 08 Jul 2020 05:20 PM PDT EUR/USD 1H Buyers resumed their attack on the hourly timeframe on July 8 and returned the euro/dollar pair to the resistance area of 1.1326–1.1342. And at the time of writing, this area has yet to be overcome. The bulls clearly do not want to retreat and continue to make attempts to form a new upward trend. However, now there is also an ascending channel on the buyers' side. It was formed last week. Therefore, we now have a somewhat paradoxical situation at our disposal. On the one hand, the side channel takes place and is visible to the naked eye on the higher timeframes. On the other hand, the hourly chart has a pronounced ascending channel. And not a one-day channel, but a channel that originates on June 29. We can draw the following conclusions. Buyers continue to dominate the market, but their advantage is extremely weak and it is unknown whether it will be enough to overcome the area of 1.1326–1.1342. We do not recommend buying the euro currency as long as traders have not managed to overcome this area. At the same time, if a breakout occurs, along with the ascending channel, technical factors predicting further growth will be sufficient. EUR/USD 15M The lower channel of linear regression turned up on the 15-minute timeframe, but not overcoming the area of 1.1326–1.1342 can provoke a new round of corrective movement. We draw the attention of traders to the fact that the latest COT report showed a sharp reduction in the number of purchase contracts among professional traders. At the same time, the same category of traders (Commercial) actively purchased contracts for sale. Therefore, it could be assumed that their mood is changing towards a downward trend. However, we remind you that the total net position for this category of traders is now almost at +102,000. This means that Buy-contracts are 102,000 more than Sell. Moreover, it is not advised to trade on COT reports without technical support. They only show the mood of large traders. The fundamental background for the euro/dollar pair has not changed at all in recent days. US President Donald Trump continues to work on his political rating and is going to open schools in September, despite the fact that the country is crossing the 3-million mark for coronavirus cases. Trump is going to introduce a new package of sanctions against Hong Kong and China, and has initiated the US withdrawal from the World Health Organization. None of this news could have a devastating impact on the US dollar. But the fact that the rate of increase in the spread of the epidemic in the United States is not decreasing, may well have a negative impact. At least we can see that sellers continue to remain "on the fence" and are in no hurry to return to the market. This means that either buyers need to get enough of their purchases and start closing them, or they need a fundamental background that will bring sellers back into the game. No high-profile macroeconomic events are planned for the last two trading days of the week in the United States and the European Union. The Eurogroup meeting may or may not provide some food for thought, since it is not a fact that the issue of a 750 billion euro recovery fund will be discussed during the meeting. And even if it is discussed, it is very unlikely that any decision will be made on it. This means that the bulls will have to push through the level of 1.1342 without the help of the foundation. Based on all of the above, we have two trading ideas for July 9: 1) Buyers reached the area of 1.1326-1.1342 for the fourth time in the last month and again failed to close above it. Thus, we recommend buying the euro currency after overcoming this area, which will mean the continuation of the bullish trend, while aiming for the resistance levels of 1.1362 and 1.1422. Potential Take Profit is up to 80 points in this case. 2) The uptrend persists in the short term, as indicated by the upward trend channel. Thus, sellers are still waiting for their chance. Bears need to close below the channel, that is, to go below the Senkou Span B line (1.1267). In this case, the bulls will give the initiative to the bears, and we recommend selling the pair with targets at 1.1228, 1.1186 and 1.1126. The potential Take Profit in this case is from 20 to 130 points. The material has been provided by InstaForex Company - www.instaforex.com |
| July 8, 2020 : EUR/USD Intraday technical analysis and trade recommendations. Posted: 08 Jul 2020 10:25 AM PDT
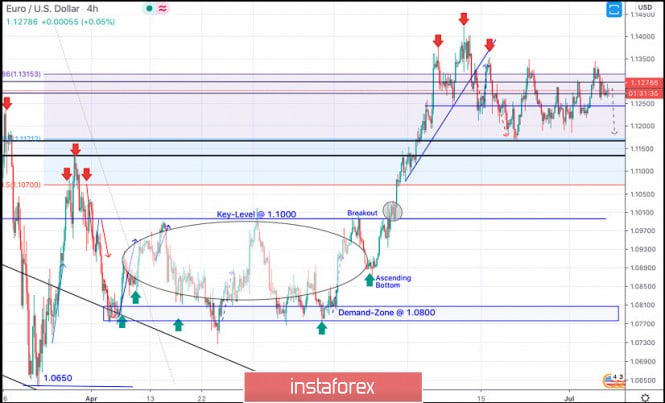
On March 20, the EURUSD pair has expressed remarkable bullish recovery around the newly-established bottom around 1.0650. Shortly after, a sideway consolidation range was established in the price range extending between 1.0770 - 1.1000. On May 14, evident signs of Bullish rejection as well as a recent ascending bottom have been manifested around the price zone of (1.0815 - 1.0775), which enhances the bullish side of the market in the short-term. Bullish breakout above 1.1000 has enhanced further bullish advancement towards 1.1175 (61.8% Fibonacci Level) then 1.1315 (78.6% Fibonacci Level) where bearish rejection was anticipated. Although the EUR/USD pair has temporarily expressed a bullish breakout above 1.1315 (78.6% Fibonacci Level), bearish rejection was being demonstrated in the period between June 10th- June 12th. This suggested a probable bearish reversal around the Recent Price Zone of (1.1270-1.1315) to be watched by Intraday traders. Hence, Bearish persistence below 1.1250-1.1240 (Head & Shoulders Pattern neckline) was needed to confirm the pattern & to enhance further bearish decline towards 1.1150. Moreover, bearish breakdown below the depicted keyzone around 1.1150 is mandatory to ensure further bearish decline towards 1.1070 and 1.0990 if enough bearish pressure is maintained. Trade recommendations : The current bullish movement towards the price zone around 1.1300-1.1330 (recently-established supply zone) should be followed by Intraday Traders as a valid SELL Signal.T/P levels to be located around 1.1175 then 1.1100 while S/L to be placed above 1.1350 to offset the associated risk. The material has been provided by InstaForex Company - www.instaforex.com |
| Posted: 08 Jul 2020 08:58 AM PDT In the morning trade, gold futures for August changed their direction and moved to the downside. Gold prices went slightly lower after reaching their highest levels since 2011. The shift in direction came amid investors' doubts over a quick recovery of the global economy. In the early trade, gold fell by 0.17% and reached the level of 1,806.7 dollars per troy ounce. Gold found support at around 1,766.3 dollars per troy ounce, while resistance was set at 1,810.8 dollars per troy ounce. By the end of the previous session, the price of the precious metal jumped to the level of 1,809.9 dollars per troy ounce which was last recorded back in September 2011. The enthusiasm for gold grew on investors' fears that global markets could fail to withstand the growing danger of the second wave of the coronavirus pandemic. Market participants are losing interest in risk assets and are turning their attention to a safer area of ETFs funds backed by gold. The safe haven of precious metals is becoming more appealing amid the worsening epidemiological situation. The weakening global economy may come under more pressure if the lockdown measures are re-imposed worldwide. Investors are not going to wait for the worst and are moving away from risk assets that were so popular a few days ago. Meanwhile, the world economy continues to contract. Therefore, global regulators resort to easing of the monetary policy and introducing new stimulus measures which add to the rise of precious metals. Gold-backed ETFs showed rapid growth in the first half of the year, closing with a record net inflow of 734 tons. The total investment amounted to 39.5 billion US dollars. These numbers indicate an unprecedented growth both in physical terms and in value. In 2009, gold deposits amounted to 646 tons while in 2016 the amount approached 23 billion dollars. This year, however, all records have been beaten. And we can expect another steep rise in gold prices until the end of 2020. The main factors to support the surge in gold prices include low interest rates introduced in most countries and the weakening US dollar. Recently, the fall of the greenback has become even more evident. In the early trade, silver futures for September were up by 0.38%, settling higher at the level of 18.628 US dollars per troy ounce. Copper futures for September also followed the positive dynamics and rose by 0.34%, hitting the level of 2.7963 dollars per pound. The material has been provided by InstaForex Company - www.instaforex.com |
| Evening review on EURUSD for July 08, 2020 Posted: 08 Jul 2020 08:45 AM PDT
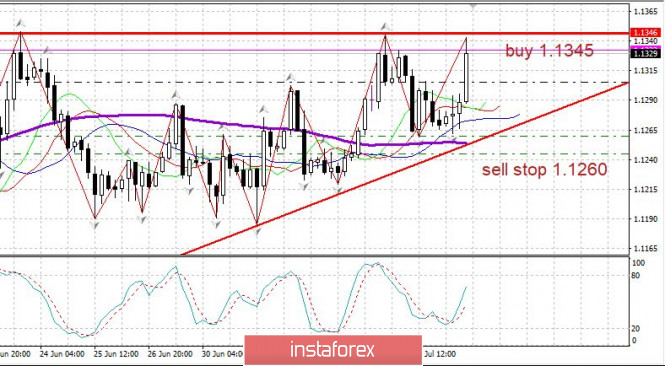
EURUSD: As observed, the euro, again, attempts to break through the level of 1.1345. Sellers rally around the said level in hopes to protect it. There are two possible scenarios: 1) The euro breaks through 1.1345 and closes the day higher. Or 2) The attempt to break through 1.1345 fails and the euro turns down and falls sharply. You may keep purchases from 1.1245, but the stop is moved to 1.1260, where a downward pullback is possible. That is, from 1.1260 you may sell euros with a stop at 1.1305. The material has been provided by InstaForex Company - www.instaforex.com |
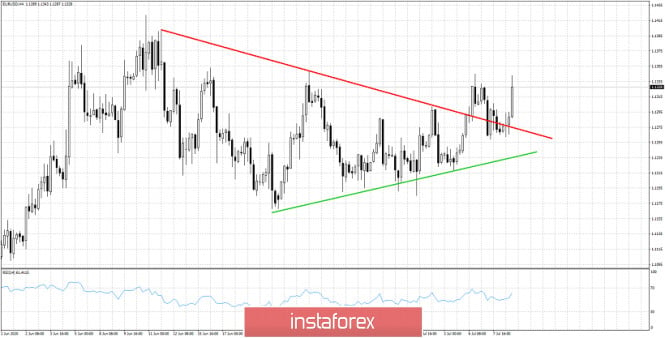
| EURUSD back tests triangle and bounces off support Posted: 08 Jul 2020 08:30 AM PDT EURUSD yesterday back tested the key short-term support area of 1.1265-85. This was once resistance and is now support. The bounce off the support level and the recapturing of 1.13 are bullish signs.
Green line- support EURUSD broke above the upper triangle boundary, pulled back as a back test and is now bouncing to new higher highs. The RSI is lagging behind and we should pay close attention to this indicator as a bearish divergence would make us very cautious. If the RSI follows and makes new higher highs as well, then we should expect this up trend to continue and finally see levels above 1.14. Trend remains bullish as long as price is above yesterday lows. As we explained in our weekly analysis, EURUSD bulls need to recapture 1.13 and stay above it on a weekly basis. The material has been provided by InstaForex Company - www.instaforex.com |
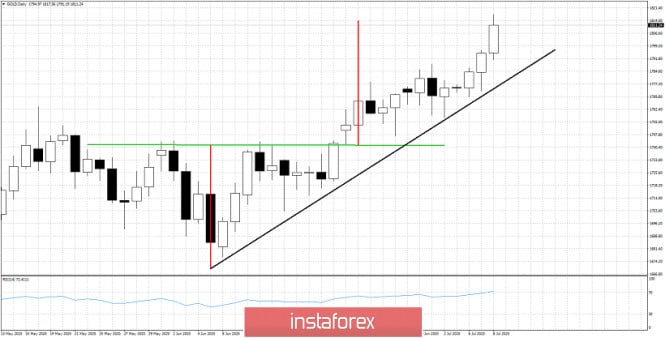
| Gold price reaches second target area Posted: 08 Jul 2020 08:26 AM PDT Gold price has made new higher highs today around $1,820 and has fulfilled the expectations from the break out of the inverted head and shoulders pattern. Trend remains bullish however traders need to be cautious and protect their gains.
Black line - support trend line Green line - neckline Red lines -size of upward move expected by Head and shoulders (inverted) pattern Gold price continues to make higher highs and higher lows. Support remains key at $1,760 area. Price has reached our second target. A pull back towards $1,785-95 is justified at current levels so bulls need to be cautious. Bulls do not need to be greedy. On a daily basis the RSI is canceling the bearish divergence and is making new higher highs. This is another sign of strength. The material has been provided by InstaForex Company - www.instaforex.com |
| Posted: 08 Jul 2020 07:08 AM PDT Technical analysis:
Trading recommendation: The material has been provided by InstaForex Company - www.instaforex.com |
| Posted: 08 Jul 2020 06:55 AM PDT Technical analysis:
Trading recommendation: The material has been provided by InstaForex Company - www.instaforex.com |
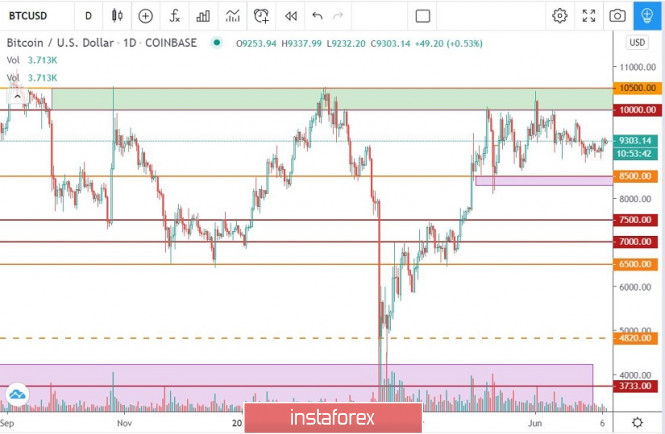
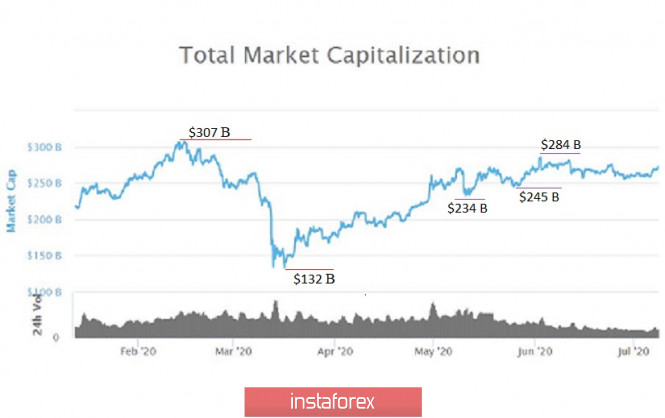
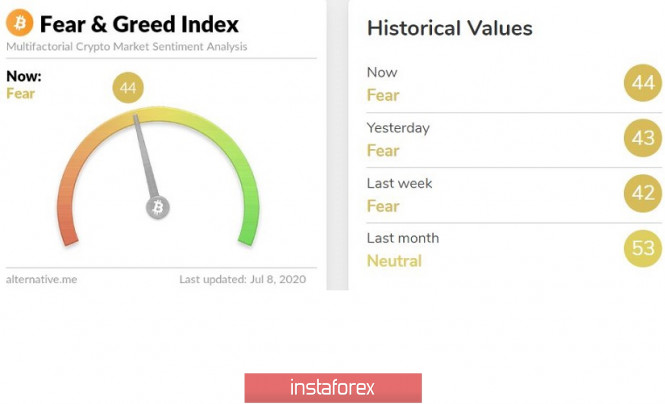
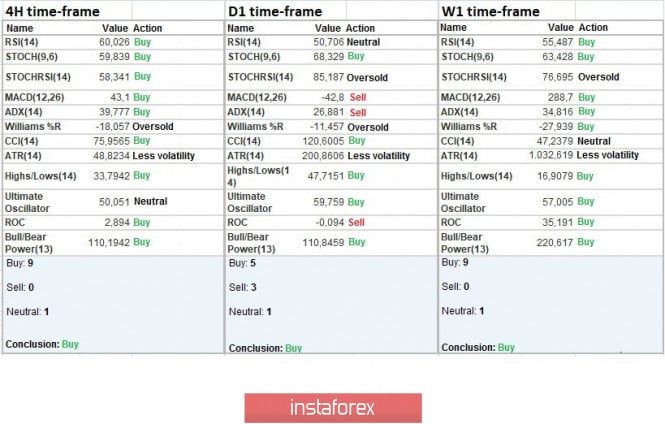
| Bitcoin whales activated dormant accounts Posted: 08 Jul 2020 06:25 AM PDT Greetings crypto enthusiasts! In this article, we will analyze the term "Bitcoin whale" and consider how it affects the emotional and material part of the market. The term "Bitcoin whale" itself refers to an individual or legal entity, it has more than 10 thousand Bitcoins on its account, and its volume can affect the price rate. According to Bloomberg research, almost 60% of the total BTC volume is controlled by less than 1% of wallets. Who are Bitcoin Whales? It's a mystery for us, but it's worth remembering that in the past you could buy pizza for 10,000 BTC, which the famous Laszlo Heinitz did in 2010. Thus, crypto enthusiasts in the construction of the Bitcoin system could put together a considerable part of the digital asset, which is now the foundation of the entire structure, where these very whales, which control the rate of the first cryptocurrency, are at the head. Tracking whale transactions is carried out by monitoring BTC wallets, for example, Bitinfocharts provides a list of the 100 most impressive crypto accounts in terms of size. Without proper dexterity, you can get confused in the movement of capital, but programmed bots will come to the rescue, which can separate exchange accounts from whales. Such a bot can be easily found both on Telegram and on Twitter, which will greatly simplify the analysis. Why is capital flow analyzed? The answer lies in the fact that whale wallets, which for a long time stood motionless in one place, with subsequent movement signal upcoming changes in the market itself. That is, the market, or rather the BTC rate can change the beat that followed earlier. At the same time, the flow of capital may mean the entry of institutional investors into the market. One of the last manipulations with a large volume of BTC occurred not so long ago. On June 27, the bot recorded a span of 101,857 BTC ($ 943 million), the transaction was split into two previously unknown wallets. The bot recorded another operation on July 6, which span to 16,662 BTC ($ 154 million), and the transaction was also broken down at anonymous addresses. This happens while Bitcoin has been standing in the side corridor of $ 8,500 / $ 10,000 for more than two months, which could theoretically signal an early cardinal change in market ticks. Before moving on to thorough market analysis, we focus on the two whale transactions described above. So, a huge amount of capital was taxed with a minimum transfer fee of 101,857 BTC (commission $ 0.49), and 16,662 BTC (commission $ 0.73), which once again confirms how economical transfers are in the Bitcoin network compared to the traditional banking system. Current development and prospects As early as 70 days in a row, the quotes of the first cryptocurrency invariably follow in the range of $ 8,500 / $ 10,000, showing an average daily activity in the region of $ 400. Such activity signals a peculiar stage of accumulation, inside of which there are definitely large players who control this process. Based on the fact that no one can always stand in one place, such a protracted flat will soon lead to impulsive activity. Such a "boom" of activity can come at any moment in time, and we should be prepared for it. As we have previously identified levels of $ 8,300 / $ 10,500, in the area of which there are concentrated clusters of stop orders [StopLoss], touching them, an avalanche-like reaction can occur that will provoke a breakdown of the set boundaries. Based on the above information, the best trading tactic will be to work on the basis of local operations, which will be set outside the range of $ 8,300 / $ 10,500 in the form of pending orders or with market entry with proper consolidation outside the specified coordinates. The general background of the cryptocurrency market Analyzing the total market capitalization of the crypto industry, you can see that the trading volumes following the BTC rate move in a conditional side channel, where the current hour Total market is $ 272 billion. If we consider the volume chart in general terms, then it can be seen that the amplitude limits are $ 245 and $ 284 billion. The maximum of the current year is $ 307 billion, the subsequent resistance is in the region of the maximum of 2019 $ 362 billion. Regarding the support levels, here it is worth taking into account the numbers: $ 245 billion, $ 234 billion and $ 132 billion The cryptocurrency market index of emotions (aka fear and euphoria) is 44 points. It is worth considering that the mood indicator is stably above the level of 40 points, which indicates the stabilization of the emotional background of the market. Abrupt changes in the index plan will occur at the moment when the BTC price breaks the main borders of $ 8,300 / $ 10,500. Indicator analysis Analyzing a different sector of timeframes (TF), it can be seen that relative to four-hour and daily periods there is a variable buy and sell signal due to BTC price fluctuations within the flat formation of $ 8,500 / $ 10,000. A weekly period, as before, signals a buy due to the rapid recovery process. |
| EU warns about deeper recession Posted: 08 Jul 2020 06:08 AM PDT
The European Commission previously suggested that the EU's GDP would drop by 8.7% in 2020 and rise by 6.1% in 2021. The eurozone economy would fall by 8.3% in 2020 and advance by 5.8% in 2021. However, while making the calculations, economists did not take into account a prolonged quarantine. Thus, the crash will be significantly stronger than expected. Thus, a slump of 7.7% is forecast for the eurozone and a 7.4% decline for the EU as a whole. Growth in 2021 would also be less strong than expected. European Commissioner for the Economy Paolo Gentiloni said that a rise in the eurozone economy should not be expected until 2021. He also noted that Italy, Spain and France will suffer more than others. The European Commission has developed a plan of economic recovery in all European countries. However, there are concerns that some countries will be able to cope with the crisis. Brussels is trying to ensure that all countries in the eurozone were at the same level of welfare. Updated forecasts do not take into account the second wave of the coronavirus. This is the main problem for Brussels. Nevertheless, the European Commissioner is confident that EU leaders will be able to reach an agreement and the recovery plan will be approved. Next week, the first meeting of the heads of states after the outbreak of COVID-19 will take place in Brussels. The material has been provided by InstaForex Company - www.instaforex.com |
| Posted: 08 Jul 2020 06:02 AM PDT
Excess fuel for heating and electricity led to a drop in gas prices. While other assets are recovering from the pandemic and rising in price, natural gas is lagging behind. Traders do not expect gas prices to rise at least until the start of the heating season. Currently, the price of natural gas is set at 1.876 per million British thermal units. This is 23% lower than last year. Analysts believe that prices are unlikely to rise above $2 in the long term until the Americans begin to use heating. Although gas is necessary for the operation of air conditioners, fuel prices are extremely low. In this regard, many American manufacturers have faced a difficult situation. The collapse of prices to unprecedented lows was facilitated by the shutdown of gas supplies to Asia due to the coronavirus pandemic. The export of more than 110 cargoes was canceled, and the volume of deliveries has more than halved since the beginning of spring. Now, instead of exporting, gas is stored in tanks, and prices for volatile fuel have fallen toa 25-year low. Analysts at Goldman Sachs Group Inc suggest an increase in gas reserves of 760 billion cubic feet, which is already 30% more than a year ago. In autumn, gas stocks could reach the limit. It is likely that large regional producers, such as EQT Corp., will be forced to cut production and shut down even more wells as production becomes unprofitable. Moreover experts suggest a fall in prices to 90 cents. BofA analysts expect prices to average $1.75 this summer, but in the fourth quarter prices could rise to $2.60. Besides, according to experts, gas prices may reach $2.90 in the first three months of 2021. The material has been provided by InstaForex Company - www.instaforex.com |
| Stock markets worldwide declined Posted: 08 Jul 2020 05:56 AM PDT
There were no single common dynamics in the changes in the stock exchanges of the Asia-Pacific region this morning. Indices move in different directions in response to the worsening situation in the economy still in connection with the rapid increase in the number of COVID-19 patients around the world. Over the past few trading sessions, Asian stocks have been restored amid expectations of a quick economic recovery in the region. Many companies resumed their activities after lifting quarantine measures imposed during the COVID-19 pandemic, which positively affected the index of business activity in various sectors of the economy. However, new cases of infection began to spread rapidly throughout the region and the world as a whole, which forced market participants to practice moderate enthusiasm and take a more balanced approach to their work. Hopes for a quick restoration of economic growth have virtually disappeared, due to the growing fears of a second wave of the pandemic and the ensuing restrictive measures. However, extensive measures on the part of governments and the main regulators of states act as support. Almost everywhere incentives are introduced and a soft monetary policy is pursued. It favorably affected the improvement of the situation in the economy. Japan's Nikkei 225 Index began to sag this morning and has so far lost 0.5%. China's Shanghai Composite Index, on the contrary, begins to recoup its losses yesterday and rises by 0.5%. Hong Kong's Hang Seng Index follows with an increase of 0.4%. The South Korean Kospi index shows a slight, but still negative trend, which fell by 0.1%. Australia's S & P / ASX 200 index is down by 1.23%. So far this is the biggest loss in the region. A negative trend is also observed in the American stock markets. Yesterday, the main indices were marked by a rapid decline. The Nasdaq and S&P 500 index were particularly affected, which had to move from a tremendous rise to an equally significant reduction. Market participants in the Asian region expressed extreme concern amid a sharp spread of coronavirus infection in the United States and Latin America. Previously, this factor was almost leveled by good statistics on the economy, but today investors again drew attention to it. The Dow Jones Industrial Average index fell 1.51% or 396.85 points, which forced it to move to the line at 25,890.18 points. The Standard & Poor's 500 Index lost 1.08% or 34.40 points and is currently at the level of 3,145.32 points. The Nasdaq Composite Index showed a decrease of 0.86% or 89.76 points, which lowered it to 10 343.89 points. Most investors decided to abandon the action and stay on standby. Two multidirectional factors are perceived differently by market participants: statistics on the economy that contribute positively, and a tense epidemiological situation for which a solution has not yet been found. According to the unconfirmed data of the American government, the new support measures will be more modest than the previous ones. So, the next anti-crisis package will not exceed $ 1 trillion, or perhaps even less than this amount. At least most politicians insist on cutting back on this item. Meanwhile, US authorities have made an ambiguous decision to withdraw the country from the World Health Organization. This is primarily due to failures in the localization of coronavirus outbreaks in certain territories. The US government intends to wait for the results of the incident investigation, and only then will it make a final decision regarding its membership in WHO. However, at present, their participation in the organization has been suspended. This makes investors feel more anxious on the situation. European stock markets also sagged today. After the opening of the trading session, a decrease was noted in all directions. The UK FTSE index fell by 0.2%. The German DAX Index dipped 0.3%. The French CAC 40 index fell the most by 0.5%. There are enough reasons for negative dynamics. So, this morning, the head of the European Central Bank, in his speech noted that the regulator so far does not intend to make changes to its monetary policy and will leave everything as it is for an indefinite time. Recall that earlier, there were several adjustments done. The volume of the program to redeem bonds was doubled to 1.35 trillion euros or 1.52 trillion dollars. Meanwhile, there are positive aspects that are associated with the economic growth of France, which is the second-largest EU economy. According to preliminary estimates, the French economy will be able to increase 19% in the third quarter of this year, and in the fourth, it will add another 3%. This will be one of the most notable rises in the region. However, the rapid increase of the COVID-19 cases in the world is forcing market participants to switch to more restrained work, which immediately affects the current level of the region's main indices. The material has been provided by InstaForex Company - www.instaforex.com |
| Posted: 08 Jul 2020 05:22 AM PDT Technical analysis:
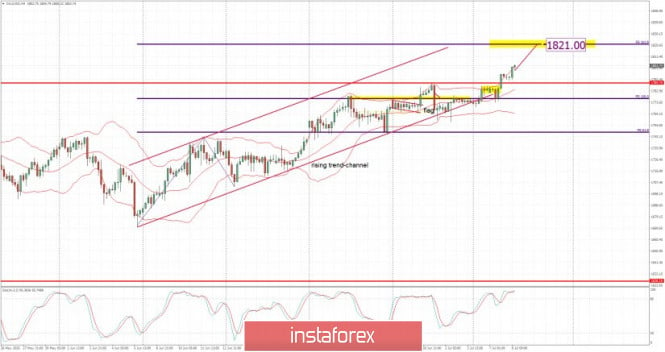
Gold has been trading upwards and we got continuation of the bigger upward trend. Since the Gold did break of $1,789 there is potentila for the bigger rise towards the $1,821. Trading recommendation: Watch for buying opportunities on the dops using the 30 minutes or 1H time-frame. I see potential for the further upside and test of $1,821. The material has been provided by InstaForex Company - www.instaforex.com |
| Oil market remains under pressure, prices are slowly sliding down Posted: 08 Jul 2020 05:11 AM PDT
Yesterday's negative dynamics on the price of oil continued this morning. A rebound takes place ahead of the publication of a new batch of statistics on the level of hydrocarbon reserves in the United States of America. The country's Department of Energy should submit its next report, which will indicate all the changes that have occurred over the past week. This morning, the price of futures contracts for Brent crude oil for delivery in September at a trading floor in London fell to another 0.23% or $0.1. Of course, the decline is not too serious, but even at such a pace, raw materials can lose all the advantage that has been growing in recent weeks. So far, the price has stopped at around $42.98 per barrel. Recall that yesterday's trading closed with a slight drop of 0.05% or $0.02. The price of futures contracts for WTI light crude oil for delivery in August on an electronic trading platform in New York also shows a negative trend today. In the morning, it fell 0.32% or $0.13, which sent it to the mark of $40.49 per barrel. Oil still continues to hold above the strategically important value of $ 40 per barrel, indicating investor restraint. Yesterday's trading session closed with a decrease of 0.02%, which is also not a very serious pullback. While there are no official statistics on oil reserves in the US, we can refer to preliminary forecasts of analysts, who, by the way, are not very positive. According to the American Petroleum Institute, last week there was an increase in black gold reserves by about 2 million barrels. At the same time, gasoline inventories decreased by 1.8 million barrels, and the level of distillates fell by 847,000 barrels. In the strategically important storage in Cushing, stocks also grew by 2.2 million barrels. Other experts argue that there should be a drop in stocks of raw materials by about 3.7 million barrels: gasoline will decrease by 1.2 million barrels, and distillates will decrease by 500,000 barrels. We'll find out which among them is closest to the truth today, as official data from the United States' Department of Energy will be released tonight. However, it was announced yesterday that the reduction in world reserves of black gold, which is proceeding at an average rate of 1.8 million barrels per day, should continue until the end of next year. Such rates will help get rid of the surplus that began to form from the beginning of this year. As reported by the US Department of Energy, the total amount of unsold commercial stocks of crude oil on the market since the beginning of this year was 1.3 billion barrels. As expected, hydrocarbon consumption in the last quarter of this year should be about 101.1 million barrels per day. This figure is higher than what was recorded in the second quarter of 2020, with 16.7 million barrels per day. At the same time, the market supply should also grow, despite all the efforts of OPEC. Of course, the voluntary production restriction prescribed in the contract will be able to restrain this process for some time to a value of 1.8 million barrels per day. This will slightly reduce the resulting surplus. According to the agency, non-OPEC countries reduced their production in the second quarter of this year by about 5.4 million barrels per day compared to the previous period. Almost completely, by 85%, this reduction was due to the efforts of three states: the United States of America, Russia, and Canada. In the USA, the number of actively operating drilling rigs continues to decrease, which leads to a decrease in production volumes. Russia reduced production in order to comply with the terms of the agreement with OPEC. And Canada has ceased to actively extract raw materials due to its too low cost. According to preliminary data, non-OPEC countries in 2020 should reduce hydrocarbon production by 2.2 million barrels per day compared to last year. And in countries that are members of the organization, production will decrease by about 7.9 million barrels per day and will reach the level of 22.5 million barrels per day. However, as early as next month, restrictions on production will not be as severe as it was before, so there will be another factor that puts pressure on the cost of raw materials on the market. In addition, preliminary forecasts reflected an increase in the value of WTI crude oil products per year by approximately 6.9%. It was previously announced that the price will not rise above $ 37.55 per barrel, but now it is confidently holding above $ 40 per barrel. The forecast also expected that the average cost of Brent crude oil for the current year will be at least $ 40.5 per barrel, which in turn is 6.5% higher than the data presented previously. In general, the cost of Brent crude oil may reach $ 49.7 per barrel by the end of the year, while light WTI crude oil may well rise to $ 45.7 per barrel. The material has been provided by InstaForex Company - www.instaforex.com |
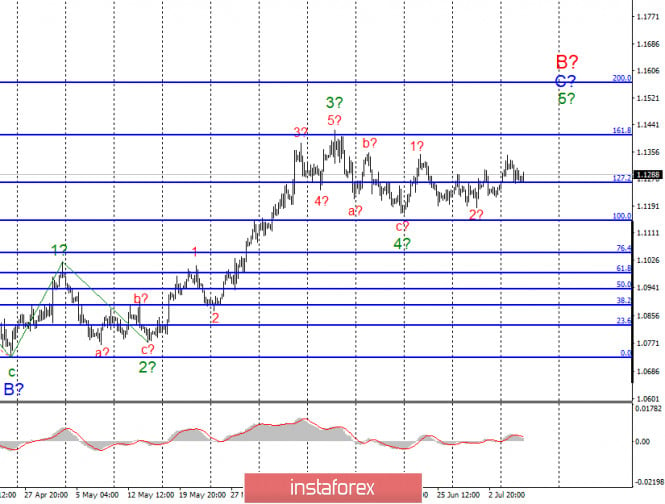
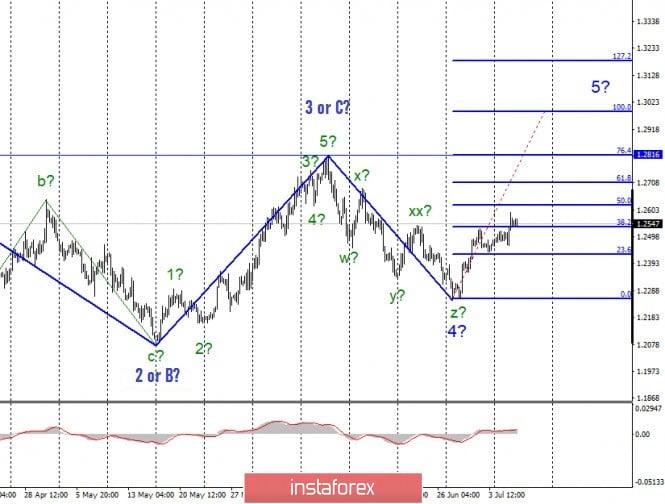
| Posted: 08 Jul 2020 05:05 AM PDT EUR / USD On July 7, the EUR / USD pair lost about 40 basis points, but the current wave markings still include the upward set of waves as parts of wave 5 in C and B. Thus, another increase in quotes will occur, targeting the levels near the 161.8% and 200.0% Fibonacci. Until a breakout from the lower limit of wave 4 in C and B succeeds, the current wave marking will hold. Fundamental component: On Tuesday, quite few macroeconomic reports in the US and EU were published, so the markets did not find reasons and grounds to continue buying positions in the European currency. It resulted to a downward reversal near the highs of waves b and 1, which is quite unusual if we look at it closely in the market. On the one hand, there is a clear wave marking, according to which the upward trend should continue to occur, but on the other hand, many factors influence the mood of the market, one of which is the belief of many analysts that the US dollar will decline due to the growing number of COVID-19 infections in the United States. I, myself, partially agree with this conclusion, but I want to note that the economic factors in America and Europe are now approximately the same. Just the other day, the European Commission published new forecasts for GDP for 2020 and 2021, which have been revised downward due to the deteriorating situations. Moreover, both Christine Lagarde and representatives of the European Commission have repeatedly stated that the restoration of the EU economy will be long and difficult, and the current problems with regards to reaching an agreement between the UK and EU on Brexit adds pressure to it. The aim of the supposed agreement is that the parties will continue to trade with each other in free trade mode, but if it does not happen, the British and European economy will not reach several percent of GDP in 2021 and the subsequent years. This will result to a much slower economic recovery. Thus, the current growth of the European currency is not confident, and at any moment, the US dollar may again take the lead in the markets. Nevertheless, any deterioration / improvement in the economies of the European Union and the United States will seriously influence the markets. General conclusions and recommendations: The EUR / USD pair may continue to form the rising wave in C to B, so buy positions with targets located near the calculated marks 1.1406 and 1.1570, which equates to 161.8% and 200.0% Fibonacci. GBP / USD The GBP / USD pair gained about 50 base points on July 7, so the formation of the alleged wave 5 of the upward trend continued, taking a form of a "zigzag" pattern. If this assumption materializes, then the increase in quotes will continue, targeting the areas near the peak of wave 3 or C. Wave 5 itself can take a rather complex and extended form, the same as the pattern of the previous rising waves. Fundamental component: The British pound was in demand on Tuesday, despite the fact that there are no positive news for it. The negotiations on Brexit once again failed to reach a consensus, even though the press regularly receives statements that the parties are going to carry out new stages and ultimately intend to sign an agreement. Fortunately, the markets currently do not take into account this news when trading. General conclusions and recommendations: The GBP / USD pair has greatly complicated the current wave marking, which now involves the construction of a new upward wave. Hence, buy positions in the market, targeting the levels 1.2816 and 1.2990, which are the peak of wave 3 or C and 100.0% Fibonacci. The material has been provided by InstaForex Company - www.instaforex.com |
| July 8, 2020 : GBP/USD Intraday technical analysis and trade recommendations. Posted: 08 Jul 2020 04:47 AM PDT
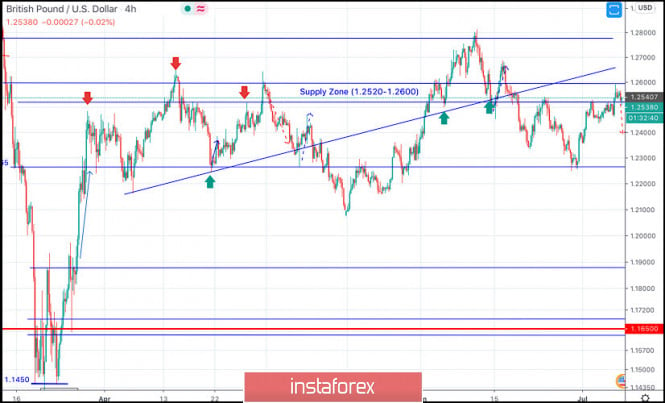
Recently, Bullish breakout above 1.2265 has enhanced many bullish movements up to the price levels of 1.2520-1.2590 where temporary bearish rejection as well as a sideway consolidation range were established (In the period between March 27- May 12). Shortly after, transient bearish breakout below 1.2265 (Consolidation Range Lower Limit) was demonstrated in the period between May 13 - May 26. However, immediate bullish rebound has been expressed around the price level of 1.2080. This brought the GBPUSD back above the depicted price zone of 1.2520-1.2600 which failed to offer sufficient bearish rejection. Hence, short-term technical outlook has turned into bullish, further bullish advancement was expressed towards 1.2780 (Previous Key-Level) where signs of bearish rejection were expressed. Short-term bearish pullback was expressed, initial bearish destination was located around 1.2600 and 1.2520. Moreover, a bearish Head & Shoulders pattern (with potential bearish target around 12265) was recently demonstrated on the chart. That's why, bearish persistence below 1.2500 ( neckline of the reversal pattern ) was needed to pause the bullish outlook for sometime to enable further bearish decline. However, significant bullish rejection around 1.2265 brought the GBP/USD pair back towards 1.2600 where a cluster of resistance levels are located. Signs of bearish rejection should be watched around the current price zone of 1.2520-1.2600 (recent supply zone) as it indicates a high probability of bearish reversal. Trade recommendations : Intraday traders can consider the current bullish pullback towards the depicted Supply Zone (1.2520-1.2600) for a valid SELL Entry. Stop Loss should be placed above 1.2600 while T/P level to be located around 1.2450 & 1.2265. The material has been provided by InstaForex Company - www.instaforex.com |
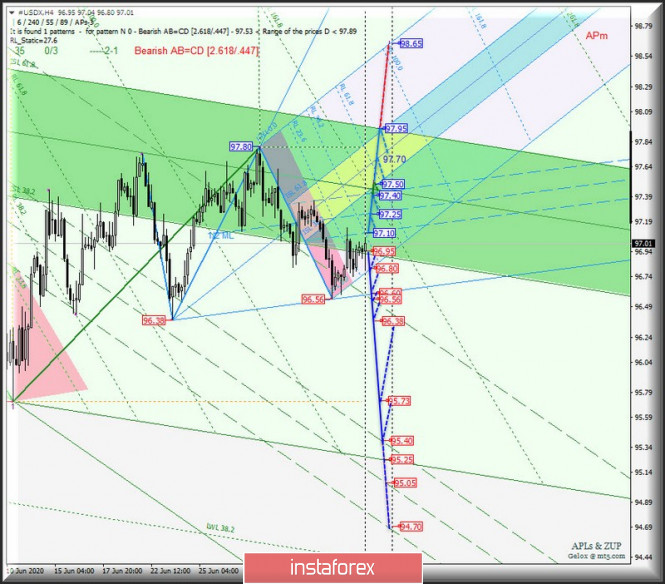
| #USDX & EUR/USD - h4. Complex analysis of APLs & ZUP market scenarios from July 09, 2020 Posted: 08 Jul 2020 04:30 AM PDT Operational scale is Minute (4-hour timeframe) Battle of EUR versus USD. Scenarios of further moves of #USDX and EUR/USD according to the 4-hour chart from July 09, 2020 US Dollar Index Starting from July 09, 2020, the odds are that the US dollar index will carry on trading in the equilibrium zone (97.95 - 97.50 - 96.95) of the equilibrium pitchfork under the Minute operational scale. We should bear in mind the direction in which the trading range is broken and it is going to be tested. *Resistance level of 97.10 which coincides with the lower border of a the Median Line pitchfork channel under the Minute operational scale. *Support level is 96.95 which coincides with the lower border ISL38.2 of the equilibrium zone under the Minute operational scale. When resistance of 97.10 is broken, #USDX will continue its move inside the borders of a Median Line (97.10 - 97.25 - 97.40) and the equilibrium zone (97.50 - 97.70 - 97.95) of the pitchfork under the Minute operational scale with prospects of reaching the final line of FSL Minuette (98.65). In case support of 96.95 is broken at the lower border ISL38.2 of the equilibrium zone under the Minute operational scale, the US dollar index will continue its decline towards the following targets: -the initial line SSL under the Minute scale (96.80) -the control line LTL under the Minute scale (96.60) -the final Shiff Line Minute (96.56) -lows (96.38 - 95.73) The outlook is that the borders of the channel a Median Line (95.40 - 95.05 - 94.70) of the pitchfork under the Minute scale.
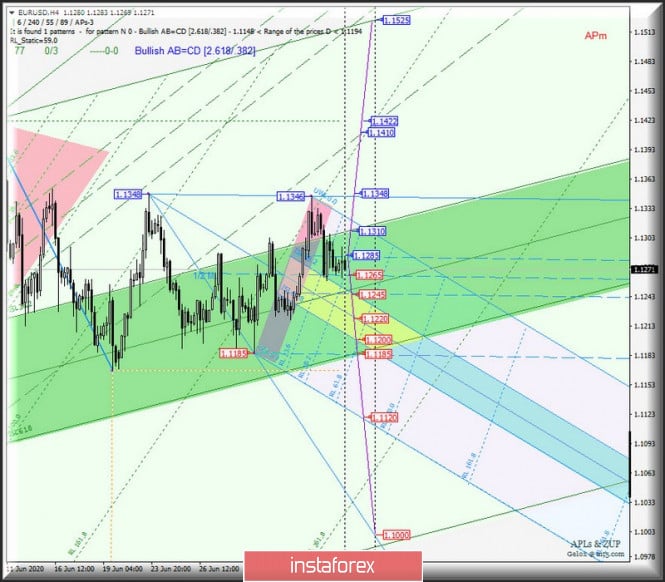
Scenarios for EUR/USD from July 09, 2020 The currency pair is set to go on trading inside the equilibrium zone (1.1310 - 1.1245 - 1.1185) of the pitchfork under the Minute scale. We should take into account that the borders of the channel of a Medina Line (1.1285 - 1.1265 - 1.1245) of the pitchfork is tested under the Minute scale. In case support of 1.1245 is broken at the lower border of the channel a Median Line Minute (1.1245), EUR/USD will carry on with its move inside the equilibrium zone (1.1245 - 1.1220 - 1.1200) of the pitchfork under the Minute operational scale. On the other hand, in case ISL61.8 Minute (1.1200) is breached, the trading instrument will continue its move towards the targets: -the lower border ISL61.8 (1.1185) of the equilibrium zone of the pitchfork under the Minute operational scale -local low of 1.1168 -the final line FSL Minute (1.1120) Alternatively, if the upper border of the channel a Median Line of the pitchfork under the Minute scale is broken which coincides with resistance of 1.1285, EUR/USD will develop the uptrend towards the following targets: -the upper border of ISL38.2 (1.1310) of the equilibrium zone of the pitchfork under the Minute scale -local high of 1.1348 -the final Shiff Line Minute (1.1410) -high of 1.1422
The review is composed without taking into account the news background and the hours of trading sessions at key financial hubs. This information should not be considered guidelines for placing sell or buy orders, but it is meant for your awareness. Formula for calculating the US dollar index: USDX = 50.14348112 * USDEUR0.576 * USDJPY0.136 * USDGBP0.119 * USDCAD0.091 * USDSEK0.042 * USDCHF0.036It is a weighted geometric mean of the dollar's value relative to the following particular currencies: EUR — 57.6 % JPY — 13.6 % GBP — 11.9 % CAD — 9.1 % SEK — 4.2 % CHF — 3.6 %USDX has its origin in March 1973. At its start, the value of the US Dollar index was 100.000. At that time, other major currencies began their free exchange relative each other. The material has been provided by InstaForex Company - www.instaforex.com |
| Greenback strengthens amid coronavirus fears Posted: 08 Jul 2020 04:23 AM PDT
On Tuesday, the greenback strengthened against its major counterparts. On Wednesday, the US dollar continues to gain ground. Market participants are still focusing on the news about the spread of the coronavirus infection across the world. Information about a significant increase in COVID-19 cases in the United States and the reintroduction of quarantine restrictions in some other countries undermine hopes for a V-shaped recovery of the global economy, as well as contribute to rising demand for safe-haven assets, including the greenback. "The mood changes day by day, but the dollar looks to be supported for now as investors turn more cautious about the virus," said foreign exchange strategists at Daiwa Securities. Recently, a number of representatives of the US Federal Reserve System (FRS) expressed concern that an increase in COVID-19 cases could harm economic growth in the United States at the same time as stimulus measures started bearing fruit. "The Fed's comments on the economy sound somber. There's reason to worry because it is hard to see when the virus will be brought under control." - noted in Daiwa Securities. On Tuesday, the most important event in the foreign exchange market was the decision of the Australian government to tighten quarantine restrictions. According to the head of the Department of the Treasury, the lockdown is jeopardizing the economic recovery progress. Moreover, the country might lose around $1 billion on a weekly basis. Even though the Reserve Bank of Australia (RBA) believes that the economic consequences of the pandemic will be less severe than forecast, increased uncertainty led to a depreciation of the Australian dollar. Experts suggest that new measures to contain COVID-19 in the country will help return the AUD/USD pair to the level of 0.66.
There are fears that other countries may repeat the fate of Australia. In March, the country's government faced the first wave of the coronavirus infection and was able to smooth out the incidence curve by imposing strict quarantine measures. In the case of another outbreak of COVID-19, other countries may follow in Australia's footsteps. This week, the EUR/USD pair continues to show uncertain dynamics: the pair is either decreasing or growing. According to experts at the UOB, the pair should close above the upper boundary of the side channel at 1.1170–1.1380 in order to target the high of the previous month at 1.1422. As for now, the likelihood of this scenario is minimal. However, the probability will increase if the EUR/USD pair remains above 1.1240 in the coming days. The euro is placed under pressure amid political disagreements within the EU regarding the formation of a fund to save the region's economy. Recently, Christine Lagarde, President of the European Central Bank, expressed doubts that EU leaders will be able to agree on all disputed issues by July 18. Christine Lagarde believes that an agreement on this issue will be reached only by the end of this month. The GBP/USD pair failed to rise to the area of 1.2570 and pulled back from Tuesday's three-week highs. On Wednesday, Rishi Sunak, British Chancellor of the Exchequer, is expected to announce new economic support measures, including distributing £500 vouchers for each adult and £ 250 per child to increase spending in the sectors most affected by the pandemic. Traders are also focused on Brexit negotiations between London and Brussels which may influence further movement of GBP/USD. The material has been provided by InstaForex Company - www.instaforex.com |
| You are subscribed to email updates from Forex analysis review. To stop receiving these emails, you may unsubscribe now. | Email delivery powered by Google |
| Google, 1600 Amphitheatre Parkway, Mountain View, CA 94043, United States | |









No comments:
Post a Comment