
Forex analysis review |
- Forecast for EUR/USD on July 10, 2020
- Forecast for AUD/USD on July 10, 2020
- Forecast for USD/JPY on July 10, 2020
- Hot forecast and trading signals for the GBP/USD pair on July 10. COT report. Buyers keep the pair in their hands. Sellers
- Hot forecast and trading signals for the EUR/USD pair on July 10. COT report. Bulls urgently need to gather strength and
- Overview of the GBP/USD pair. July 10. Negative from Britain, negative from the US. Traders are still taking into account
- Overview of the EUR/USD pair. July 10. Is a new panic beginning to engulf the markets, or is everything going according to
- Evening review for EUR/USD on 07/09/2020
- July 9, 2020 : EUR/USD Intraday technical analysis and trade recommendations.
- July 9, 2020 : GBP/USD Intraday technical analysis and trade recommendations.
- EUR/USD. Market believes Mnuchin: dollar celebrating a small victory, but you should not rush to sell
- Comprehensive analysis of movement options for EUR/GBP & EUR/JPY & GBP/JPY (H4) on July 10, 2020
- USD devaluation prospects
- AUD/USD. Weak greenback not a reason to open long positions
- Oil slowed down before the next batch of statistic report
- Positive outlook on EU, Asia, and US stock exchanges remain amid growing tensions
- Chinese yuan continues to grow rapidly
- Bitcoin form a bullish technical pattern
- Gold remains in bullish trend
- Analysis of EUR/USD and GBP/USD on July 9. Boring end of the trading week.
- GBP/USD: plan for the American session on July 9
- EUR/USD: plan for the American session on July 9
- America struggles to survive amid pandemic
- BTC analysis for July 09,.2020 - Breakout of multi-day balance to the upside. Watch for buying opportunities with the target
- Analysis of Gold for July 09,.2020 - Major upward target at $1.820 has beeen reached. Anyway. nroken upward trendline and
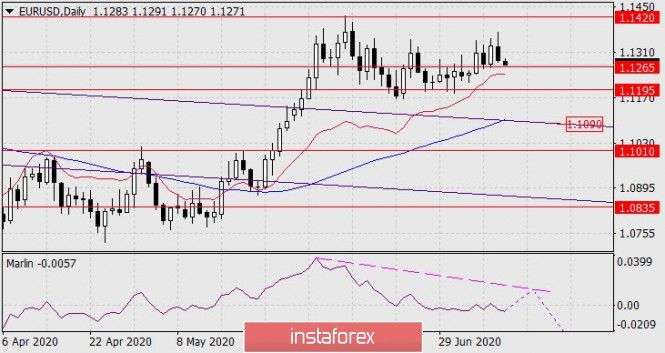
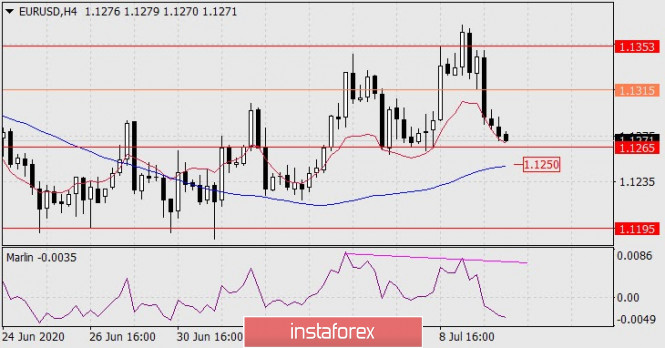
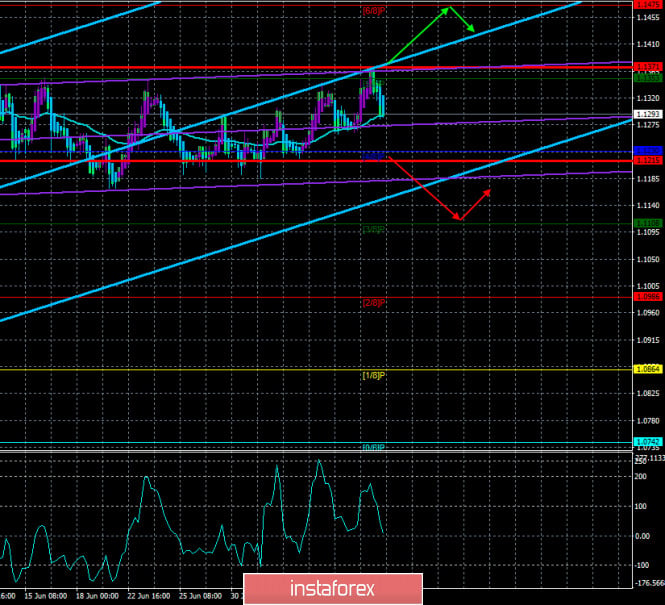
| Forecast for EUR/USD on July 10, 2020 Posted: 09 Jul 2020 08:10 PM PDT EUR/USD The dollar began its offensive on a broad front on Thursday - other currencies, raw materials, and commodity markets declined relative to the dollar. The euro lost 45 points. The Marlin oscillator is moving deeper into the negative zone on the daily chart, but the price is still above the balance line (red indicator) and above the target level of 1.1265. Formally, this is the intention of the price to work out the nearest support of 1.1195 and go even lower, that is, a reversal to achieve deeper goals (1.1090, 1.1010), but the probability of Marlin returning to the growth zone with a subsequent price movement to 1.1420 and forming a divergence also remains. The option for a further decline will come into effect after the price is pinned below the level of 1.1195, the option for an increase could start when the price overcomes the control level of 1.1315. The reversal divergence has already formed on the four-hour chart, and the price going under the MACD line (1.1250) will also mean that the price is pinned at 1.1265. In this case, we are waiting for a decline to the first goal of 1.1195. The price's exit above the signal level of 1.1325 opens an intermediate target of 1.1353, and consolidating above it will continue to grow to 1.1420. The material has been provided by InstaForex Company - www.instaforex.com |
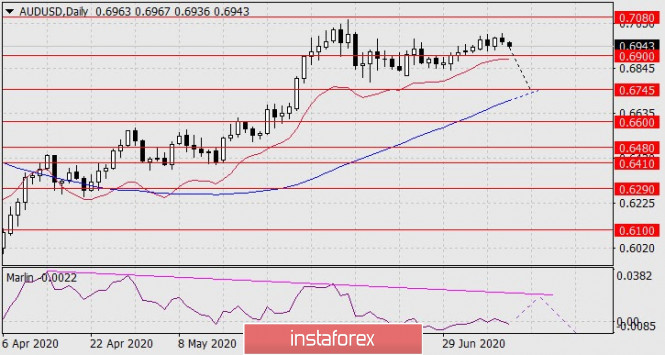
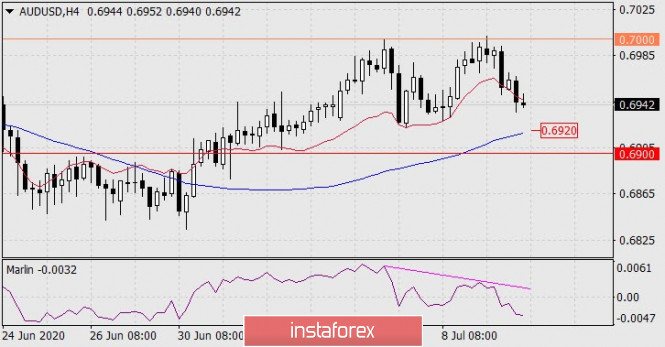
| Forecast for AUD/USD on July 10, 2020 Posted: 09 Jul 2020 08:08 PM PDT AUD/USD The Australian dollar is losing interest in growth every day. The price spent the whole week in a sideways direction, it closed Thursday with a black candle of 16 points. This nature of the price significantly reduces the probability of forming a triple divergence for Marlin. Commodity markets also intervened: oil fell 3.18% (WTI) yesterday, and Australia's most important export commodity iron ore fell 2.37%. The composite index of non-ferrous metals is still growing - yesterday's growth was 1.29%. Consolidating the aussie below the 0.6900 level can turn the price into a new medium-term trend, the first goal is 0.6745 - support for the daily MACD line. The aussie still has a chance to continue growing to the level of 0.7080, but the price will need to overcome yesterday's high (0.7002) for this. The Marlin divergence formed on the four-hour chart. The price is below the red balance indicator line. Preparation for the attack on 0.6900 is complete, the only thing left is to implement it. This could prevent the MACD line at around 0.6920. We are waiting for developments. The material has been provided by InstaForex Company - www.instaforex.com |
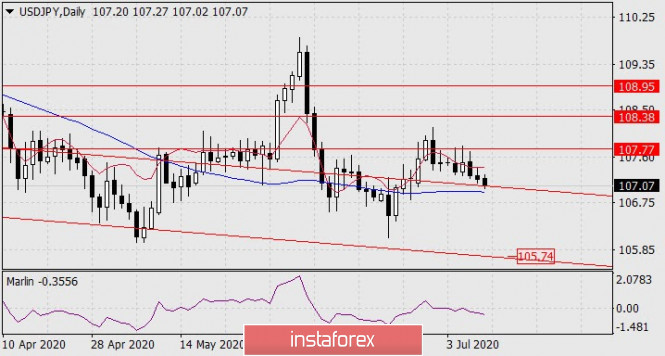
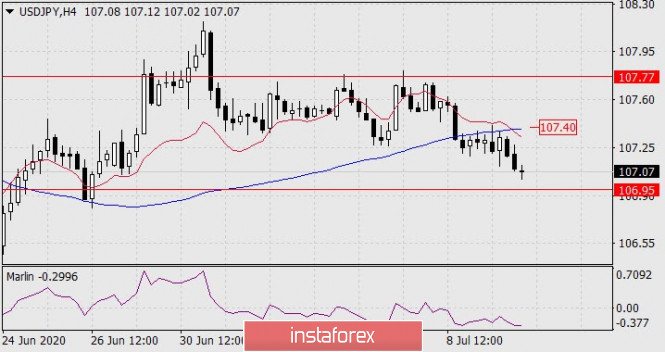
| Forecast for USD/JPY on July 10, 2020 Posted: 09 Jul 2020 08:08 PM PDT USD/JPY The US stock market fell by 0.56% (S&P 500) on Thursday, the yen followed it, losing five points. Investors were probably not quite ready for the stock market to slip, so the decline in the yen is moderate on the internal desire of investors to still buy the USD/JPY pair, because the dollar itself is strengthening. However, consolidating the price under the MACD line (106.95) on the daily chart may change the nature of the market to the opposite – the yen will fall to support the embedded price channel line in the area of 105.74. The Marlin oscillator has been in the negative trend zone for more than a week. The price is pinned under the balance and MACD indicator lines, Marlin is in the negative zone, the intention of the price to go below 106.95 is clear, but the moment is critical, so you should wait for the price to actually consolidate under the specified level. Afterwards, you can open short positions on the pair. An exit of the price over the MACD line, above 107.40, will send the price back to the level of 107.77. This will be an even more powerful attack on the price of it than it was in the first decade of July. The material has been provided by InstaForex Company - www.instaforex.com |
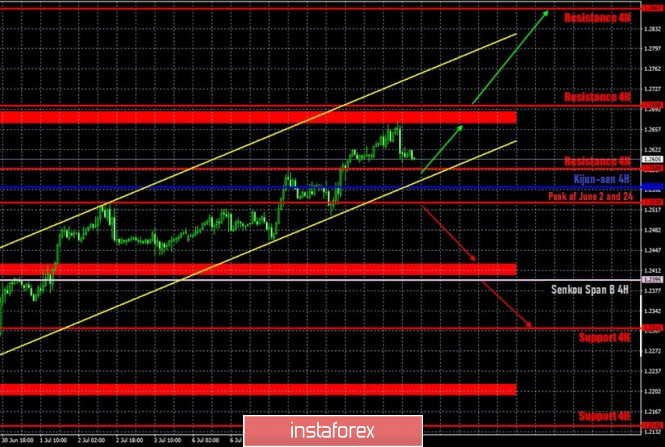
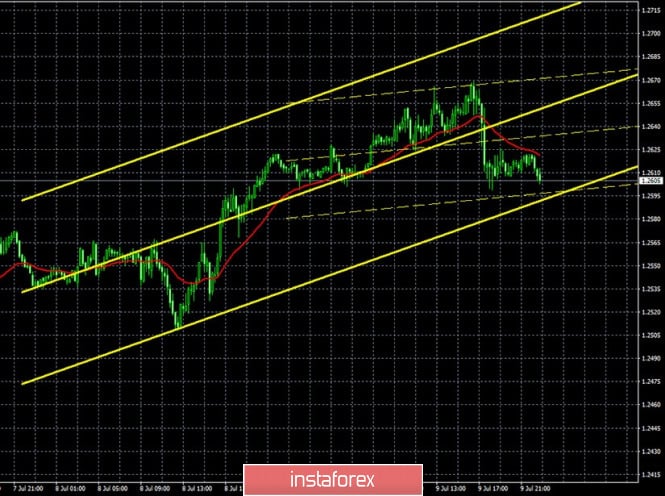
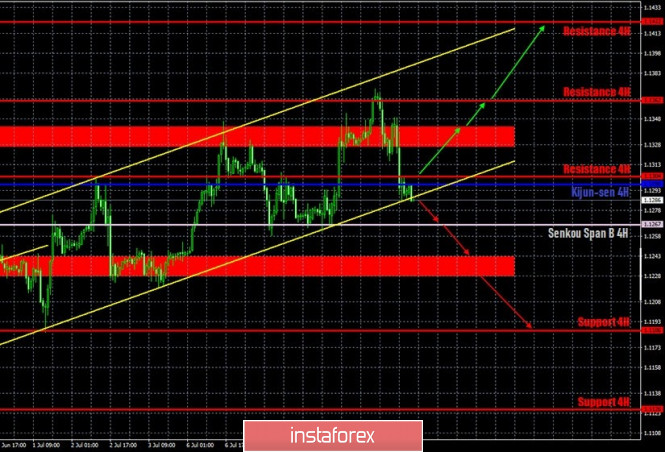
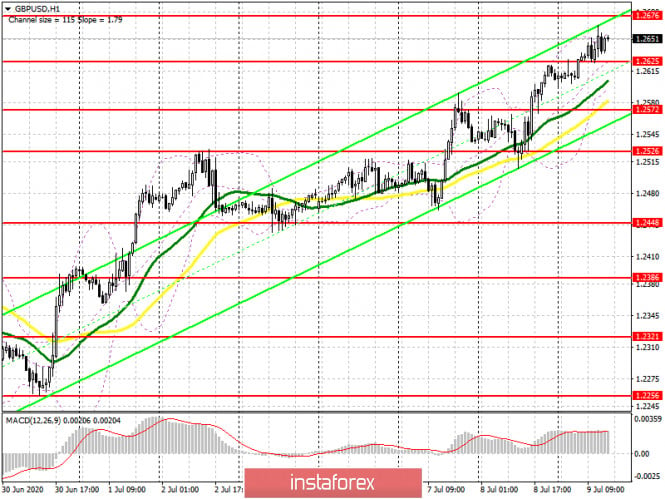
| Posted: 09 Jul 2020 05:17 PM PDT GBP/USD 1H The GBP/USD currency pair, unlike EUR/USD, started a much weaker correction inside its ascending channel. In the British currency's case, there are no special prerequisites for statements about the end of the upward trend in the short term. The quotes are located near the lower border of the channel and the critical Kijun-sen line. The bulls gave up on reaching the resistance area of 1.2668–1.2688. However, this does not mean that the pair's movement vector has changed to going up. In general, the US dollar continues to remain under pressure from market participants and, even if the pound sterling is quite confidently growing in price, this does not mean that America is doing well. You see, at the same time, Great Britain is not doing so well. The British pound does not have a long-term fundamental support that would allow it to expect a stronger growth. Therefore, for the time being, we can expect that there will be a rebound from the lower border of the channel with the resumption of upward movement. GBP/USD 15M Both linear regression channels continue to be directed upwards on the 15-minute timeframe, so the overall trend remains upward in the short term. The latest COT report for the British pound was not as categorical as it was for the euro. Professional traders opened both Long and Short contracts during the reporting week (June 24-30). However, there were so much more for the latter, almost 4,500. Given the fact that the total number of open positions for sale in the Non-commercial category is 56,000, and the net position is currently -20958, then 4,500 is quite a lot. However, for the period after June 30, the British pound only continued to grow in price, ignoring the COT report. Thus, there are two possible options. Either professional market participants in the time period of July 1–9 sharply changed their mindset and began to open contracts to buy the pound, or a serious and prolonged fall in the British currency is brewing. In any case, we do not recommend opening positions in any direction without confirmation by technical signals. The fundamental background for the GBP/USD pair on Thursday, we can say, was on the side of the US currency. At least this is what market participants concluded. There has been no news from the UK for several days. Meanwhile, US Treasury Secretary Steven Mnuchin made a speech yesterday, who announced that the US Congress may adopt a new project to help the economy in the near future. Mnuchin believes that this could happen before the end of July. However, Mnuchin also said that payments to Americans will not be as generous as previously planned, as this deters people from looking for work. On the one hand, this is good news for the American economy. On the other hand, nothing has been decided yet. Market participants reacted, if not to rumors, then to promises. The aid package may not be passed by Congress and in any case means that the current state of the US economy is deplorable. This is not surprising, since all countries of the world have been seriously affected by the epidemic, quarantine and the coronavirus crisis. However, the epidemic persists in the United States and this should be the number one topic for the dollar. Thus, we believe that the dollar is unlikely to receive long-term support. There are two main scenarios as of July 10: 1) The prospects for upward movement are preserved thanks to the ascending channel. A small correction that took place could be completed today. The price rebound from the lower border of the channel or the Kijun-sen line will be a signal to open new purchases with the goals of the resistance area of 1.2668–1.2688 and the resistance level of 1.2867. Potential Take Profit in this case will be from 70 to 270 points. 2) Sellers are advised to wait for the pair to consolidate below the ascending channel, and at the same time below the Kijun-sen line(1.2557). In this case, the downward trend will resume, and the first targets for sell orders will be the support area of 1.2403–1.2423 and the support level of 1.2311. Potential Take Profit in this case will be from 110 to 230 points. The material has been provided by InstaForex Company - www.instaforex.com |
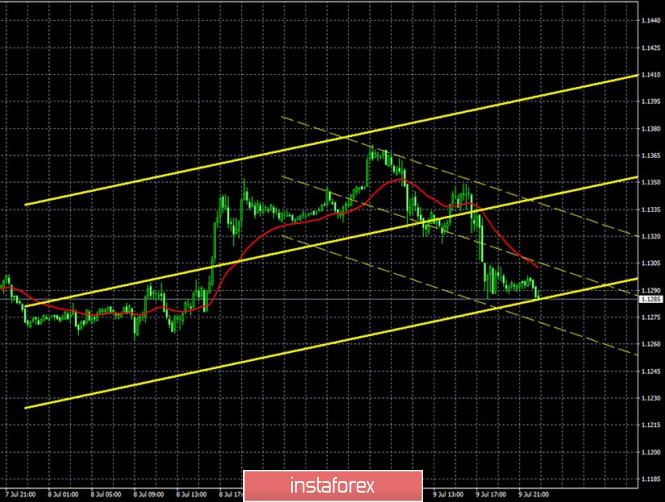
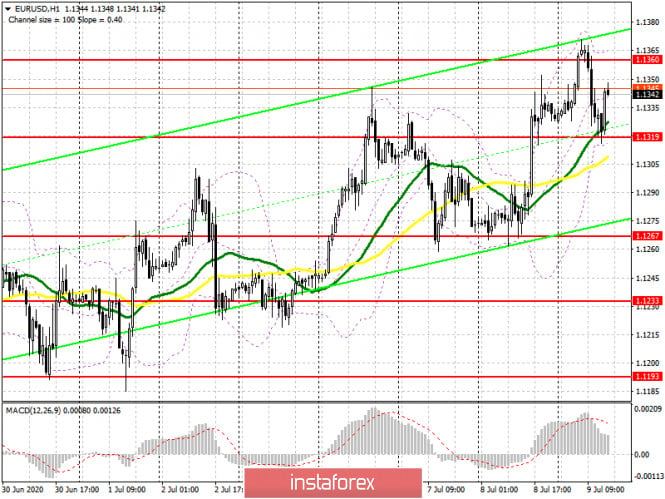
| Posted: 09 Jul 2020 05:17 PM PDT EUR/USD 1H Buyers made another attempt to continue forming an upward trend on the hourly timeframe on July 9, which, by the way, is visible only on small timeframes. A side channel is clearly visible on the four-hour chart and above, in which the euro/dollar pair has been trading in for a month. The high that is in favor of the bulls is the presence of a small upward bias in recent weeks, which is expressed by an ascending channel on the lower timeframe. However, buyers once again failed to confidently overcome the resistance area of 1.1326–1.1342 yesterday, and when their attempts were crowned with local success, an insurmountable barrier was found in the resistance level of 1.1362. Thus, the final rebound from this level sent the quotes to the lower border of the ascending channel, near which the fate of the pair will now be decided for the next few days and weeks. If buyers do not interfere in what is happening, the quotes will fall below the channel, which will mean a change in the trend to a downward one. Overcoming the Senkou Span B line will be a strong enough signal to open sales. Thus, the bears need to overcome the 1.1285–1267 area, and the bulls need to keep this area. EUR/USD 15M The lower channel of linear regression turned down on the 15-minute timeframe, which also signals a downward trend (now). However, the key levels and support areas are focused on the hourly timeframe, so it is more informative. Just yesterday, after analyzing the latest COT report, we mentioned that professional traders actively got rid of Buy-contracts and opened Sell-contracts during the reporting week. Therefore, a strong upward movement did not correspond to the nature of positions opened by professional players, who are considered to move the market in one direction or another. We assumed that the euro has few prospects for further growth, although, from a fundamental point of view, the single currency has some support. However, the markets are driven not by the foundation, but by traders, primarily large ones. The fundamental background for the EUR/USD pair is now somewhat contradictory. On the one hand, the euro has recently had some support due to the high growth rates of COVID-2019 distribution abroad. However, in articles on fundamental analysis, we said that it is unlikely for the euro to go far on this factor alone. It is too early to say that the upward trend on the hourly chart is complete, but the first steps in this direction have been taken. At the same time, the US currency has few prospects for strong growth. As we have already mentioned, the coronavirus epidemic is not just a disease, it is a pandemic that has caused the most serious crisis in recent decades. Thus, if the pandemic continues to develop in the United States, the country's economy will not recover, despite any assurances from US President Donald Trump that there will already be a serious recovery in the third and fourth quarters of 2020, and "2021 will be a great year for the American economy." So far, everything is going to the fact that the US economy will experience another lockdown or partial quarantine, since quarantine measures have already been tightened in some states, and the total number of cases of the disease has exceeded three million. Based on all of the above, we have two trading ideas for July 10: 1) Buyers reached the area of 1.1326-1.1342 for the fifth time in the last month and have once again failed to confidently overcome it and leave it behind. Thus, we recommend buying the euro only if the bulls keep the initiative in their hands, the pair will remain inside the ascending channel, and later it will be possible to gain a foothold above the area of 1.1326–1.1342. In this case it will be possible to open purchases with the goals of 1.1362 and 1.1422. Potential Take Profit is up to 80 points in this case. 2) Since the bears have not yet managed to leave the ascending channel, it is too early to open Sell positions. We recommend waiting for the moment when traders will be able to pin the pair below the Senkou Span B line(1.1267), which will automatically mean overcoming the channel. In this case, the bulls will give the initiative to the bears, and we recommend selling the pair with targets at 1.1228, 1.1186 and 1.1126. The potential Take Profit in this case is from 20 to 130 points. The material has been provided by InstaForex Company - www.instaforex.com |
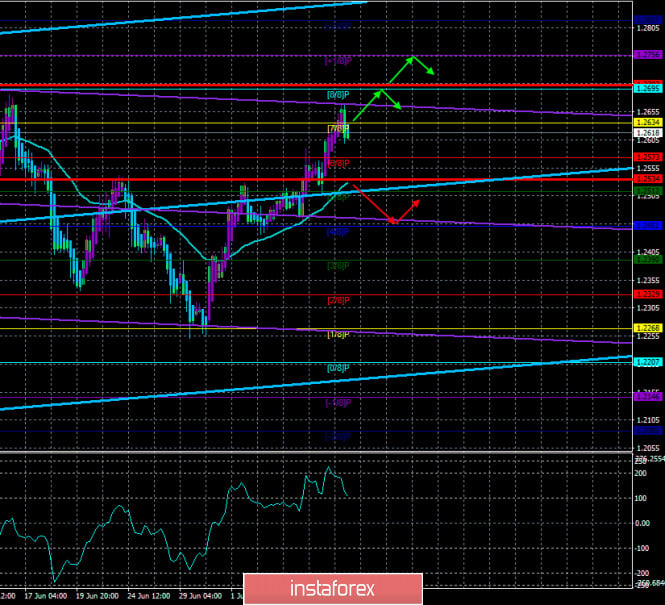
| Posted: 09 Jul 2020 05:13 PM PDT 4-hour timeframe
Technical details: Higher linear regression channel: direction - upward. Lower linear regression channel: direction - sideways. Moving average (20; smoothed) - upward. CCI: 105.7463 The British pound has been trading higher for most of the last trading day of the week. Market participants still attached high importance to what is happening in the US at this time and ignored all the negative news about the negotiations between Brussels and London. This is partly true. The British currency has been falling in price on Brexit news for the past three years. Now, when for once things are not so bad in the UK against the backdrop of America, why should the pound not show the maximum possible growth? We certainly do not believe that the British currency can return to, for example, $ 1.35 in 2020. However, in general, if you look at the monthly chart, it is obvious that the long-term downward trend in the pound has been maintained since 2007, and the last four years are just its final stage. Thus, against the background of a fall from the level of $ 2.11, the decline in the last 3-4 years looks scanty. But the US economy has finally begun to allow other currencies to breathe more easily. What will happen in the long term is still unclear. However, while there is a chance to grow, you need to grow. Over the past day, no new news was received on the topic of Brexit and negotiations with Brussels. But more and more experts and political scientists are closely examining the situation with Hong Kong. Recall that under the agreement with London in 1984, Hong Kong must maintain a special status (something like autonomy) in China for 50 years, starting in 1997. The city should have its judicial system, government, currency, and other attributes of independence independent of the will of Beijing, leaving only issues of international politics and national security to the Chinese capital. However, the adoption by Beijing of the law on "national security in Hong Kong" levels the entire autonomy of Hong Kong, since any citizen of Hong Kong can now be tried under Chinese laws, accusing him of terrorism, espionage, and any other actions that endanger Chinese security. Naturally, Beijing immediately came under criticism not only from the US but also from the UK, the European Union, and Australia. Experts believe that now there will be tension in relations not between China and the United States, but between China and the whole world. And here, the formation of the so-called "anti-Chinese coalition" will be just in Washington's hands. In principle, China, despite all its power, which allows it to conduct an equal dialogue with the same States, can be said to stumble over the same rake that the Soviet Union and the other Communist States previously stumbled over. Excessive concentration of power in one hand, the absence of a coalition as such - is not always good. All power in China is the CPC (Communist Party of China), and the CPC is Xi Jinping, its leader. The calculation of the Chinese government, according to many political scientists, is extremely simple. Since much of the world depends on the Chinese economy and Hong Kong's financial flows, the CPC believes that neither the United States nor the European Union will simply escalate the conflict and turn a blind eye to its actions concerning Hong Kong. The Chinese leadership believes that the capitalist West is primarily guided by the principles of business, and therefore will not allow itself to miss the profit that could be obtained by continuing to cooperate with China and Hong Kong on its Chinese terms. And even more so, Western capitalists are unlikely to voluntarily give profits to competitors, who can very quickly displace American companies and American businessmen from the Hong Kong "pond". And here, much will now depend on the ability of all those who are dissatisfied with China's policy towards Hong Kong to conduct targeted actions. The European Union and the United States can "express dissatisfaction", impose sanctions against 5-10 Chinese officials and thus end the process of proceedings, as it is called, peacefully. Formally, the sanctions will be imposed, but not really. But if the EU or the US impose real sanctions, which may concern tourism, trade, various technologies, and financial transactions (yes, the notorious SWIFT international payment system), then China's prestige and well-being may be seriously damaged. In this case, it is unlikely that Beijing will sit back and not strike back at its enemies. This means that the world may face a new cold war, new trade conflicts, and well if nothing else. And strange as it may seem, the future US presidential elections will be of great importance for the development of mitigation of the US-China conflict, which can involve the whole world. If Trump wins the election, there is no doubt that he will continue the dialogue with China from a position of strength. There is no doubt that new sanctions and trade restrictions will be imposed, and at the same time, Washington will seek to win over other major world players to create a blockade for China, as much as possible to limit its capabilities and influence in the international arena. China, of course, will respond and we hope that another virus will not break out from some laboratory. If Joe Biden, who is known for his friendly attitude towards China, wins, there is no doubt that relations between the two economic giants will be on the path of easing and improving. What will be beneficial at the end of the whole world? We are not going into a more complex and long-term policy now. Well, in the shorter term, the "coronavirus" epidemic in the United States is more important. We do not see any other reasons for the sharp strengthening of the British currency. However, we believe that such grounds for buying the pound may cease to apply at any time. This means that we should not forget about technical factors that are more important at this time. Moreover, the macroeconomic reports continue to be ignored by traders, the future of both the British and American economies is unclear, and no publication or speech by a high-ranking official is planned for the last trading day of the week.
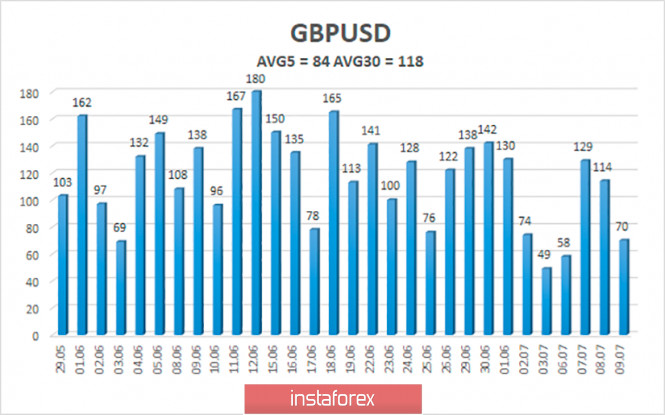
The average volatility of the GBP/USD pair continues to remain stable and is currently 84 points per day. For the pound/dollar pair, this value is "average". On Friday, July 10, thus, we expect movement within the channel, limited by the levels of 1.2534 and 1.2703. Turning the Heiken Ashi indicator upward will indicate the resumption of the upward movement. Nearest support levels: S1 – 1.2573 S2 – 1.2512 S3 – 1.2451 Nearest resistance levels: R1 – 1.2634 R2 – 1.2695 R3 – 1.2756 Trading recommendations: The GBP/USD pair started a weak correction on the 4-hour timeframe. Thus, today it is recommended to open new buy orders with the goals of 1.2695 and 1.2756, after the reversal of the Heiken Ashi indicator to the top. It is recommended to sell the pair after fixing quotes below the moving average with the first goals of 1.2451 and 1.2390. The material has been provided by InstaForex Company - www.instaforex.com |
| Posted: 09 Jul 2020 05:12 PM PDT 4-hour timeframe
Technical details: Higher linear regression channel: direction - upward. Lower linear regression channel: direction - sideways. Moving average (20; smoothed) - sideways. CCI: 7.7371 The fourth trading day of the week again passed with a slight advantage of the European currency. However, in the American trading session, the quotes moved down a little, but at the same time, the pound calmly continued to trade with an increase. As we have said many times, there is no positive macroeconomic information coming from the European Union or the UK. Therefore, it is difficult to assume that yesterday's growth was associated with positive data from the EU and the Kingdom. Most likely, market participants continued to sell off the US currency against the backdrop of the second "wave" of the coronavirus epidemic, which is growing like a snowball. And this is becoming a big problem for the United States. If a few weeks or months ago, the epidemic was about the same scale in the European Union and the United States, now the situation is the opposite. In the European Union, they managed to reduce the growth rate of the disease to "less than 1" (the contagion index, which shows how many people are infected by each infected person) through strict quarantine and awareness of citizens. The value "less than one" means that each patient infects less than one person, so the epidemic is on the wane, and governments can only respond quickly to reports of new outbreaks and localize these places of new infections. At the same time, Europe really has every reason to restart the economy, complete or ease quarantines, and open borders. But in the United States, nothing like this can boast. The total number of cases of "coronavirus" has exceeded 3 million, the authorities are doing nothing to stop the spread of the infection, Donald Trump continues to make discouraging statements, and Anthony Fauci sounds the alarm, saying that "the virus is out of control". In just one day, on July 8, 61.5 thousand cases of the disease were recorded in the United States. This is the maximum increase since the beginning of the pandemic. As you can imagine, the epidemic is only progressing. Thus, now it is the American economy that is at risk since it will be slowed down by the second "wave" of the epidemic in any case. Also in Europe, not everything is fine. According to the authorities of some states, the virus has been curbed, however, it has not gone away, and if people do not comply with the mask regime and rules of distancing, the second "wave" can not be avoided. However, there is no second "wave" in Europe yet, so it is the dollar that continues to feel quite weak against the euro. Most importantly, the "coronavirus" in the United States has already become a topic of political battles. For all the statements of Donald Trump concerning the "coronavirus", you can create a whole collection, which will then be shown in universities that prepare future politicians and rulers for graduation. It is the "coronavirus" that can cause Donald Trump to become one of the few presidents who will not be re-elected for a second term. One of the latest statements of Trump caused another public outcry, as the leader of the American nation jokingly stated that "we probably need to conduct fewer tests so that the incidence begins to decrease". It was Trump's joking tone that angered the media, Democrats, and everyone who does not support the US President. Joe Biden, who is still in his residence and does not appear in public unnecessarily, setting the right example to Americans how to behave during the epidemic, recorded a video in which he harshly criticizes Donald Trump, his words about the epidemic, his inaction, inability to lead the country in difficult times and excessive desire to be re-elected for a second term, which prevails over the desire to fight the epidemic. In principle, we have said repeatedly that Biden doesn't even need to do anything now to convince Americans to vote for him in November. Trump himself "digs a hole", he does everything to avoid being re-elected. And by the way, it is very difficult to disagree with Biden. It doesn't matter whether you support the Democratic candidate or not, but it is Biden who exudes the qualities the country needs in these times. Biden does not ride around the country with election rallies, does not blame China for everything that is happening, does not insult his opponents, does not get into various scandalous stories, he can not be accused of trying to smear the current President. Oh, and you can't call him a racist or raise such suspicions about him, and he wears a mask, unlike the President. Trump also managed to cast a shadow on himself even in a racist scandal, when he first wanted to disperse all demonstrators and protesters with the help of the regular army, referring to the law of 1806, which was never applied and then retweeting a video with openly racist overtones to his page. By the way, the highest threat of coronavirus is understood by almost all economists and financiers in the United States. Representatives of the Federal Reserve have repeatedly stated that it is the pandemic that can hinder the recovery of the American economy in the future and affect the pace of this process. Also, Jerome Powell and other Fed representatives have repeatedly called on Congress to agree on a new package of economic assistance that will be sent to businesses and ordinary Americans suffering from the "coronavirus crisis". But instead of solving these important problems, we read in the news the skirmishes between Trump and Biden on the issue of opening schools in September (Donald accuses Joseph of refusing to open schools for political reasons and believes that this way the Democrats intend to get a greater political rating). On the last trading day of the week in the European Union and the United States, no important publications or speeches are planned. Thus, market participants will again have to pay attention only to the next speeches of Trump, criticism of him from his opponents, and other near-economic and near-political topics. Although the issue of "coronavirus" in the US remains in the first place, and the more cases of the disease are recorded in the United States, the higher the probability of a further fall in the dollar. Although, from a technical point of view, the euro/dollar pair continues to trade near the upper border of the side channel, in which it spent the last month, that is, near the Murray level of "5/8"-1.1353. Although yesterday the quotes went slightly above this level, there was no consolidation above it, so buyers are now also a little in doubt, unlike buyers of the pound, who are actively buying the British currency.
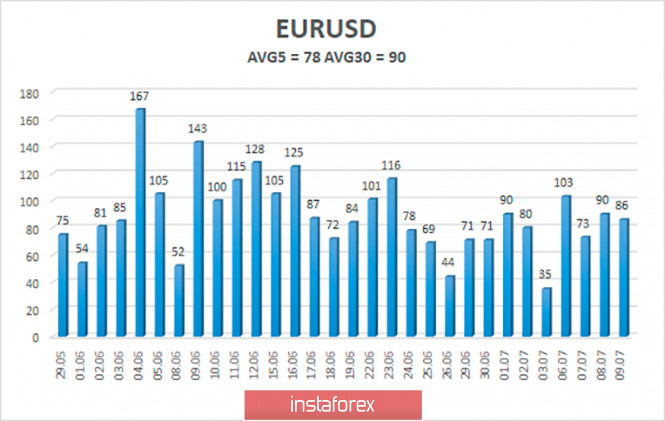
The volatility of the euro/dollar currency pair as of July 10 is 78 points and is characterized as "average". We expect the pair to move between 1.1215 and 1.1371 levels today. A new turn of the Heiken Ashi indicator upward will signal a new round of upward movement within the side channel. Nearest support levels: S1 – 1.1230 S2 – 1.1108 S3 – 1.0986 Nearest resistance levels: R1 – 1.1353 R2 – 1.1475 R3 – 1.1597 Trading recommendations: The EUR/USD pair continues to trade near the moving average line, inside a side channel with a slight upward slope. Thus, at this time, it is recommended to trade down if traders manage to overcome the level of 1.1200, which is the approximate lower limit of the channel, with the goal of 1.1108. It is recommended to open buy orders not earlier than overcoming the Murray level of "5/8"-1.1353 with the goal of 1.1475, and then very carefully. The material has been provided by InstaForex Company - www.instaforex.com |
| Evening review for EUR/USD on 07/09/2020 Posted: 09 Jul 2020 04:44 PM PDT
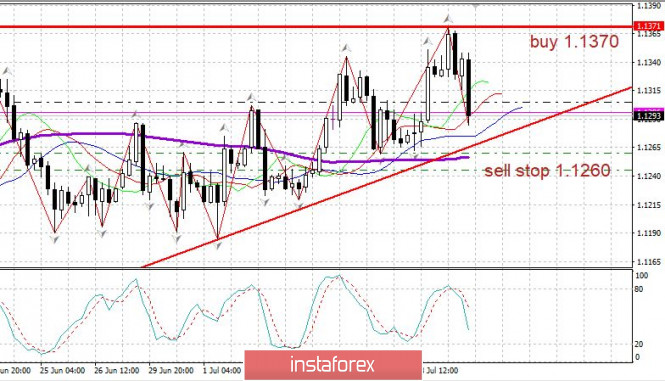
EUR/USD: The US employment report for the week came out. The number of initial applications declined from 1.5 dollars to 1.3 million dollars, while the number of long-term unemployed declined to 18 million. The data is strong, and this has affected the euro. As a result, seller's pressure has increased. A range has formed today. We are ready to buy from the level of 1.1370. We are ready to sell from the level of 1.126. So far, we hold purchases from 1.1245, stop and then flip down to the level of 1.1260. The material has been provided by InstaForex Company - www.instaforex.com |
| July 9, 2020 : EUR/USD Intraday technical analysis and trade recommendations. Posted: 09 Jul 2020 11:41 AM PDT
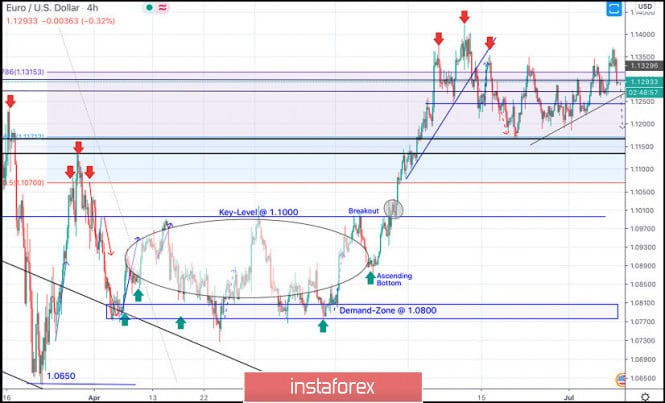
On March 20, the EURUSD pair has expressed remarkable bullish recovery around the newly-established bottom around 1.0650. Shortly after, a sideway consolidation range was established in the price range extending between 1.0770 - 1.1000. On May 14, evident signs of Bullish rejection as well as a recent ascending bottom have been manifested around the price zone of (1.0815 - 1.0775), which enhances the bullish side of the market in the short-term. Bullish breakout above 1.1000 has enhanced further bullish advancement towards 1.1175 (61.8% Fibonacci Level) then 1.1315 (78.6% Fibonacci Level) where bearish rejection was anticipated. Although the EUR/USD pair has temporarily expressed a bullish breakout above 1.1315 (78.6% Fibonacci Level), bearish rejection was being demonstrated in the period between June 10th- June 12th. This suggested a probable bearish reversal around the Recent Price Zone of (1.1270-1.1315) to be watched by Intraday traders. Despite the recent temporary bullish spike above 1.1350, Bearish persistence below 1.1250-1.1240 (Head & Shoulders Pattern neckline) is needed to confirm the pattern & to enhance further bearish decline towards 1.1150. On the other hand, another bearish breakdown below the depicted keyzone around 1.1150 is mandatory to ensure further bearish decline towards 1.1070 and 1.0990 if enough bearish pressure is maintained. Trade recommendations : The recent bullish movement towards the price zone around 1.1300-1.1330 (recently-established supply zone) should be followed by Intraday Traders as a valid SELL Signal.T/P levels to be located around 1.1175 then 1.1100 while S/L to be placed above 1.1375. The material has been provided by InstaForex Company - www.instaforex.com |
| July 9, 2020 : GBP/USD Intraday technical analysis and trade recommendations. Posted: 09 Jul 2020 11:32 AM PDT
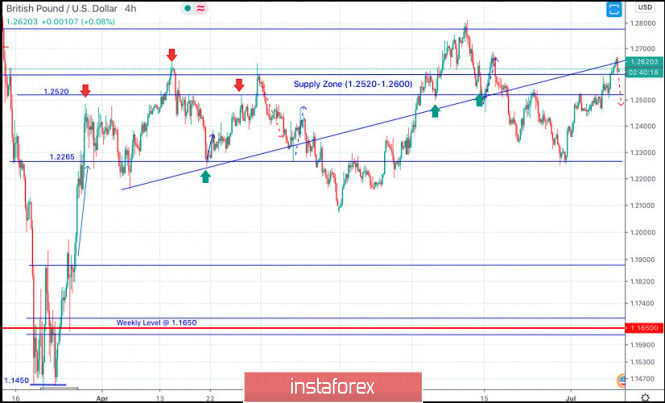
Intermediate-term Technical outlook for the GBP/USD pair remains bullish as long as bullish persistence is maintained above 1.1890-1.1900 (Double-Bottom Neckline) on the H4 Charts. Recently, Bullish breakout above 1.2265 has enhanced many bullish movements up to the price levels of 1.2520-1.2590 where temporary bearish rejection as well as a sideway consolidation range were established (In the period between March 27- May 12). Shortly after, transient bearish breakout below 1.2265 (Consolidation Range Lower Limit) was demonstrated in the period between May 13 - May 26. However, immediate bullish rebound has been expressed around the price level of 1.2080. This brought the GBPUSD back above the depicted price zone of 1.2520-1.2600 which failed to offer sufficient bearish rejection. Hence, short-term technical outlook has turned into bullish as well, further bullish advancement was expressed towards 1.2780 (Previous Key-Level) where signs of bearish rejection were expressed. Short-term bearish pullback was expressed, initial bearish destination was located around 1.2600 and 1.2520. Moreover, a bearish Head & Shoulders pattern (with potential bearish target around 1.2265) was recently demonstrated on the chart. That's why, bearish persistence below 1.2500 ( neckline of the reversal pattern ) paused the bullish outlook for sometime & enabled further bearish decline towards 1.1265. However, significant bullish rejection around 1.2265 brought the GBP/USD pair back towards 1.2600 - 1.2620 where a cluster of resistance levels are located. Signs of bearish rejection should be watched around the current price zone of 1.2550-1.2620 (recent supply zone) as it indicates a high probability of bearish reversal. Trade recommendations : Intraday traders can consider the current bullish pullback towards the depicted Supply Zone (1.2550-1.2620) for a valid SELL Entry. Stop Loss should be placed above 1.2650 while T/P level to be located around 1.2450 & 1.2265. The material has been provided by InstaForex Company - www.instaforex.com |
| Posted: 09 Jul 2020 10:33 AM PDT The euro-dollar pair updated the local high today, reaching 1.1371. The last time the price was at this level was almost a month ago - on June 11. The rapid increase in the number of COVID-19 cases in the US weakened the greenback, the price fell across the market. But buyers failed to keep their positions once again. A few hours after the beginning of the US session, EUR/USD bears took the initiative and returned the price to the area of the 12th figure. There was no price breakthrough: the pair stayed in the range of 1.1260-1.1350, within which it "walks" throughout the current week. There is a feeling that traders of the pair are experiencing a kind of crisis, when the incoming news flow is not able to reverse or continue the trend. Looking ahead, it is worth warning that despite the current downward momentum, short positions look risky - unless, of course, we are talking about scalping. In all other cases, do not rush to make trading decisions. The decline in the price of EUR/USD is emotional and is based on the comments of US Treasury Secretary Steven Mnuchin. He said that the next bill on measures to help the economy in the conditions of coronavirus is "at the final stage of its development." Mnuchin added that he "will do everything to ensure that the bill is approved by Congress before the end of July." He also said that he supports new direct payments to citizens, but he did not specify what level of income restriction the White House will support. In general, he made it clear that the administration will offer a more modest bill compared to a similar document that was previously passed in the House of Representatives. In particular, this applies to the payment of unemployment benefits. According to the secretary of the Treasury, "generous insurance keeps some people from returning to the workplace, since they earn more at home than at their work." Mnuchin also said that the options developed by the White House for providing financial assistance will be "more targeted". According to American journalists, almost every item of the announced program goes against the initiatives of representatives of the Democratic party. Let me remind you that in early June, the Democrats initiated the adoption of their financial assistance package. They were able to pass it in the House of Representatives, but at the same time became the object of criticism from the White House and Republicans. US President Donald Trump made it clear that the bill is too expensive, and therefore will not pass the millstone of the Senate and in any case will not be signed by him. Against the background of such events, it is unlikely that the legislative initiative of the White House will be received by Democrats with cordiality. It is also necessary to remember that the US presidential election is less than five months away, so all legislative initiatives are now considered through the prism of the election race. Thus, the fundamental background for the dollar is still negative. First of all, this is not the first time Mnuchin has voiced such promises – the last time he promised to present and introduce the above-mentioned bill to Congress was at the end of May. Second, the ongoing political differences between Democrats and Republicans will not allow the White House to automatically adopt a new stimulus package (it should be recalled here that the Democratic party controls the House of Representatives). And third – no one has canceled the coronavirus yet, so tomorrow's statistics could plunge dollar bulls into depression, especially if the daily increase in infected people exceeds the 60,000 mark again. Continuing the topic of coronavirus, it is necessary to say one more fundamental factor that supported the dollar today. The statement from the Director of the National Institute of Allergy and Infectious Diseases, Anthony Fauci. He said that a coronavirus vaccine could be created by the end of this year or the beginning of the next. The US currency reacted quite sharply to this phrase, strengthening its position throughout the market. But behind the headlines lies an important clarifying comment from Fauci – he said that the third phase of clinical trials "can probably begin" by the end of July. The fact is that at the moment, pharmacists in many countries of the world are developing more than ten versions of vaccines – but no company has yet passed the third stage of clinical trials. So far, only the Chinese have reached the last stage – this month they will start the final tests in the UAE. Therefore, it is premature to talk about the appearance of a vaccine - according to the most optimistic estimates, the drug will appear in six months or a year. In summary, it should be noted that despite the strong downward momentum (the EUR/USD pair lost almost 100 points in just a few hours), the bears could not even approach the support level of 1.1260 (the average line of the Bollinger Bands indicator coincides with the Tenkan-sen and Kijun-sen lines on the daily chart). All this suggests that dollar bulls are not confident in their abilities, and sellers rushed to close deals as soon as the pair began to slow down its downward course. Therefore, it is now advisable to take a wait-and-see position for the pair. Tomorrow, after the publication of new data on the rate of spread of COVID-19 in the US, the fundamental picture of EUR/USD may change dramatically. The material has been provided by InstaForex Company - www.instaforex.com |
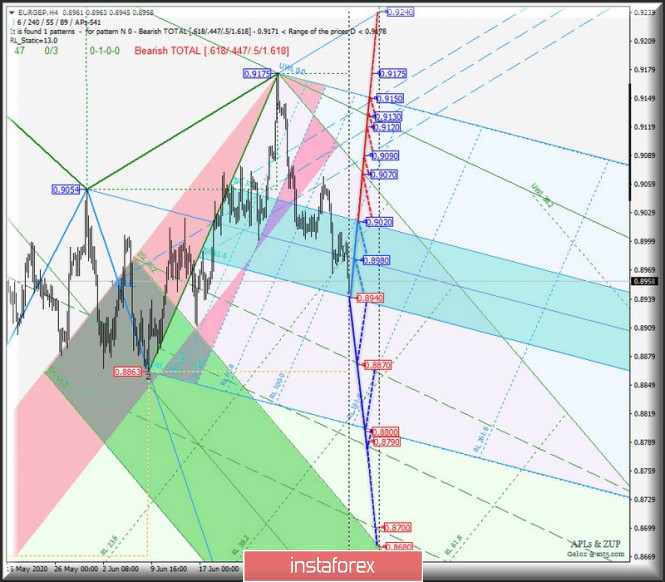
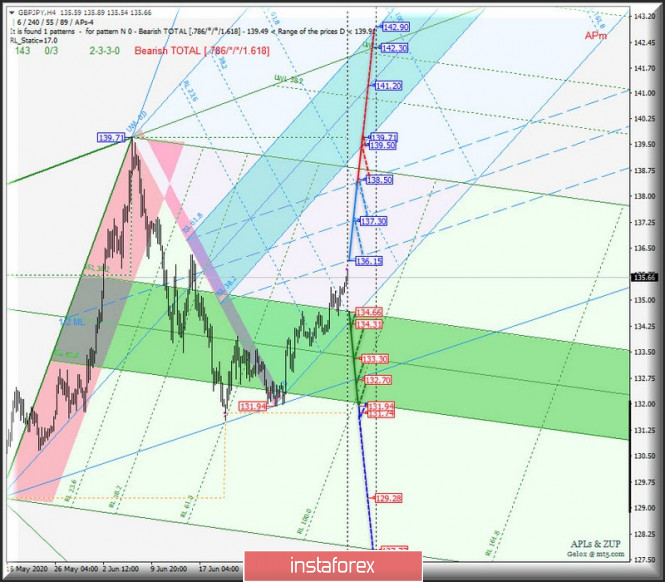
| Posted: 09 Jul 2020 10:18 AM PDT Minute operational scale (H4) How will the main currency instruments behave relative to each other from July 10, 2020 - options for the development of the movement of the currency pairs EUR/GBP & EUR/JPY & GBP/JPY in the H4 timeframe ____________________ Euro vs Great Britain pound From July 10, 2020, the development of the movement of the "main" EUR/GBP cross-instrument will be determined by the development and direction of the breakdown of the boundaries of the equilibrium zone (0.9020 - 0.8980 - 0.8940) of the Minuette operational scale fork - see the details of working out the specified levels on the animated chart. The breakdown of the support level at 0.8940 on the lower border ISL61.8 zone equilibrium of the Minuette operational scale fork will make the actual continuation of the downward movement of the "main" cross-tool to the borders of the channel 1/2 Median Line (0.8870 - 0.8790 - 0.8800) of the Minute operational scale fork. In case of breaking the resistance level of 0.9020 at the upper boundary ISL38.2 zone equilibrium of the Minuette operational scale fork will be possible development of upward movement of the EUR/GBP to the initial line SSL (0.9070) of the Minute operational scale fork and channel borders 1/2 Median Line Minuette (0.9090 - 0.9120 - 0.9150). The EUR/GBP movement options from July 10, 2020 are shown on the animated chart.
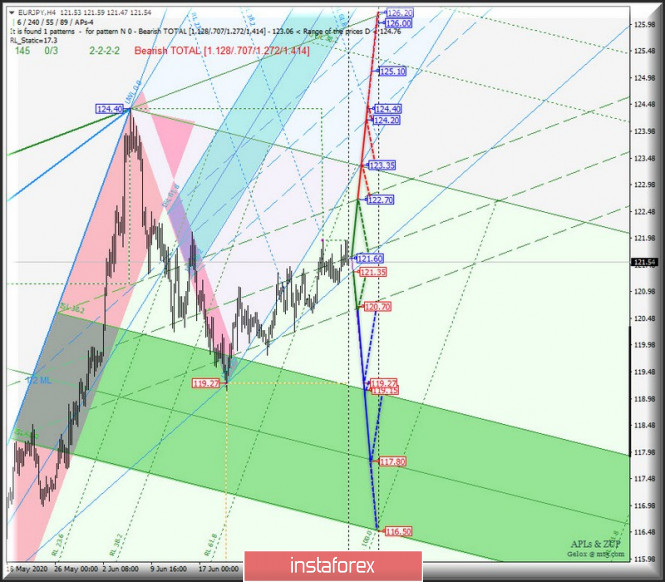
____________________ Euro vs Japanese yen The development of the EUR/JPY cross-instrument movement will continue in the 1/2 Median Line channel from July 10, 2020 (122.70 - 121.60 - 120.70) of the Minuette operational scale fork, taking into account the development and breakdown direction of the range:
If the support level 121.35 - on the line of control LTL of the Minuette operational scale fork will determine the continued movement of the cross tool to the lower border of the channel 1/2 Median Line Minute (120.70), local minimum 119.27 and the upper boundary ISL38.2 (119.15) equilibrium zone of the Minute operational scale fork. If the resistance level of 121.60 is broken at 1/2 Median Line Minute, the upward movement of EUR/JPY will be directed to the targets:
From July 10, 2020, we look at the EUR/JPY movement options on the animated chart.
____________________ Great Britain pound vs Japanese yen The development of the movement of the EUR/JPY cross-instrument in June 2020 will depend on the development and direction of the breakdown of the range:
The breakout of ISL61.8 Minute - the support level of 134.66 - together with the initial SSL line (134.31) of the Minuette operational scale fork will determine the development of the GBP/JPY movement in the equilibrium zone (134.66 - 133.30 - 131.94) of the Minute operational scale fork. In the breakdown of the resistance level 136.15, the movement of the cross tool will be continued in the channel 1/2 Median Line Minuette (136.15 - 137.30 - 138.50) with the prospect of reaching the lower border ISL38.2 (139.50) zone equilibrium of the Minuette operational scale fork with a possible upgrade of the maximum of 139.71. Details of the development of the GBP/JPY movement from July 10, 2020 are shown on the animated chart.
____________________ The review is compiled without taking into account the news background, the opening of trading sessions of the main financial centers and is not a guide to action (placing "sell" or "buy" orders). The material has been provided by InstaForex Company - www.instaforex.com |
| Posted: 09 Jul 2020 09:00 AM PDT
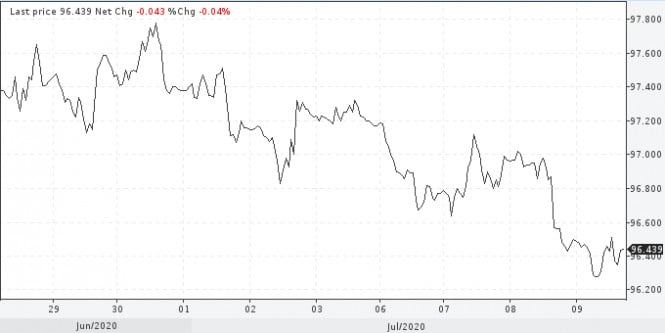
Contrary to hopes for growth, and despite the worsening epidemiological situation in the United States, the dollar index returned to the last month's minimum. Since early July, the indicator has lost 1.4% of its value. On Thursday, it tested the lower limit of the range at 96.34. USDX
The pressure on the greenback is partly due to a moderate recovery in demand for risky assets. In many developed countries, there is an improvement in business and consumer activity, which increases the attractiveness of the financial assets of these countries. Even at the dawn of the coronavirus crisis, when the dollar was testing levels above 100 points, experts said that the decrease would mean the peak of the crisis. Perhaps this is happening now. Meanwhile, the US financial authorities are increasingly doubting the steady recovery of the country's economy. Market players perceive the Fed's pessimism as a signal to further increase the asset buyback program. Such a policy further undermines the precarious position of the dollar. Moreover, it is also worth paying attention to another important fact. The situation in the economy turned upside down. If earlier the US economy developed much faster than the Eurozone and accelerated in contrast to the slowdown in China, now it is the other way around. US economic dominance supported the dollar and allowed the Federal Reserve to raise interest rates, while other countries of such luxury could not afford to do the same. This trend may linger for a long time, and the dollar will have to return to the positions won over the past six years. Some strategists have also begun talking about the potential for a 20% depreciation over the next few years. Everything is fine, but once again the coronavirus can destroy all predictions and illusions about this. The United States recorded another record daily increase in the number of infected. This does not worry the markets much, but the situation is borderline. An outbreak can occur at any time, increasing demand for the US dollar. Meanwhile, the negative factors for the greenback so far outweigh. Among them is the possible victory of Joseph Biden in the presidential election in November. Opponent Donald Trump has stepped forward due to the incumbent president's inability to cope with a double crisis - a pandemic and protests against racism. Undoubtedly, the upcoming elections will have a huge impact on the greenback and global markets. This event will be more reflected in the next quarter. However, given that the situation in connection with the anticipated changes is starting to heat up now, the current quarter can also hook this event, pushing the greenback down. Biden's presidency could result in higher taxes, lower minimum wages, tougher climate policies and other measures that would hit corporate profits and the attractiveness of local assets. The new team will want to increase spending on health care, infrastructure, and other areas that contribute to inflation. This is all later, and now everyone is interested in exactly when the dollar devaluation will occur. The US dollar will sooner or later turn down due to the increasing pressure which is expected to be felt in the third quarter. The world is buried in dollar debt. This applies to both America and other countries of the world. Sustainable recovery requires a dollar devaluation. The material has been provided by InstaForex Company - www.instaforex.com |
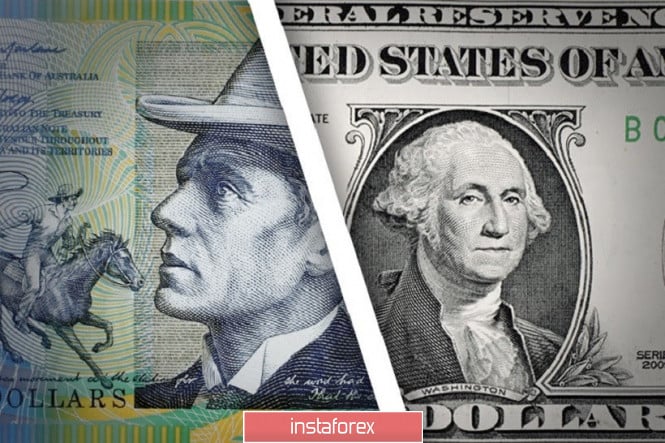
| AUD/USD. Weak greenback not a reason to open long positions Posted: 09 Jul 2020 07:45 AM PDT Despite the general weakness of the US currency, the AUD/USD pair behaves rather modestly, demonstrating low volatility. The aussie tried to approach the key resistance level of 0.7000 during the Asian session on Thursday – but did not even test the specified price area. The Australian dollar has lost its previous heat and has been besieging an unassailable resistance level for several weeks. It is noteworthy that even a significant decline in the dollar index did not help AUD/USD buyers develop an upward offensive: sellers take the initiative as soon as the price approaches the target of 0.7000, exerting general pressure on the pair. This state of affairs allows you to implement a simple trading strategy. In fact, this strategy seems to be followed by many market participants: they sell the pair as soon as it approaches the mentioned resistance level. The 0.7000 level is a "hard nut". It served as a reliable support level for many months: in the first half of 2019, the bears permanently tried to go below this target for several months, but they came back each time. The situation acquired a mirror character in the second half of 2019 – the 0.7000 mark became a kind of price outpost, acting as a resistance level. Bulls tried to storm the 70th figure more than ten times, but the price still fell under the round mark in the end. In other words, this target has a special symbolic meaning for the aussie. Given this background, it is not surprising that most traders open short positions from the level of 0.7000 – because a powerful information driver is needed to overcome it, while many fundamental factors are now playing against the Australian currency. Let me remind you that the current weakness of the US dollar is due to the coronavirus factor. An anti-record was reported in the United States: the daily incidence rate reached 61,000. The market started talking about another lockdown, the growth of unemployment and the aggravation of the economic crisis. But the trendy factor put pressure on the aussie. The fact is that in Australia, and to be more precise, in the state of Victoria, an outbreak of COVID-19 was also reported. For this reason, Melbourne, which is the second largest Australian city, has again strengthened the quarantine. Now residents of the five-million-city metropolis will have to stay at home for six weeks. The authorities have also closed the country from internal migration: police and troops are stationed at border crossings, patrolling vast borders with the help of drones. Such news does not contribute to the growth of the national currency. The Australian economy has just begun to show signs of recovery, so any mention of coronavirus outbreaks in the country will put pressure on the aussie. Also, don't forget about the long-running political conflict between China and Australia. This conflict between Canberra and Beijing has not faded, but is still developing in a spiral. If at first China imposed relatively minor economic sanctions (in particular, the Chinese increased duties on certain types of Australian goods, while refusing to import beef), then the conflict manifested itself in other areas – for example, representatives of China called on Chinese students not to return to Australian universities "because of racist incidents". A little later, the Chinese security services accused the Australians of spying, and the Australian authorities hinted at the involvement of the Chinese in cyber espionage. Now Hong Kong has been added to this. Looking ahead, it is worth noting that the Hong Kong issue is a painful one for Beijing. The Chinese authorities consider Hong Kong their full-fledged territory, where the formula "one country – two political systems" operates. Therefore, any comments of foreign politicians on the Hong Kong issue are perceived by the Chinese "with hostility", claiming interference in the internal affairs of the state. However, Australian Prime Minister Scott Morrison just announced the suspension of the extradition treaty with Hong Kong after the decision of the Chinese authorities to adopt a new law "on ensuring national security" on the territory of this semi-autonomous city. According to him, the Australian authorities do not rule out a "broad interpretation" of the mentioned law, hinting at possible reprisals against the opposition. In addition, the head of the Australian government spoke about other measures to support Hong Kongers in the current situation. In particular, those who are currently in Australia on a work or study visa will be able to extend it for up to five years with the possibility of further obtaining a residence permit. This position will only worsen the political conflict between Australia and China. At the same time, the resolution of the Australian-Chinese conflict is a prerequisite for the further development of the upward trend. As an alternative, we can assume further weakening of the greenback, but even in this case, the growth of AUD/USD will be unreliable, especially above the 0.7000 mark. Any signals of an escalation of the political conflict will return the aussie to the 69th figure. Thus, you are advised to consider short positions when the pair approaches the resistance level of 0.7000. The support level is 0.6920 - this is the average line of the Bollinger Bands, which coincides with the Tenkan-sen and Kijun-sen lines on the daily chart. The material has been provided by InstaForex Company - www.instaforex.com |
| Oil slowed down before the next batch of statistic report Posted: 09 Jul 2020 06:45 AM PDT
No further changes were noted in the price of crude oil on Thursday. This is after a notable rise on Wednesday updating maximum values recorded in March this year. At the same time, both oil brands excelled in stability and growth. All this happens on the eve of the next batch of statistics on the level of raw material reserves in the United States of America. The stocks of crude oil on July 3 were 5.654 million barrels higher as noted in the official report of the Ministry of Energy. At the same time, fuel inventories decreased by 4.839 million barrels. The reserves of distillates increased by 3.136 million barrels. While the strategically important terminal in Cushing also recorded growth of 2.206 million barrels. Real data did not coincide with preliminary forecasts of experts who were preparing for the fact that the volume of raw materials decently reduced to a supposed 3.7 million barrels. The gasoline and distillates are also expected to dip by 1.2 million barrels and 500 thousand barrels, respectively. The main reason for the increase in oil reserves in America was the rapid growth of imported raw materials. However, this fact reflects the positive changes that relate to an increase in demand for raw materials and fuel within the state, which then will affect the overall final statistics. According to the latest data provided by the US government, oil production in the country should increase by 200 thousand barrels as early as next year. In June of this year, this figure was at around 11 million barrels per day. This year, production will remain at 11.6 million barrels per day. The price of crude oil cannot escape the negative associated with the tense epidemiological situation in the world. The price would have rushed up and began to increase rapidly, but the news about the increase in the number of COVID-19 cases in the world and in the US forces it to slow down or even stop its movement. Recall that after the systematic removal of quarantine measures began on the territory of the southern states of America, new outbreaks of the disease began to be recorded, which already now testify to the more rapid spread of COVID-19 than it was in the spring. As soon as the country began to come out of the crisis, how should it return to restrictive measures again? On Tuesday alone, 60,000 new COVID cases were recorded. This has been an anti-record since the start of the pandemic. The price of futures contracts for Brent crude oil for delivery in September on a trading floor in London fell slightly by 0.02% or $ 0.01. These changes remained almost invisible, and the price consolidated in the region of $43.28 per barrel. Wednesday's trading closed quite positive with an increase of 0.5% or $0.21. The price of futures contracts for WTI light crude oil for delivery in August on an electronic trading platform in New York also slightly decreased by 0.2% or $0.08, which sent it to the level of $40.82 per barrel. On Wednesday, it reflected an increase of 0.7% or $0.28. It is clear that Brent crude oil managed to get to its maximum marks recorded in the early spring of this year which was in the range of $43.23 per barrel. A good rise was provided by news on stocks in the United States. Until now, market participants have been able to not pay much attention to the spread of coronavirus infection, even despite the fact that extremely disappointing news and forecasts appeared. However, it seems that investors will still have to react to the growth of COVID-19, but whether the price of raw materials can start a negative trend from this is a big question. Buyers' appetites in the market have grown too much, and it will be difficult to immediately stop this rally. Nevertheless, some inhibition is not excluded, as it happened today. But a serious fall can be discussed no earlier than the moment when the price of black gold reaches the next strategically important mark of $ 45 per barrel. The material has been provided by InstaForex Company - www.instaforex.com |
| Positive outlook on EU, Asia, and US stock exchanges remain amid growing tensions Posted: 09 Jul 2020 06:44 AM PDT
The recovery in the Asia-Pacific stock markets today is due to the rise in the US stock markets. But it is not possible to single out any individual factors contributing to growth. the markets as a whole are set to positive regardless of the external situation. The US continues to record a new and growing number of COVID-19 patients every day. So far, the latest records showed an increase of 15 cases, which all came from different states. The country's authorities decided to introduce a new portion of quarantine measures, which should stop the spread of the virus to the extent that was observed in the first wave. Meanwhile, the inflation rate in China for the first month of summer began to grow due to higher prices for a number of food products. The cost of products, in particular, has become higher due to supply disruptions amid the COVID-19 pandemic. The level of consumer prices in June also jumped immediately by 2.5% on a yearly basis. However, this did not become a catastrophic rise, since a month earlier this indicator also increased in the same range by 2.4%. This has become one of the lowest climbs recorded in more than a year. Analysts' preliminary forecasts were also worse with an expected increase of at least 2.6%. In June, producer prices went down by 3% on a yearly basis. China's Shanghai Composite Index climbed 1.33% in the morning. Hong Kong's Hang Seng Index, on the other hand, underwent a negative correction and fell 0.03%. Japan's Nikkei 225 Index slightly increased by 0.4%. Good statistics are noted in the equipment orders sector. The total volume of contracts became 16.3% less over the year, and the previous decrease was 17.7%. On a monthly basis, the indicator grew by 1.7%, while in the middle of spring a tremendous reduction of 17% was noted. Analysts' preliminary expectations also turned out to be much worse than real numbers: the first and second indicators were expected to decrease by 17.1% and 5.4%, respectively. The South Korean Kospi index changed in a positive direction noting an increase of 0.56%. Australia's S & P / ASX 200 Index rose 0.59% to its previous level. The US stock markets are also experiencing their best moments. Yesterday, an increase was recorded in all major areas. Nasdaq index takes the lead in the growth which again managed to accomplish the impossible and reach a record high against the backdrop of positive dynamics in the technology sector. The increase in the economy leveled out data on a significant increase in the number of COVID-19 cases in the country and the world as a whole. According to the latest data, the incidence threshold of 3 million people has been crossed in the United States of America. At the same time, an increasing number of states announce new anti-records. In Florida, authorities are already faced with the problem of a shortage of hospital beds. Despite this, stock markets continue to pretend that this situation does not concern them. Even the fact that market participants are currently experiencing serious stress does not mean at all that it is worth waiting for a collapse in the near future. Investors are inclined to take risks, although part of the assets is still transferred to a safe zone, as evidenced by the growth in ETFs. The Dow Jones index rose 0.68%, which allowed it to move to the mark of 26,067.28 points. The S&P 500 index jumped 0.78% to reach 3,169.94 points. The Nasdaq index showed a record increase of 1.44%, and its current level was in the range of 10,492.50 points. The European stock markets are also set for growth, which was observed almost everywhere. The positive dynamics were due to an increase in the quarterly profit of some of the largest enterprises operating in the software sector. This made investors hope for accelerated economic growth. The UK FTSE index slightly increased by 0.1%. The German DAX index rose more rapidly by 1.3%. The French CAC 40 index also showed growth by 0.4%. A meeting of finance ministers of the eurozone states is expected to take place. And the next summit of the European Union countries is scheduled for July 17-18. It is on it that the most important and exciting question of all members of the organization will be raised - the budget for several years. The organization of a fund to support and restore the economy of the region will also be discussed. Recall that earlier the total size of the fund was provided in the range of 750 billion euros, or 851 billion dollars, but it was not possible to reach a consensus. Meanwhile, the extreme need for the existence of such a fund begins to be felt more and more as the economy develops and out of the crisis associated with the coronavirus pandemic. Nevertheless, some experts believe that the European region has already quite successfully overcome difficulties. In support of this, data are provided on the level of GDP, which were revised downward from the initial critical level. Thus, a decrease in the indicator is expected to be within 8.7%, whereas a more significant drop was previously forecasted. The material has been provided by InstaForex Company - www.instaforex.com |
| Chinese yuan continues to grow rapidly Posted: 09 Jul 2020 06:44 AM PDT
The Chinese yuan continued to climb to the upper borders on Thursday due to a good strengthening of the main stock indexes and growth in the securities sector. The positive noted on the stock exchanges of the PRC was transmitted to the foreign exchange market. The China CSI 300 index was able to significantly rise. The overall rise this week already amounted to 9%, which allowed it to reach maximum levels and even set another record after several years. Amid such positive news, the Chinese yuan also aims to strengthen. It was even able to overcome the level of 7 yuan per dollar, which was last stormed in March this year. Moreover, the USDCNY currency pair now checks the high value for strength, which was recorded almost two years ago. Experts are not too surprised by the dynamics of the renminbi, as they previously noted that the state coped with the next wave of coronavirus infection that overtook the world this summer. The Chinese economy is gradually emerging from the crisis, which the country's authorities are in a hurry to share with the world. Literally, a shopping boom has occurred in the Chinese securities market. Investors were swiftly buying stocks, followed by inevitable growth. Thus, net purchases of securities in the first seven days of the current month turned out to be at the level of $ 7.85 billion, and this amount became more than for the entire previous month. China's bonds are also popular among foreign investors. Such rapid positive dynamics can ultimately have a positive effect on the level of state GDP for the second quarter of this year. However, not all analysts are sure of this. There are also those who reacted rather restrainedly to the current situation while pointing out that it is worth waiting for the official statistics, which will be released next week. Other experts established themselves in their position which in China is nothing more than a V-shaped economic recovery, which the United States of America dreams of. Nevertheless, it is not yet clear how significant and firm it will become. The unresolved conflict between America and China over Hong Kong adds fuel to the fire. Recently, there has been a surge of tension on this issue, which makes us think about a new round of disagreements. There are more radical views on increasing interest in Chinese markets. Some argue that all this was created artificially due to the hype that the state media raised. Recently, they have been very active in promoting the purchase of shares as a way to preserve and increase their assets. However, history has already had a similar experience, when everything ended rather sadly. In the end, the US currency may lose support from the PRC. At least a separate part of the forecasts indicates a decrease in the dollar against the Chinese yuan to 6.95 yuan per dollar. However, some forecasts state that in the third and fourth quarters of the current year the currency pair will concentrate in the region of 7.18 yuan per dollar and 7.20 yuan per dollar, respectively. The material has been provided by InstaForex Company - www.instaforex.com |
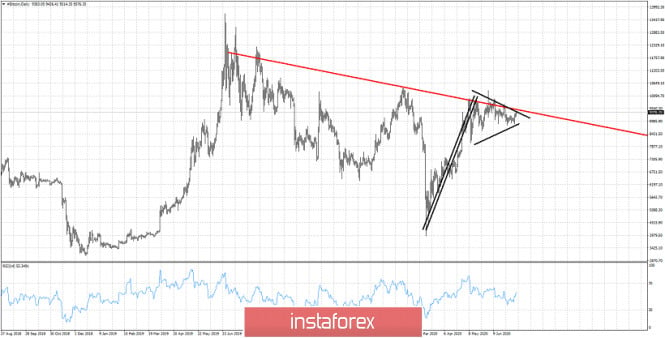
| Bitcoin form a bullish technical pattern Posted: 09 Jul 2020 06:12 AM PDT Bitcoin is challenging the resistance at $,9500 area. This is important resistance for two reasons. First is the downward sloping resistance trend line from June 2019 highs. Secondly is the upper boundary of a technical pattern.
Black lines- bullish pennant Bitcoin has formed a bullish pennant pattern. An upward break out will be combined with the break above the red resistance trend line and it would be a very bullish signal. Bulls need to recapture the $9,500-$10,000 level in order to hope for a move towards $13,500-$15,000. Support is found at $9,000. A break below this level would be a bearish sign. The material has been provided by InstaForex Company - www.instaforex.com |
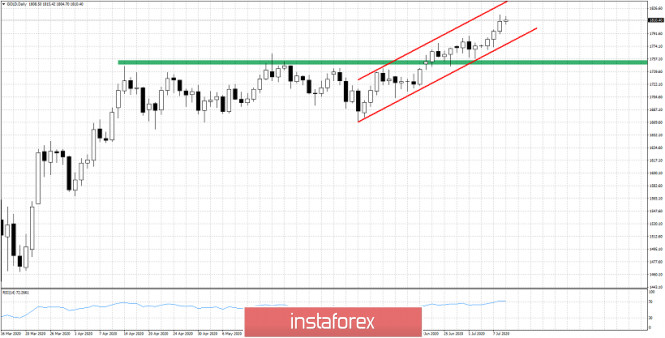
| Posted: 09 Jul 2020 06:08 AM PDT Gold price is very close to the 2020 higher highs that made yesterday. Trend remains bullish. Price is in a medium-term bullish trend and as long as price is above $1,750-60 level bulls have nothing to fear.
Red lines - bullish channel Green rectangle- support zone Gold price is approaching the upper channel boundary. This resistance is at $1,833. Our upside targets have been reached. Bulls need to be cautious as it is justified to see a pull back towards $1,760. Longer-term trend remains bullish as long as price is above $1,660. A pull back towards $1,785 area is highly likely. But be careful, trend is bullish and we consider such a pull back as an opportunity to buy not to go short. The material has been provided by InstaForex Company - www.instaforex.com |
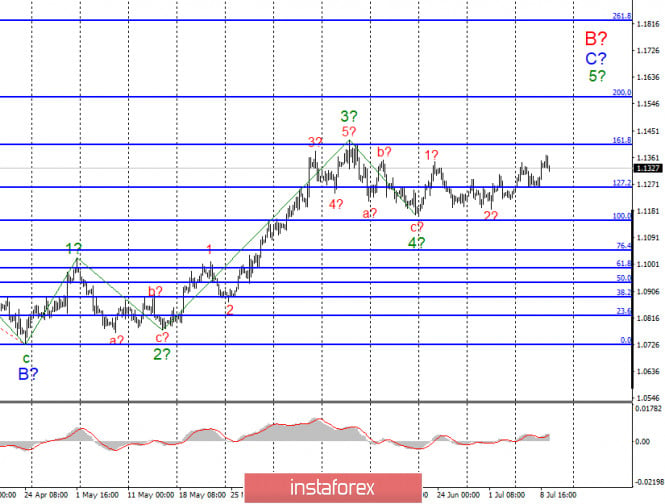
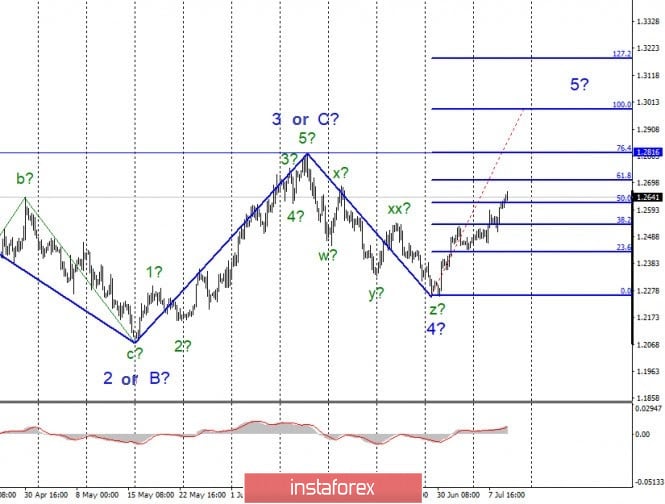
| Analysis of EUR/USD and GBP/USD on July 9. Boring end of the trading week. Posted: 09 Jul 2020 06:00 AM PDT EUR/USD On July 8, the EUR/USD pair gained about 55 basis points and thus continued to build the expected wave 5, C, or B. I expect a continued improvement of the instrument's quotes in terms of the building of this wave, after which the prolonged decline in quotes in the framework of the proposed global wave C. However, there are no signs of the completion of the construction of wave 5, C, or B. Wave 5 can also form inside this wave. Fundamental component: There have been no economic reports in recent days at all. However, there was a lot of news concerning the political and economic spheres of the European Union and the United States. Today, the meeting of EU Finance Ministers started, where they will choose the new President of the Eurogroup. However, the markets are not interested in this information. They are more interested if there will be a discussion of a 750-billion package of assistance to the European economy, which the Northern countries of the European Union do not want to approve. Judging by the announcements of the meeting, there will be no discussion on this issue. Thus, it is unlikely that the markets will receive the information that they are waiting for. It was also reported that the Bundesbank and the ECB have found a common language. The German Central Bank will not leave the jurisdiction of the European Bank and will not go against its will. However, this information will not affect the movement of the instrument in any way. What's important is the coronavirus epidemic in the United States. Yesterday we passed the threshold of 60 thousand cases per day. Donald Trump continues to distribute completely inappropriate comments and jokes on this topic in the style of "we need to reduce the number of tests to reduce the incidence of disease". At the same time, the main competitor of Trump in the race for the US President-2020, Joe Biden, said that 3 million cases of coronavirus in the US – "the merit" exclusively of Donald Trump, and called him "a commander-in-chief who is not able to command anything". The more the epidemic spreads, the more likely it is that the American economy will shrink again. Or recover at a slower pace. Accordingly, investors are worried about the future of the United States, especially on the eve of the presidential election, which is unknown how it will end. Now the position of Joe Biden looks stronger, this is confirmed by social studies, however, everything may still change by November. General conclusions and recommendations: The euro/dollar pair presumably continues to build an upward wave C or B. Thus, I recommend buying a tool with targets located near the calculated levels of 1.1406 and 1.1570, which is equal to 161.8% and 200.0% for Fibonacci for each "up" signal of the MACD in the calculation of building wave 5, C, or B. GBP/USD The GBP/USD pair gained about 65 basis points on July 8. Thus, the construction of the assumed wave 5 continues. If this is true, then the increase in quotes will continue with targets located near the maximum of wave 3 or C or slightly higher. After completing the construction of this wave, it is also expected to build a new downward section of the trend, which can also turn out to be very long. Fundamental component: There were no noteworthy economic reports in the UK on Wednesday. There won't be any on Thursday or Friday. All the attention of the markets is still focused on the negotiations between London and Brussels on Brexit, which still do not end in anything positive. The British pound continues to rise due to the unhealthy political, economic, and epidemiological situation in America. General conclusions and recommendations: The pound/dollar tool has greatly complicated the current wave markup, which now involves building a new upward wave. Therefore, I recommend that you buy an instrument with targets around 1.2816 and 1.2990, which equates to the peak of wave 3 or C and 100.0% Fibonacci. The material has been provided by InstaForex Company - www.instaforex.com |
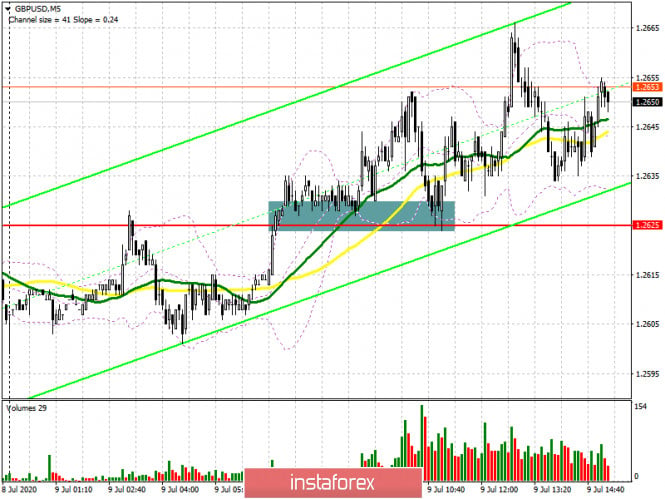
| GBP/USD: plan for the American session on July 9 Posted: 09 Jul 2020 05:37 AM PDT To open long positions on GBPUSD, you need: The British pound continues to strengthen its position after yesterday's aid plan proposed by the UK government. The bulls successfully consolidated above the resistance of 1.2625, forming a good buy signal there. If you look at the 5-minute chart, you will see that after the breakout and consolidation above the level of 1.2625, buyers formed a good base for the continued growth of the pound. But even if you did not manage to enter the first wave, you could easily do so after a second decline and a test on the volume of the level of 1.2625. As long as trading is conducted above this range, the bullish momentum will continue, and the nearest target will be a maximum of 1.2676. Only a break of this level will provide the market with fresh players betting on the strengthening of GBP/USD in the area of highs of 1.2754 and 1.2803, where I recommend fixing the profits. In the scenario of a pound decline and a return to the level of 1.2625, it is best to postpone the new long positions until the support update 1.2572, where the moving averages are held or buy GBP/USD immediately to the rebound from the minimum 1.2526, slightly above which the lower border of the ascending channel is located.
To open short positions on GBPUSD, you need: Sellers have one task – to return the pound to the support level of 1.2625. Until this happens, there is no point in talking about any correction at all. Only fixing below this range will form a good bearish signal that can return the pair to the minimum of 1.2572. The longer-term goal is the area of 1.2526, where I recommend fixing the profits, since this level will be noticeable actions of large buyers. Also, a good signal to open short positions in GBP/USD will be the formation of a false breakout in the resistance area of 1.2676. If there is no activity on the part of sellers at this level, it is best to postpone sales until the update of the maximum of 1.2754, where you can open short positions immediately on the rebound in the expectation of a correction of 30-40 points within the day.
Signals of indicators: Moving averages Trading is above the 30 and 50 daily averages, which indicates that the pound will continue to grow in the short term. Note: The period and prices of moving averages are considered by the author on the hourly chart H1 and differ from the general definition of the classic daily moving averages on the daily chart D1. Bollinger Bands Breaking the upper limit in the area of 1.2660 will lead to a new wave of growth of the pound. If the pair falls, the lower border of the indicator around 1.2600 will provide support. Description of indicators
|
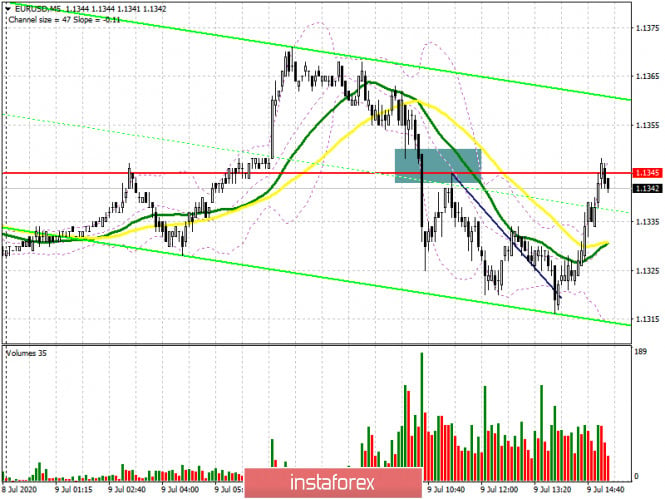
| EUR/USD: plan for the American session on July 9 Posted: 09 Jul 2020 05:35 AM PDT To open long positions on EURUSD, you need: The lack of fundamental statistics in the first half of the day did not allow euro buyers to hold above the rather important level of 1.1345, which served as a support in the first half of the day. On the 5-minute chart, you can clearly see how the bears broke below this range at the first attempt, and the entry point was a repeated test of this level from the bottom up, which brought about 20-25 points of intraday profit, which is half of the total volatility of the day. This is the scenario I drew attention to in my morning forecast. At the moment, traders will focus on data on the US labor market, however, it is worth paying attention to the change in the technical picture of the pair. On the hourly chart, a new resistance of 1.1360 is formed, a breakout and consolidation above which will be the key task of euro buyers for the second half of the day. Only then can you open new long positions in the expectation of continuing the upward trend to the highs of 1.1395 and 1.1430, where I recommend fixing the profits. If the bears push the pair back to the support area of 1.1319, I recommend returning from there to long positions only after forming a false breakout. Larger buyers will wait for the update of the area of 1.1267, where the lower border of the current ascending channel formed on July 1 of this year just passes.
To open short positions on EURUSD, you need: Sellers need to protect the resistance of 1.1360, which the pair is currently aiming for. Weekly data on the US labor market is unlikely to lead to drastic changes in the market, so the formation of a false breakout at the level of 1.1360 will be a signal to open short positions in the expectation of a repeated decline to the support of 1.1319. Only fixing below this range will increase the pressure on EUR/USD, which will lead to a larger sale in the area of the low of 1.1267, where the lower border of the current ascending channel passes. If there is no activity from the bears at the level of 1.1360, it is best not to rush with sales, but wait for the update of the maximum in the area of 1.1395, from where you can open short positions immediately for a rebound in the expectation of a correction of 20-25 points within the day.
Signals of indicators: Moving averages Trading is conducted just above the 30 and 50 daily moving averages, which now perform a certain role of support. Note: The period and prices of moving averages are considered by the author on the hourly chart H1 and differ from the general definition of the classic daily moving averages on the daily chart D1. Bollinger Bands Breaking the lower border of the indicator in the area of 1.1319 will increase pressure on the euro. Growth above the upper limit in the area of 1.1360 will lead to bullish momentum. Description of indicators
|
| America struggles to survive amid pandemic Posted: 09 Jul 2020 05:15 AM PDT
The number of new coronavirus cases in the US is growing every day and has reached the highest levels. On Wednesday, the US reported more than 60,000 new COVID-19 infections. For the second day in a row, the number of deaths has climbed by more than 900 in a day. US states such as Texas and Florida became the epicenter of the outbreak. In New Jersey, all residents were required to wear masks. At the same time, New York unveiled an educational plan for students in public schools. So, students will attend school two or three days a week. According to recent data, the number of new COVID-19 cases has increased in 42 out of 50 states. The continued growth of infected people in America may lead to the reintroduction of quarantine. The US economy is at stake. Experts believe that the US economy will start to revive no earlier than in 2021. The United States is the country with the largest number of coronavirus cases in the world. The total number of infected people there exceeds 3 million while 132,000 people died. The material has been provided by InstaForex Company - www.instaforex.com |
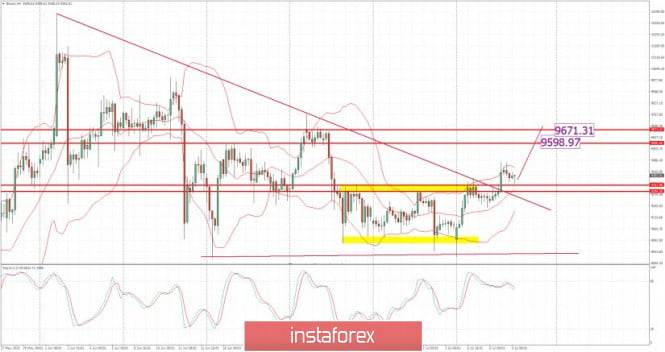
| Posted: 09 Jul 2020 04:57 AM PDT Technical analysis:
BTChas been trading upwards at the price of $9,390. I see further upward movement due to the breakout of the trading range in the background. Trading recommendation: Watch for potential buying opportunities on the dips. The upward targets are set at the price of $9,600 and $9,670 The material has been provided by InstaForex Company - www.instaforex.com |
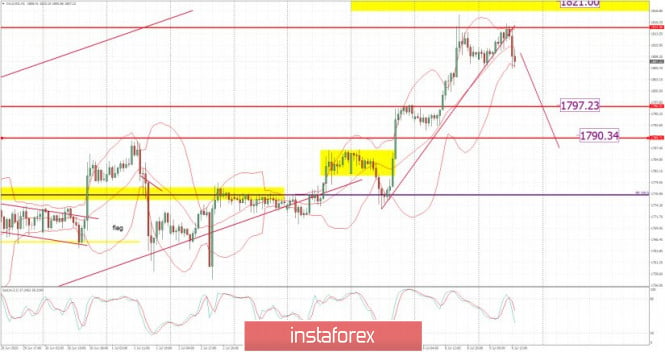
| Posted: 09 Jul 2020 04:51 AM PDT Technical analysis:
Gold has been trading upwards as I expected. The Gold reached our main objective at $1,820. Anyway, I found that there is the breakout of the rising trend line, which is sign for the potential downside movement. Trading recommendation: Watch for potential selling opportunities with the downward targets at $1,797 and $1,790 Main resistance is set at $1,815-$1,820 Stochastic oscillator is in overbought zone, which is another confirmation for the further downside movement.... The material has been provided by InstaForex Company - www.instaforex.com |


| You are subscribed to email updates from Forex analysis review. To stop receiving these emails, you may unsubscribe now. | Email delivery powered by Google |
| Google, 1600 Amphitheatre Parkway, Mountain View, CA 94043, United States | |
No comments:
Post a Comment