
Forex analysis review |
- AUDUSD bounced off support, potential for further upside!
- AUDUSD looking for short term push up above trendline!
- Hot forecast and trading signals for the GBP/USD pair on August 11. COT report. Traders ignore more rumors about Brexit.
- Hot forecast and trading signals for the EUR/USD pair on August 11. COT report. We begin to observe a new political scandal
- USDCAD reversing from 1st resistance, further drop!
- Overview of the GBP/USD pair. August 11. American media: The United States is on the verge of a constitutional crisis. Instead
- Overview of the EUR/USD pair. August 11. Trump makes a political "horse move". Will there be a result? Democrats may soon
- EUR/USD. Mnuchin rushes to the rescue: US Treasury Secretary kept the dollar afloat
- Analysis and trading signals for beginners. How to trade the EUR/USD pair on August 11? Analysis of Monday. Preparation for
- GBP/USD: pound strength in dollar's weakness
- August 10, 2020 : EUR/USD daily technical review and trade recommendations.
- August 10, 2020 : EUR/USD Intraday technical analysis and trade recommendations.
- August 10, 2020 : GBP/USD Intraday technical analysis and trade recommendations.
- US dollar rises slowly retrieves lost ground
- Comprehensive analysis of movement options for the commodity currencies AUD/USD & USD/CAD & NZD/USD (H4) on August
- AUDUSD vulnerable to a pull back towards 0.6920.
- Ichimoku cloud indicator analysis of USDJPY
- Ichimoku cloud indicator analysis of Gold
- Ichimoku cloud indicator analysis of EURUSD
- Dollar index remains in bearish trend but could continue bounce higher.
- Bearish short-term setup in USDCAD
- Brent and WTI diverged on opposite sides: oil prices fluctuate
- Asian stocks traded positively, while European and US stocks showed irresolute dynamics
- GBP / USD. Brexit delay may suggest potential growth for the pound
- Gold and silver: how long precious metals may grow?
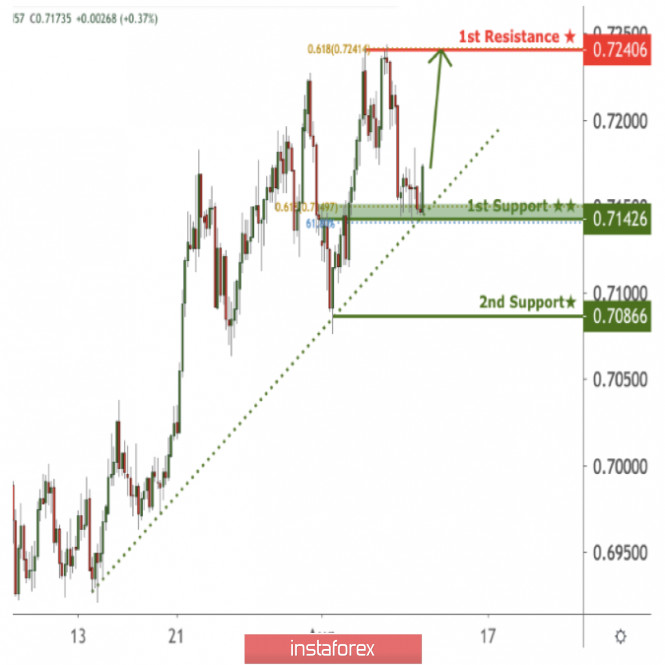
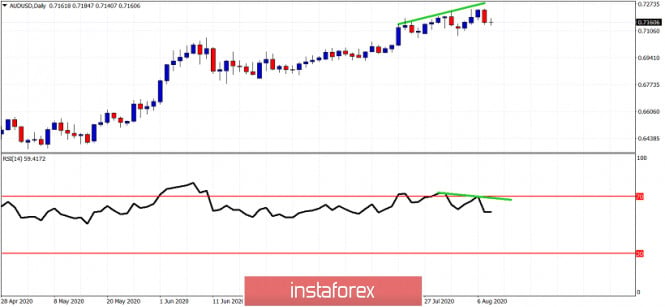
| AUDUSD bounced off support, potential for further upside! Posted: 10 Aug 2020 07:32 PM PDT
Trading Recommendation Entry: 0.71426 Reason for Entry: Ascending trend line, horizontal overlap support, 61.8% fibonacci retracement, 61.8% fibonacci extension Take Profit: 0.72406 Reason for Take Profit: Horizontal swing high resistance, 61.8% fibonacci extension Stop Loss: 0.70866 Reason for Stop Loss: Horizontal swing low support The material has been provided by InstaForex Company - www.instaforex.com |
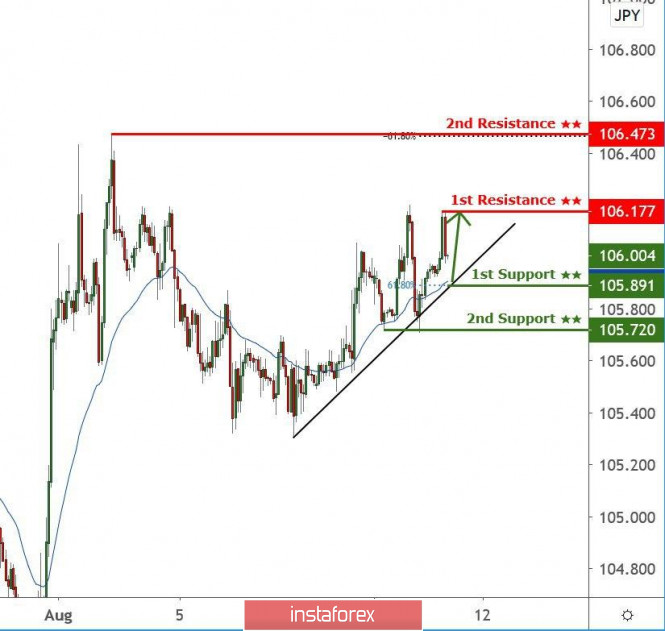
| AUDUSD looking for short term push up above trendline! Posted: 10 Aug 2020 07:10 PM PDT
Trading Recommendation Entry: 105.891 Reason for Entry: Ascending trendline support, moving average support, 61.8% Fibonacci retracement Take Profit: 106.177 Reason for Take Profit: Graphical swing high Stop Loss: 105.720 Reason for Stop Loss: Recent swing low The material has been provided by InstaForex Company - www.instaforex.com |
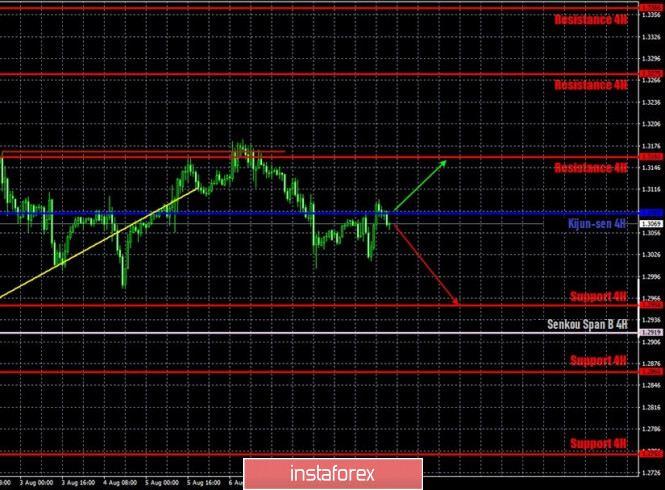
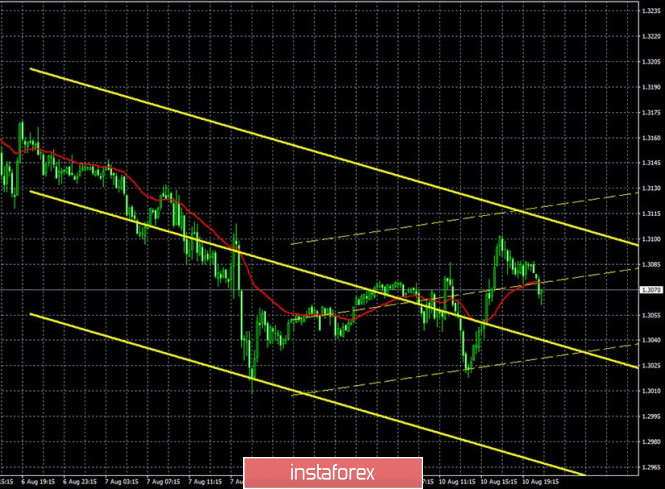
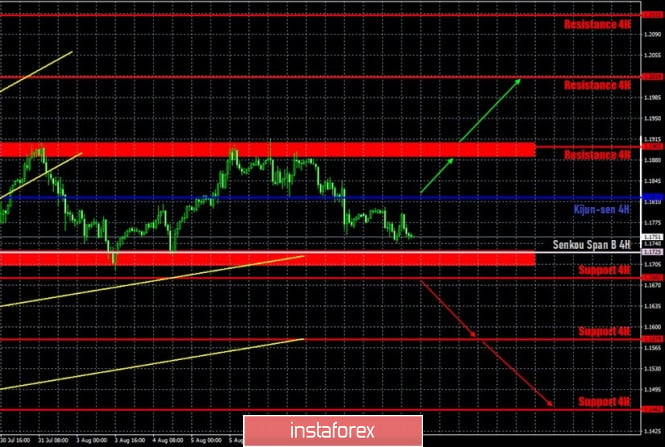
| Posted: 10 Aug 2020 06:39 PM PDT GBP/USD 1H The GBP/USD pair moved almost identical to the European currency on August 10. For the time being. The pound/dollar pair did not sharply jump closer to the end of the trading day, but given the weak volatility on Monday, this rise was enough to block all the downward movement before that. Therefore, the British pound finished the day in positive territory. However, its prospects remain dim, as traders failed to break the 1.3169 level several times. By the way, the prospects for the dollar also remain very vague, due to the fundamental background from the US. Thus, the pair is now in a kind of stupor, since there is not enough reason either to continue growing or to start falling. GBP/USD 15M The lower linear regression channel turned up on Monday on the 15-minute timeframe, showing no downward trend on that day. The latest Commitment of Traders (COT) report the British pound, which was released on Friday, finally matched what is happening now in the market. Recall that two COT reports previously showed a decrease in the net position of non-commercial traders, which, in fact, means that the bullish mood is weakening. That is, the most important category of "non-commercial" traders reduced (roughly speaking) purchases of the British pound during the previous two weeks and at the same time, the UK currency became more expensive. However, the latest COT report finally showed an increase in the number of Buy-contracts for non-commercial traders, by almost 5,000. At the same time, they also closed Sell-contracts, which were reduced by 3,500. Thus, the total net position for this category increased by 8,500. The pound lost just about 140 points at the end of last week and the beginning of the new week, if you count from the last high. This is very small in the context of COT reports and the concept of a trend. This is not even a correction in the medium term. The fundamental background for the GBP/USD pair did not change on Monday. However, as recently as last Friday, one of the members of the British government, Michael Gove, gave an interview completely unnoticed, saying that the last round of negotiations with Brussels ended with some progress, which gives hope for the signing of a trade deal in September. What is remarkable is that neither Boris Johnson, nor Michel Barnier, nor David Frost (actually, the chief negotiator from the UK) said anything like this in the media. It is unclear as to where Gove got this information. Moreover, British Prime Minister Boris Johnson was due to personally fly to Brussels for talks with top EU officials back in July. It is August 11 today, and the British prime minister has not been to Brussels, and does not speak about this in an interview. Thus, from our point of view, absolutely nothing has changed in this issue and there is no reason for optimism. There are only regular rumors that the European Union is allegedly ready to concede on issues of fishing and European standards. These rumors are not confirmed by anything. Official information - six rounds of negotiations failed, no progress was made on the key four issues. There are two main options for the development of events on August 11: 1) Buyers continue to dominate the market, only taking a timeout in recent days. They did not manage to gain a foothold above the previous local high of 1.3169, so we recommend opening new purchases of the British currency, but not before breaking the 1.3169 level while aiming for the resistance level of 1.3275. In this case, the potential Take Profit is about 90 points. Formally, longs can be opened after overcoming the Kijun-sen, but we would recommend waiting until the 1.3169 level has been overcome. 2) The bears stayed below the Kijun-sen line with great difficulty. Thus, we can now consider trading downward with the targets at the support level 1.2956 and the Senkou Span B line (1.2919). Potential Take Profit in this case is from 90 to 120 points. However, you should be careful with sales. There are many factors working in favor of starting the fall, but the bears are still very weak. Stop Loss can be placed above Kijun-sen. The material has been provided by InstaForex Company - www.instaforex.com |
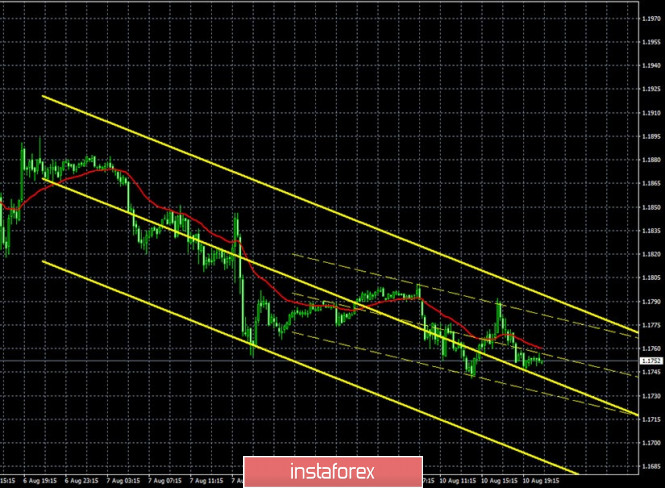
| Posted: 10 Aug 2020 06:37 PM PDT EUR/USD 1H The technical picture for the euro/dollar pair has not changed much on the hourly timeframe of August 10. The pair traded slightly below the critical Kijun-sen line throughout the trading day, thus preserving the prospects for further downward movement. There was no downward movement, which is still considered likely and logical, since the pair had been increasing in price for about three months before. However, the quotes failed to get close to the Senkou Span B line, as well as to the support area of 1.1702-1.1727, which are strong obstacles in the way of bears. The prospects of the US currency depend on them. EUR/USD 15M Both linear regression channels are directed downward on the 15-minute timeframe, which perfectly reflects what is happening on higher timeframes. The latest Commitment of Traders (COT), released on Friday, showed that the mood of professional traders did not change at all during the last reporting week on July 29-August 4 (we remind you that the report is published with a three-day delay). During this time period, the "non-commercial" category of traders opened 19,354 Buy-contracts and closed 3,561 Sell-contracts. Thus, the net position for the most important category of traders has grown by 23,000 at once, which is a very large and eloquent indication of the current mood of the major players. The most important thing is that the data exactly matches what is happening in the foreign exchange market, since the euro as a whole continued to grow until August 4. The euro did not suffer any losses during the next three trading days of the week. Thus, so far, everything is going to the point that the next COT report will show that non-commercial traders are increasing purchases. In recent days, the pair has lost about 120 points, but this drop is too weak to be reflected in the COT report. The fundamental background for the EUR/USD pair did not change at all on Monday, as there were no important news or macroeconomic publications during the day. Therefore, there is nothing to analyze. We can only continue to consider global fundamental topics that support or pressure a particular currency in the long term. The main topic is still the coronavirus in the United States. According to the latest information, the number of daily recorded cases of the COVID-2019 virus is becoming less. However, it is too early to talk about the end of the epidemic wave. At the same time, a new political scandal is brewing in the United States, as US President Donald Trump signed several decrees concerning assistance to the American population affected by the coronavirus. He signed it without the approval of the US Congress, which he had no right to do under the law. Now we should expect a response from the Democrats, who can sue the president again or, at least, "dump a truck of stones into his garden" in the form of criticism. Based on all of the above we have two trading ideas for August 11: 1) Buyers have not managed to overcome the resistance level of 1.1911. They temporarily remain outside of what is happening in the market. To make new purchases of the euro, you need to wait for the price to be consolidated above this level (or the resistance area of 1.1884-1.1910). Then we will recommend buying the pair while aiming for the resistance level of 1.2019. In this case, the potential Take Profit is about 80 points. Although, even when the price consolidates above the Kijun-sen line (1.1817), the bulls may start pressing with the target of the resistance level 1.1902, which you can also try to work out. 2) The bears are using their chances with great difficulty. The fact that they still managed to overcome the Kijun-sen line is good. However, for now they can only anticipate a downward movement to the Senkou Span B line (1.1725), to which there are only a few points left. Thus, we recommend considering new sales of the euro after overcoming the support area of 1.1702-1.1727 with the target of 1.1579. Potential Take Profit in this case is about 80 points. The material has been provided by InstaForex Company - www.instaforex.com |
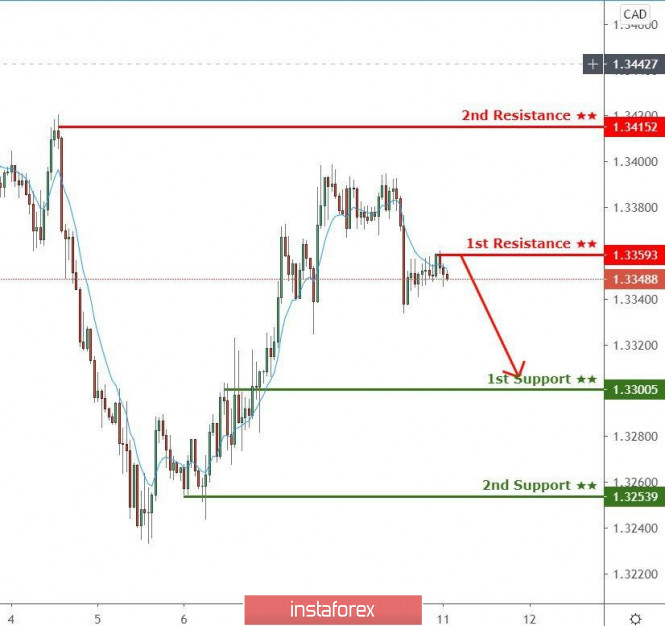
| USDCAD reversing from 1st resistance, further drop! Posted: 10 Aug 2020 06:20 PM PDT
Trading Recommendation Entry: 1.3361 Reason for Entry: Horizontal overlap resistance Take Profit :1.3415 Reason for Take Profit: Horizontal swing high Stop Loss:1.1.3300 Reason for Stop loss: Horizontal overlap support The material has been provided by InstaForex Company - www.instaforex.com |
| Posted: 10 Aug 2020 05:39 PM PDT 4-hour timeframe
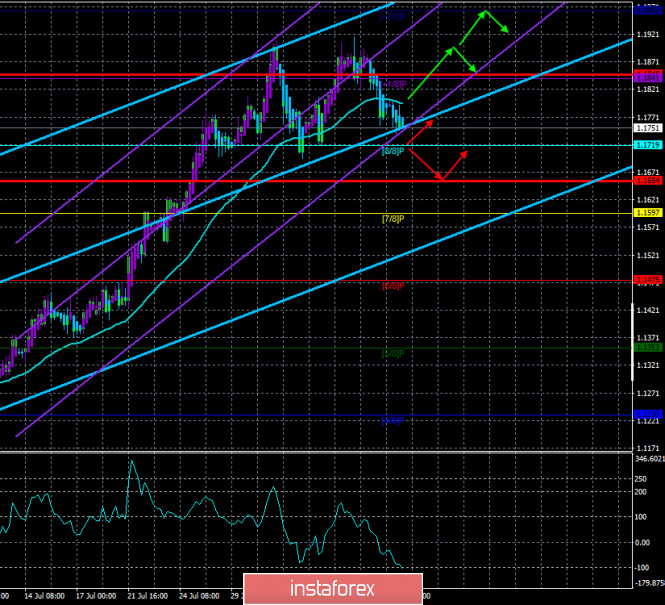
Technical details: Higher linear regression channel: direction - upward. Lower linear regression channel: direction - upward. Moving average (20; smoothed) - sideways. CCI: -26.6721 The British pound fixed below the moving average line on Friday. However, it became clear on Monday that the downward movement will not continue, at least for now. The fact is that the pair stood in one place for the entire European session, and in the American session it jumped up. At the same time, there were no objective reasons for another fall in the US currency. More precisely, there were no immediate, point-based reasons that caused the dollar to fall on Monday. In general, the situation continues to be not in favor of the US currency. We have repeatedly written about the "4 American crises", which continue to put strong pressure on the dollar's position. It is so strong that the bears simply do not risk selling the euro/dollar pair now. And what else can you expect from market participants, if even in difficult times for the country, when GDP losses in the second quarter amounted to a record 33%, the government cannot come to a common opinion and agree on the next package of economic assistance? And this is not to mention the measures that should have been taken to stop the spread of the COVID-2019 virus. But no, the US President is concerned only with his political ratings, the Democrats - the issue of waging war against Donald Trump, and the whole world is divided into two camps: the first supports Trump, because he believes that he will successfully destroy America, the second – against Trump, since it is impossible to agree with him at the international level on any issue. So the result is a situation in which the dollar has long been expected to start growing elementary for technical reasons, but instead risks going to a new stage of a long fall. The most interesting thing is that there is still no important or even interesting news coming from the UK. Only tomorrow and the day after tomorrow will there be some really important macroeconomic reports from the Foggy Albion. The main one is the GDP report for the second quarter. But while the British pound is waiting for news, the US dollar receives it daily. As recently as this weekend, some American publications started talking about a new type of crisis that the United States may face in the near future or rather in the final stage of 2020. Earlier, we have repeatedly written that Donald Trump is unlikely to give up without a fight in the election. If he loses them, he will challenge the results through the courts and try to cancel the results of the vote. During the election itself, he will try to block access to the polls of Americans in those cities where Biden's victory is most likely. Formally, he can even simply refuse to leave the White House, since there is no legal article that would determine the process of the President's resignation at the end of his presidential term. And this is not our speculation, this is what many American media write about. This is what the Americans themselves fear. So, some media outlets started talking this weekend about a full-scale "constitutional crisis" that could begin on November 3 (if Trump loses the election) and end no earlier than January 2021, when Trump will have to leave the White House (if he loses the election). According to American political scientists, the problem of fraud and deception in the elections themselves is not the most serious problem possible. Also, experts are not too afraid that Trump will simply refuse to leave his residence. But the fact that the US President has the full right to use the forces of the national guard, army and other security agencies is really very frightening. Theoretically, Donald Trump can bring all the country's military forces to the streets of US cities to prevent a change of power in the country. Of course, this is one of the most unlikely options, however, what did Trump want to do when rallies and protests began in many cities as part of the "Black Lives Matter" movement? That's right, to suppress rallies with the help of the regular army, which shocked absolutely all politicians and the Pentagon. Thus, there are no prohibited techniques for Trump. At any moment, he might unearth a law from 1812 that no other President would have thought of using. Experts also fear that Trump will try to transfer federal funds to his companies, pardon a number of individuals, including himself, thus protecting himself from possible future proceedings related to his activities during the presidential term. Experts also fear that Trump may go on principle and refuse to hand over many important files to Biden, simply destroying them. Roughly speaking, Trump can leave an unsightly legacy behind to criticize President Biden in the future. In general, the end of 2020 will definitely be fun, at least for America. On Tuesday, the UK will publish data on average wages, applications for unemployment benefits, and the unemployment rate for June or July. According to experts' forecasts, it is not worth waiting for good data on wages. Both with and without bonuses, a reduction is expected. The unemployment rate may rise from 3.9% to 4.2% in June, and the number of applications for benefits will increase by 5-10 thousand. Thus, all three reports may be quite weak. However, will this help the US currency? No important planned information is expected from overseas. However, what is happening in America now gives us guarantees of getting important and interesting data almost every day. And about the nature of this data, you can not even talk. With a 99% probability, they will be negative for the US currency. Thus, the US dollar may start falling again against the weak British pound. With this solely because of its own "issuer". Not the Fed, but the US, whose government continues to completely fail 2020.
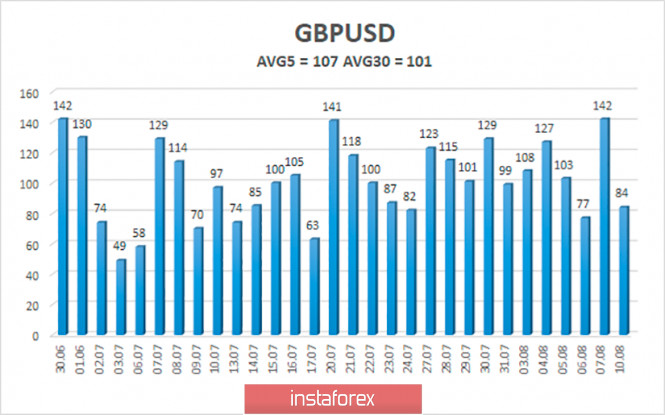
The average volatility of the GBP/USD pair continues to remain stable and is currently 107 points per day. For the pound/dollar pair, this value is "high". On Tuesday, August 11, thus, we expect movement within the channel, limited by the levels of 1.2969 and 1.3183. Turning the Heiken Ashi indicator downward will indicate a possible resumption of the downward movement. Nearest support levels: S1 – 1.3062 S2 – 1.3000 S3 – 1.2939 Nearest resistance levels: R1 – 1.3123 R2 – 1.3184 R3 – 1.3245 Trading recommendations: The GBP/USD pair on the 4-hour timeframe began a round of upward correction, which may end with the resumption of the upward trend. Thus, today it is recommended to open short positions with the goals of 1.3000 and 1.2969, if the price is again fixed below the moving average. Buy orders are recommended to be considered with the goals of 1.3123 and 1.3158, if the pair remains above the moving average line, and the Heiken Ashi indicator will color the bars purple. The material has been provided by InstaForex Company - www.instaforex.com |
| Posted: 10 Aug 2020 05:39 PM PDT 4-hour timeframe
Technical details: Higher linear regression channel: direction - upward. Lower linear regression channel: direction - upward. Moving average (20; smoothed) - sideways. CCI: -103.0492 The EUR/USD currency pair continued its rather weak downward movement on Monday, breaking the moving average line on Friday. Thus, for now, the new downward trend continues, however, it still looks somewhat uncertain. Bears are clearly afraid of serious purchases of the US currency while the "coronavirus", economic and political crises continue to rage in theUnited States themselves. Thus, despite the fact that the strengthening of the dollar has been brewing for a long time, it is likely that the bulls will soon return to the market, which will lead to a new round of growth of the European currency. At the moment, the pair's quotes have not even managed to work out the previous local minimum. Trading on the first trading day of the week was quite boring and low-volatility. There were no macroeconomic statistics scheduled for this day in either the European Union or the United States. But there was news of a political nature, just what America has been missing since the time when Trump became President. Last weekend, it became known that Donald Trump signed executive orders that provide financial assistance to the American population affected by the pandemic. At first glance, what's so strange about this news? But this is only at first glance. In fact, Trump went against the US Congress. Any resolution, law, or decree must be approved by a majority vote of Congress before being signed by the President. Thus, the documents signed by Trump have no legal force. In this way, the President of the United States can sign any regulations and laws that he wants every day, and in January 2021, he can simply re-appoint himself President and refuse to leave the White House in the event of an election defeat. However, this is only one side of the coin. The most interesting thing is that one of Trump's executive orders involves paying Americans who lost their jobs due to the "coronavirus", bonuses to unemployment benefits in the amount of $ 400 a week. It was around these "coronavirus allowances" that the debate between Democrats and Republicans was going on. Democrats insisted on keeping $ 600 a week, and Republicans wanted to reduce it to $ 200, since for many Americans, the total benefits payments exceeded wages, which completely deprived them of motivation to look for a new job. The disputes went on for several weeks, however, the parties failed to reach a compromise. However, the last proposal of the Democrats suggested lowering the volume of the package of assistance to the American economy by 1 trillion dollars (which meant reducing the amount of payments to Americans), if the Republicans also raised their offer by 1 trillion. By and large, in this case, the parties could agree on about 2 trillion aid packages. However, instead, Trump rejected such a proposal and signed an executive order that implies not only an increase in "coronavirus allowances" (relative to the original proposal of the Republicans), but also a tax holiday on income tax for all Americans whose earnings are less than $ 100,000 a year. According to experts, more than 90% of Americans fall into this category. In fact, for them, Trump canceled income tax before the end of the year and promised new tax breaks if he is re-elected President. It is unclear how Trump is going to fill the budget if taxes are not paid by almost all US citizens. The national debt is already inflated to 26 trillion dollars, and by the end of the year it may reach 30 trillion. However, most of all, what will the Democrats do now? After all, in fact, Trump's rulings can easily be overturned through the courts, since Congress did not approve them. Yes, it will take some time to consider this case, however, there is little doubt that the outcome will be successful for the Democrats. We believe that with this step, Trump wanted, as usual, to increase his political ratings, "taking care of the American population, which is waiting for help now" (a few weeks ago, "coronavirus payments" were stopped, as the previous package of assistance to the economy banally ended). Nancy Pelosi and Chuck Schumer immediately accused Trump of trying to distract the attention of the electorate from his own failed policies during the pandemic. Well, while Donald Trump is at war with the Democrats and waiting for their response, China has imposed retaliatory sanctions against the United States. Under them were 11 officials from America. Beijing said that the return of Hong Kong to China was met with universal approval, and Hong Kongers themselves received a number of unprecedented rights. There was no other news on the first trading day of the week. On Tuesday, August 11, the European Union will release several secondary reports that are unlikely to interest traders. We are talking about the indices of economic sentiment in Germany and the EU from the ZEW Institute. In the United States, no publications are planned for today, but at the same time, new data on the confrontation between Democrats and Republicans may be received. The US President gave the opportunity to start a new trial against himself, and accuse himself once again of abuse of power. The US dollar is still very indirectly related to this information. He is more interested in data on the "coronavirus" epidemic. There are certain positive aspects here, as the number of people infected daily has decreased by about 10-15 thousand. At the same time, we cannot say that the pandemic has receded. From a technical point of view, the downward movement can continue, however, it can also be interrupted at any time, since the bears are extremely weak at the moment. In some ways, we are again faced with a paradoxical situation, since the euro currency grew for almost three months (with small interruptions) and managed to add about 12 cents. Thus, there should be a correction now, however, buyers do not close long positions, and sellers do not open short ones. All this leads so far to a sluggish decline in quotes.
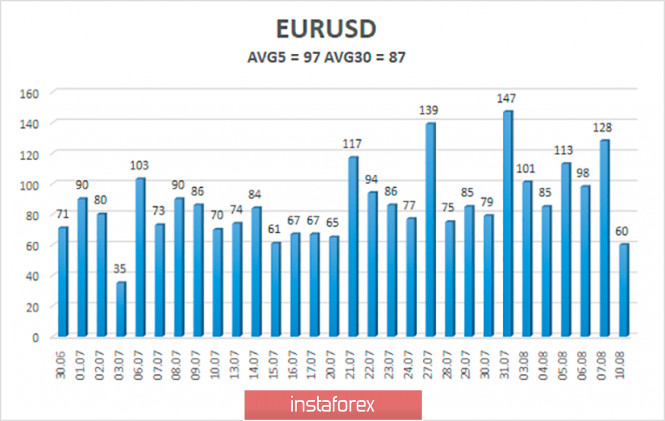
The volatility of the euro/dollar currency pair as of August 11 is 97 points and is characterized as "high". Thus, we expect the pair to move today between the levels of 1.1654 and 1.1848. A reversal of the Heiken Ashi indicator upward will signal a round of upward correction within the now downward trend. Nearest support levels: S1 – 1.1719 S2 – 1.1597 S3 – 1.1475 Nearest resistance levels: R1 – 1.1841 R2 – 1.1963 Trading recommendations: The EUR/USD pair may have started a new downtrend, breaking the moving average. Thus, at this time, it is recommended to sell the currency pair with the goals of 1.1719 and 1.1654 before the Heiken Ashi indicator turns upward. It is now recommended to open buy orders no earlier than the pair is re-anchored above the moving average line with the first targets of 1.1911 (the previous local maximum) and 1.1963. The material has been provided by InstaForex Company - www.instaforex.com |
| EUR/USD. Mnuchin rushes to the rescue: US Treasury Secretary kept the dollar afloat Posted: 10 Aug 2020 01:49 PM PDT The dollar index shows wave-like dynamics today, while remaining within the 93-figure. Key dollar pairs also cannot determine the vector of their movement, repeating the trajectory of the greenback. This situation is due to the contradictory fundamental background that has developed for the US currency on the first trading day of this week. What happened? First of all, take note that American politicians have not been able to pass a bill on providing additional assistance to the US economy for several months (namely, since the end of spring). US Secretary of Treasury Steven Mnuchin promised to present a corresponding legislative initiative back in May – and it was about two trillion dollars. His rhetoric provided support for the dollar, as the first aid package, which was adopted in March (that is, at the peak of the epidemic) gradually dried up. But Mnuchin's words diverged from the case: the White House could not agree on a draft law with Republicans in Congress. As a result, the document "worth" one trillion dollars came to the consideration of congressmen only at the end of July, while on July 31, the deadline for additional weekly 600-dollar payments to the American unemployed expired. Traders had hoped that the politicians would have time to find a compromise before the 31st, but they were mistaken in their expectations. The negotiation process is mired in a swamp of political recriminations. The fact is that in the spring, representatives of the Democratic party have already introduced a similar bill with a volume of three trillion dollars. It was even passed in the Lower House of Congress (which is controlled by Democrats). But the Senate, which is in the power of Republicans, rejected this initiative, considering it too costly. And now a mirror situation has occurred: Republicans need the votes of Democrats in the House of Representatives, while Democrats insist on increasing the amount of aid to at least $2 trillion. The talks have been going on for the past two weeks,and they reached an impasse over the weekend. After that, US President Donald Trump made a non-standard decision in every sense: bypassing the US Congress, he issued four executive orders, which, in particular, provide for the provision of additional unemployment benefits worth $400 a week and the suspension of payments on some student loans until the end of the year. Everything would be fine, but the problem is that from a legal point of view, the issued decrees do not stand up to any criticism. According to many experts, the president has exceeded his powers, since Congress is the only one that can make decisions on public spending. Representatives of the Democratic Party have already promised to appeal the above decrees in court. This news flow put pressure on the dollar: the EUR/USD pair recovered and even tested the 18th figure during the Asian session on Monday and at the start of the European session. But the pair's buyers failed to develop the upward movement. They were prevented by Mnuchin, who again voiced very optimistic comments. According to him, in spite of mutual criticism, the negotiations in Congress on the above draft law will continue, "and a compromise can be reached this week." Against the background of such rhetoric, the dollar stopped falling and showed character again. In turn, the EUR/USD pair dropped to the middle of the 17th figure. In addition, the dollar was indirectly supported by a surge in anti-risk sentiment, which was associated with the arrest of influential media mogul Jimmy Lai in Hong Kong. A prominent representative of the democratic movement in this semi-autonomous city was arrested under the recently adopted law on the national security of the PRC - "for collusion with foreign forces." This detention took place amid recently imposed sanctions by Washington against the Hong Kong administration. Today's events may complicate the already difficult relationship between the United States and China. How do I trade? The contradictory fundamental background for the pair does not make it possible for us to make unambiguous conclusions regarding the prospects for EUR/USD. Bears cannot consolidate below the support level of 1.1750 at the end of the day, while bulls cannot return to the area of the 18th figure. And although bearish sentiments are still prevailing for the pair, the price is within the framework of the flat, and, therefore, it is not worth making hasty decisions. If the pair remains above the 1.1750 level by tomorrow, it will be possible to open longs with the first target at 1.1800 and the next target at 1.1840 (the middle line of the Bollinger Bands indicator, which coincides with the Kijun-sen line on the four-hour chart). Otherwise, sellers will be able to pull down the price towards the bottom of the 17th figure. The material has been provided by InstaForex Company - www.instaforex.com |
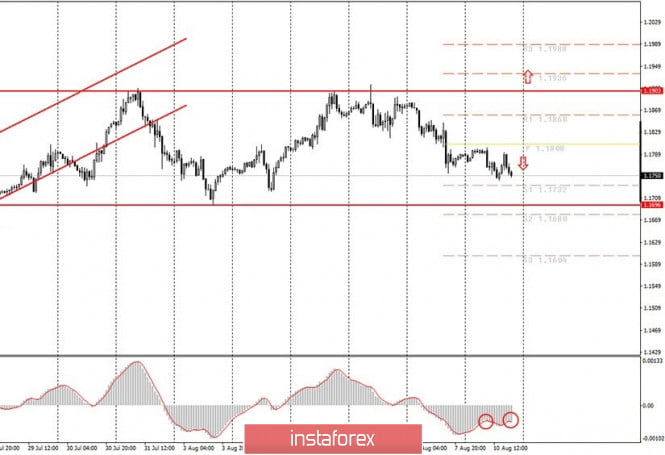
| Posted: 10 Aug 2020 01:49 PM PDT Hourly chart of the EUR/USD pair The EUR/USD pair tried to resume the downward movement twice on Monday, August 10. However, on the whole, trading was held in a narrow price range with little volatility (only 60 points were passed from the high to the low of the day) on the first trading day of the week. Thus, novice traders fell into the so-called "flat" (sideways movement), which a priori is very difficult to work with. Sellers did not find the strength to further pull down the EUR/USD pair during the day, however, they resumed the downward movement closer to the end of the day. True, it is extremely inconvenient to work with it now. Firstly, it is not clear whether the flat has ended? Secondly, there were no macroeconomic events on Monday, but they will not happen on Tuesday, so the pair's sluggish and weak movement may persist tomorrow. From a fundamental point of view, there is nothing to analyze on Monday. There were no economic news or reports on the first trading day of the week. There were only "funny stories" from the US President Donald Trump, who at the end of his presidential term set out to make decisions on major issues without the approval of Congress. However, this information should not be of interest to novice traders, since it does not directly affect the behavior of the currency pair. In general, the fundamental background is still not in favor of the US dollar, since the situation in America is very difficult. Both epidemiological, political, and economic. The latest reports on Nonfarm Payrolls and unemployment gave a bit of optimism to buyers of the dollar, but, as we can see, without news support, the downward movement has essentially stopped. So this is a very delicate moment. It is not recommended to take unnecessary risks. Neither the European Union nor the United States will have any macroeconomic data worth paying attention to on Tuesday, August 11. Therefore, if the market does not receive any information "bomb" during the day, most likely, the pair will continue a rather weak movement with a downward bias. This means that the pair could fall by another 20-30 points at the end of the day, but there will most likely be "fluctuations" again (frequent changes in the direction of price movement within a short period of time) during the day. Thus, we advise novice traders to trade carefully and with caution. The following scenarios are possible on August 11: 1) Buying the pair at this time is irrelevant, since the price was unable to overcome the 1.1903 level. Thus, traders are now simply deprived of buy signals. Based on this, we do not recommend trading the pair up. We still believe that quotes should fall at least to the 1.1696 level, and only after that it will be possible to speculate about a possible resumption of the upward trend. 2) Selling the currency pair is still more promising now, at least with the target of 1.1696 (previous local low). However, there are about 60 points to this goal, and with the current volatility, it will be difficult to pass even these 60 points. Thus, in the current situation, we recommend not to trade the pair until the morning (since the probability of a trend movement is even lower at night), and wait for a new down MACD signal to open new short positions in the morning and on Tuesday. What's on the chart: Support and Resistance Price Levels - Levels that are targets when buying or selling. You can place Take Profit levels near them. Red lines - channels or trend lines that display the current trend and show which direction it is preferable to trade now. Arrows up/down - indicate when you reach or overcome which obstacles you should trade up or down. MACD indicator is a histogram and a signal line, the crossing of which is a signal to enter the market. It is recommended to use in combination with trend lines (channels, trend lines). Important speeches and reports (always contained in the news calendar) can greatly influence the movement of a currency pair. Therefore, during their exit, it is recommended to trade as carefully as possible or exit the market in order to avoid a sharp price reversal against the previous movement. Beginners in the forex market should remember that every trade cannot be profitable. The development of a clear strategy and money management are the key to success in trading over a long period of time. The material has been provided by InstaForex Company - www.instaforex.com |
| GBP/USD: pound strength in dollar's weakness Posted: 10 Aug 2020 09:59 AM PDT Last week, the British currency hit its highest levels since March against the US dollar, rising above 1.3180. The main reason for this movement was the general drawdown of the US currency. According to experts, the GBP/USD pair will go down as soon as the greenback stops weakening. Pressure on the dollar has intensified in the past few weeks amid an increase in the number of COVID-19 infections in the United States, a steady decline in US government bond yields and a lack of consensus in Washington on additional financial stimulus. Any improvement in investor sentiment towards the US dollar could easily push the GBP/USD pair back below the 200-day moving average, which is now in the 1.2900 region, Swissquote Bank said. "The Bank of England has revised its view of negative interest rates, noting that it has other instruments of monetary policy at its disposal. This provoked a sharp surge in purchases of the pound after the meeting of the regulator. However, the doves in the central bank are likely to maintain their position due to the coronavirus pandemic and uncertainty around Brexit," the bank experts said. "Finding the GBP/USD pair above 1.30 depends on the demand for the US dollar," they added. Following the July meeting, the Bank of England left interest rates unchanged. The central bank also slightly improved its economic forecasts. However, investors are still citing the fact that the central bank may increase the volume of the quantitative easing (QE) program by the end of the year. A number of UK data will be released this week. In particular, the report on the local labor market will be released on Tuesday, and the data on industrial production for June and the country's GDP in the second quarter will be published on Wednesday. The British economy is expected to contract more than 20% in the reporting period. The GBP/USD pair is still trading within the upward channel. The upward trend support line is currently at 1.3025. Further support goes at 1.2985 and 1.2900. Resistance is located at 1.3115, 1.3170 and 1.3184. The material has been provided by InstaForex Company - www.instaforex.com |
| August 10, 2020 : EUR/USD daily technical review and trade recommendations. Posted: 10 Aug 2020 09:31 AM PDT
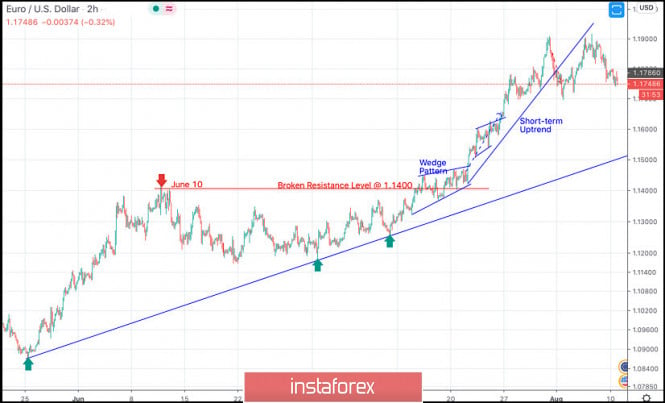
The EURUSD pair has been moving-up since the pair has initiated the depicted uptrend line on May 25. On June 11, a major resistance level was formed around 1.1400 which prevented further upside movement for some time and forced the pair to have a downside pause. Recently, the EURUSD demonstrated an ascending wedge around the mentioned price level of 1.1400.However, recent negative fundamental data from the U.S. have caused the EUR/USD to achieve another breakout to the upside. By the end of last week, the EURUSD has been approaching the price levels around 1.1900 where signs of downside pressure were enhanced by the negative fundamental reports from Germany on Friday. Intraday traders should be considering the current breakdown of the depicted short-term uptrend line. A Breakdown below the price level of 1.1650 is going to give a better confirmation for a valid SELL Position. Estimated targets would be located around 1.1550, 1.1500 then 1.1450. On the other hand, Conservative traders should consider the recent bullish pullback toward the backside of the broken short-term uptrend for another SELL Position with a lower risk. The material has been provided by InstaForex Company - www.instaforex.com |
| August 10, 2020 : EUR/USD Intraday technical analysis and trade recommendations. Posted: 10 Aug 2020 09:27 AM PDT
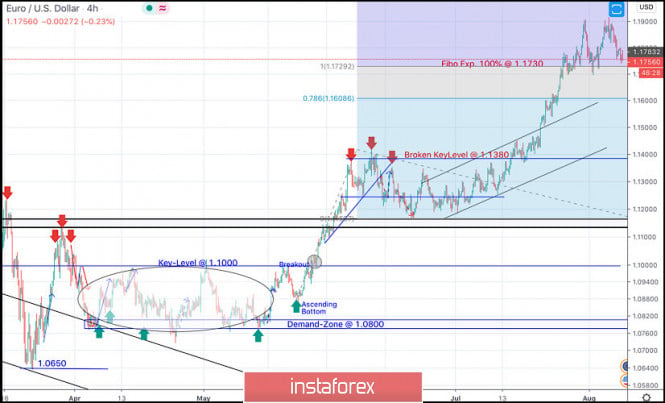
On March 20, the EURUSD pair has expressed remarkable bullish recovery around the established bottom around 1.0650. Shortly after, a sideway consolidation range was established in the price range extending between 1.0770 - 1.1000. On May 14, evident signs of Bullish rejection as well as a recent ascending bottom have been manifested around the price zone of (1.0815 - 1.0775), which enhances the bullish side of the market in the short-term. Bullish breakout above 1.1000 has enhanced further bullish advancement towards 1.1150 then 1.1380 where another sideway consolidation range was established. Hence, Bearish persistence below 1.1150 (consolidation range lower limit) was needed to enhance further bearish decline. However, the EURUSD pair has failed to maintain enough bearish momentum to do so. Instead, the current bullish breakout above 1.1380-1.1400 has lead to a quick bullish spike directly towards 1.1600 (Fibonacci Expansion 78.6% level) which failed to offer sufficient bearish pressure. That's why, further bullish advancement pursued towards 1.1730 (Fibonacci Expansion 100% level) which failed to offer sufficient bearish rejection for a few days until Today. Bullish persistence above 1.1730 will probably favor further bullish advancement towards 1.2075 (161% Fibo Expansion Level) in the intermediate-term. On the other hand, bearish re-closure below 1.1730 indicates lack of bullish momentum and enhances further bearish decline initially towards 1.1600. Trade recommendations : Conservative traders should wait for the current bullish movement to pause and get back below 1.1730 as an indicator for lack of bearish momentum for a valid SELL Entry.T/P levels to be located around 1.1600 and 1.1500 while S/L to be placed above 1.1800 to minimize the associated risk. The material has been provided by InstaForex Company - www.instaforex.com |
| August 10, 2020 : GBP/USD Intraday technical analysis and trade recommendations. Posted: 10 Aug 2020 09:25 AM PDT
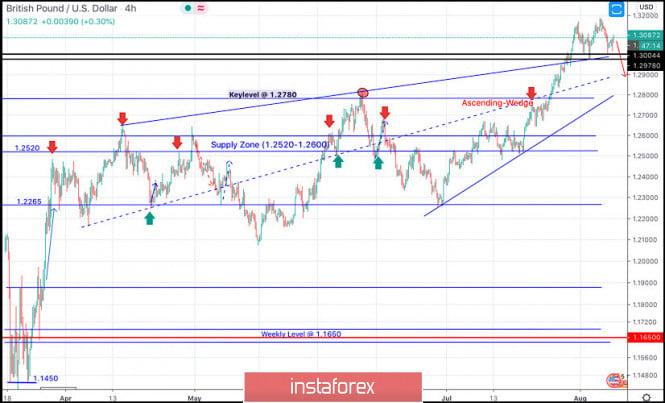
Since April, the GBPUSD has been moving sideways within the depicted consolidation range extending between (1.2265 - 1.2600)On May 15, transient bearish breakout below 1.2265 (consolidation range lower limit) was demonstrated in the period between May 13 - May 26, denoting some sort of weakness from the ongoing bullish trend. However, immediate bullish rebound has been expressed around the price level of 1.2080 bringing the GBPUSD back above the depicted price zone of 1.2520-1.2600 which failed to offer sufficient bearish rejection. Further bullish advancement was expressed towards 1.2780 (Previous Key-Level) where another episode of bearish pullback was initiated. Short-term bearish movement was expressed, initial bearish targets were located around 1.2600 and 1.2520 which paused the bullish outlook for sometime & enabled further bearish decline towards 1.2265. Significant bullish rejection was originated around 1.2265 bringing the GBP/USD pair back towards 1.2780, where the mid-range of the depicted wedge-pattern failed to offer enough bearish rejection. Intermediate-term Technical outlook for the GBP/USD pair remains bullish as long as bullish persistence is maintained above 1.2780 (Depicted KeyLevel) on the H4 Charts. On the other hand, significant bearish rejection was demonstrated around the price level of 1.3160 in the form of (Bearish Engulfing Candlesticks). Hence, upcoming bearish reversal should be expected provided that early bearish breakout occurs below 1.2980 (the depicted wedge pattern upper limit). Trade recommendations : Technical traders are advised to wait for any upcoming bearish breakdown below 1.2980 as a valid SELL Entry. Initial T/p level is to be located around 1.2780. On the other hand, bullish persistence above 1.2980 invalidates this trading scenario. The material has been provided by InstaForex Company - www.instaforex.com |
| US dollar rises slowly retrieves lost ground Posted: 10 Aug 2020 09:06 AM PDT
The US dollar finally began to show signs of strengthening on the first working day of this week. The growth took place against the euro, as well as against the Swiss franc. The main focus of market participants is now on the stimulus measures in the US, as well as the escalation of the conflict between Washington and Beijing. It should be noted that a new round of tension may seriously affect the course of the negotiation process between the countries on the issue of a trade agreement, which is scheduled for the end of this week. The USD index against a basket of six major world currencies rose significantly by 0.19%, which allowed it to move to the level of 93.616 points and move slightly away from its minimum values. The news about the signing of a long-awaited decree on a new portion of stimulus measures in the US added to the positive mood of investors. However, this was done in an unusual way: since the Democrats and Republicans failed to reach a consensus on this issue, President Donald Trump took full responsibility and signed the document without the approval of the majority. This, on the one hand, encouraged the markets, which were experiencing tension from hanging in the air and unsolvable problem. On the other hand, it made investors think about the future of such a stimulus policy since statistics presented last week and on Monday indicate improvements in the economy. This allows us to talk about a possible rejection of stimulating measures by the US government. Meanwhile, the new portion of incentives will be smaller in volume. Thus, the payment to those who lost their jobs amid the coronavirus pandemic and entered the labor exchange will now amount to $ 400 per week instead of the previously paid $ 600 per week. Still, analysts say a reduced payout is better than no payout at all. However, the USD began to grow at the end of last week. Then support for the dollar came from a new wave of conflict between the United States and China. Note that the US government decided to impose sanctions against some high-ranking officials from Hong Kong and China. The Chinese authorities responded almost immediately, and in turn, the country's authorities imposed sanctions against eleven US officials. However, the matter is unlikely to be limited to this, and investors are already beginning to prepare for the next unfriendly steps. All these forces market participants to turn again to a safer currency asset - the dollar, which makes its position more confident and its value higher. The single euro has reduced its value against the dollar by about 0.3% and moved to the level of $1.1751 per euro. Meanwhile, the Aussie has become cheaper by 0.17%: now it is traded in the area of $ 0.7145 per Aussie. The Kiwi also sank by 0.26%, and the current mark was within the range of $0.6585 per kiwi. The Swiss franc, which is traditionally considered a safe asset, also reduced its value by 0.6% and moved to the level of $0.9177 per franc. The Canadian dollar remained practically unchanged at around $ 1.3383 per Canadian dollar. The Norweigan krone also slightly corrected downward by 0.02%, its value moved to the area of 1.3383 krone per dollar. The material has been provided by InstaForex Company - www.instaforex.com |
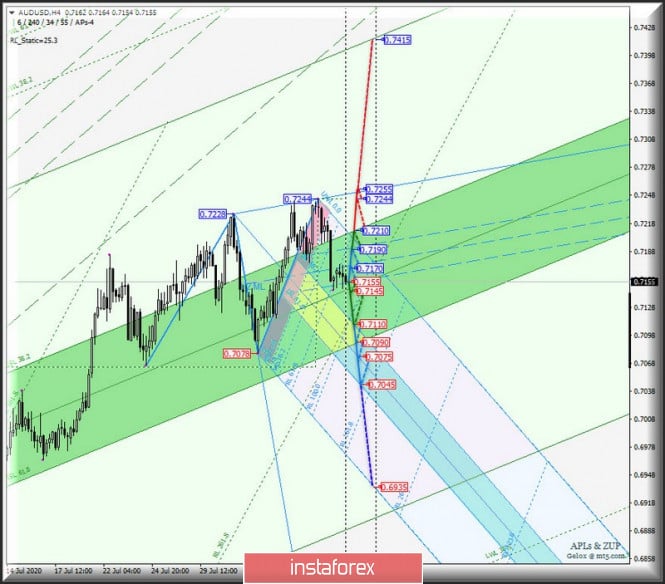
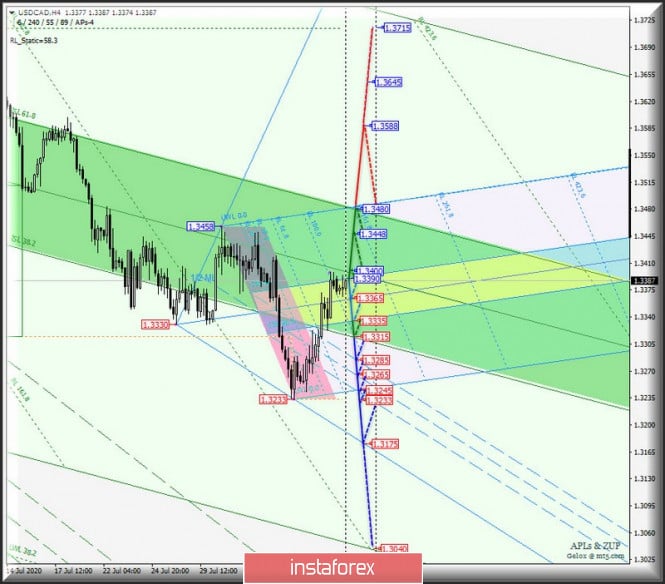
| Posted: 10 Aug 2020 09:03 AM PDT Minute operational scale (H4) The second ten-day period of August - are we continuing to decline? Overview of options for the development of the movement of AUD/USD & USD/CAD & NZD/USD (H4) on August 11, 2020. ____________________ Australian dollar vs US dollar The development of the movement of the Australian dollar AUD/USD from August 11, 2020 will continue depending on the development and direction of the breakdown of the boundaries of the 1/2 Median Line channel (0.7190 - 0.7170 - 0.7155) of the Minuette operational scale forks - see the details on the animated chart. In the case of a consecutive breakdown of the lower border of the channel 1/2 Median Line Minuette - the support level of 0.7155 and the Median line Minute (0.7145), the downward movement of the Australian dollar can be continued to the equilibrium zone (0.7110 - 0.7075 - 0.7045) of the Minuette operational scale forks. A breakdown of the resistance level of 0.7190 at the upper border of the channel 1/2 Median Line Minuette will make it relevant to develop the upward movement of AUD/USD to the goals:
The AUD/USD movement options from August 11, 2020 are shown on the animated chart.
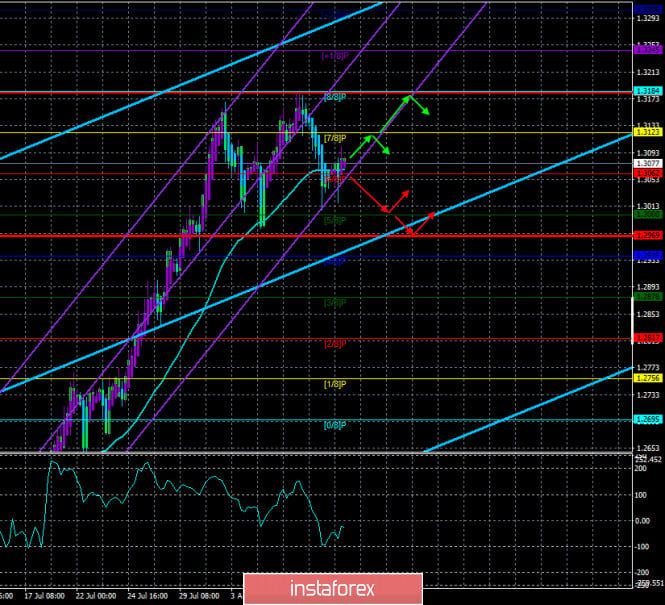
____________________ US dollar vs Canadian dollar The development of the movement of the Canadian dollar USD/CAD from August 11, 2020 will occur depending on the development and direction of the breakdown of the boundaries of the equilibrium zone (1.3335 - 1.3365 - 1.3390) of the Minuette operational scale forks - we look at the movement markings within this zone on the animated chart. If the resistance level 1.3390 is broken at the upper border of ISL61.8 of the balance zone of the Minuette operational scale forks and the Median line Minute (1.3400), the upward movement of USD/CAD can be continued to the goals:
In the breakdown of the support level of 1.3335 on the lower border ISL38.2 zone equilibrium of the Minuette operational scale forks, the downward movement of the Canadian dollar may continue to the lower border ISL61.8 (1.3315) zone equilibrium of the Minute operational scale forks and channel borders 1/2 Median line Minuette (1.3285 - 1.3265 - 1.3245), with the prospect of updating the local minimum of 1.3233, and the line of control LTL Minuette (1.3175). We look at the USD/CAD movement options from August 11, 2020 on the animated chart.
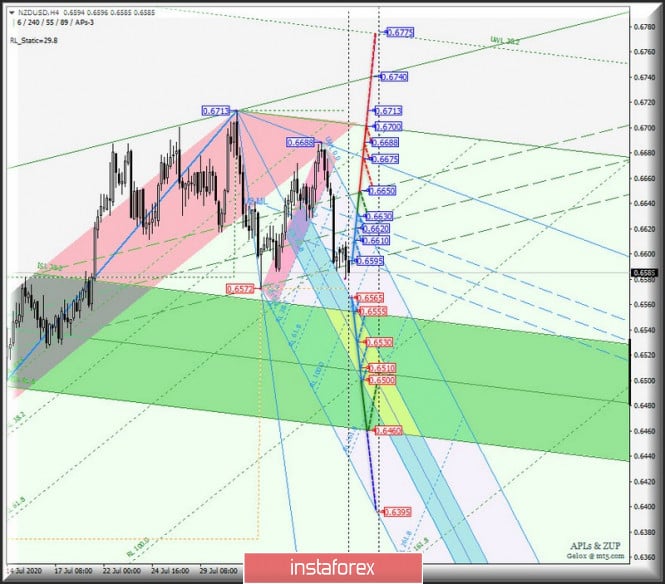
____________________ New Zealand dollar vs US dollar The movement of the New Zealand dollar NZD/USD from August 11, 2020 will develop depending on the development and direction of the range :
The joint breakdown of ISL38.2 Minuette - support level of 0.6565 - and ISL38.2 Minute (1.6555) will confirm that further development of the NZD/USD movement will occur within the boundaries of the balance zones of the operational scales forks - Minuette (0.6565 - 0.6530 - 0.6500) and Minute (0.6555 - 0. 06510 - 0.6460). The breakdown of the resistance level 0.6595 will return the development of the movement of the New Zealand dollar to the boundaries of the 1/2 Median Line channels of the operational scales - Minuette (0.6595 - 0.6610 - 0.6630) and Minute (0.6595 - 0.6620 - 0.6650) with the possibility of reaching the UTL Minuette (0.6675) control line and updating local maximum (0.6688). The markup of the NZD/USD movement options from August 11, 2020 is shown on the animated chart.
____________________ The review is prepared without considering the news background, the opening of the trading sessions of the major financial centers and it is not a guide to action (placing "sell" or "buy" orders). The material has been provided by InstaForex Company - www.instaforex.com |
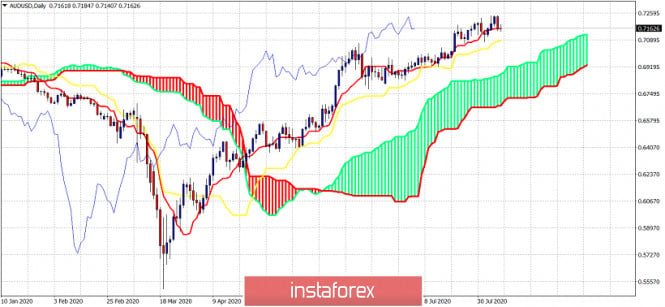
| AUDUSD vulnerable to a pull back towards 0.6920. Posted: 10 Aug 2020 09:02 AM PDT AUDUSD has made an impressive upward move the last few months from 0.55 to 0.72. There are increased chances now for a pull back at least towards 0.69. We use the Ichimoku cloud indicator in order to find the levels we need to watch out.
|
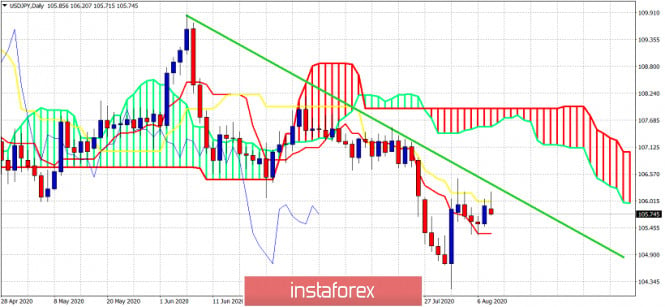
| Ichimoku cloud indicator analysis of USDJPY Posted: 10 Aug 2020 08:46 AM PDT USDJPY is making lower lows and lower highs since early June. Price has broken below the cloud in early July and turned trend to bearish. Price has recently bounced from 104 to 106 as we expected, but we considered this move as short-lived.
USDJPY has resistance at 106.50. As long as price is below that level we remain bearish looking for a move back to 104 and lower. If 106.50 is broken upwards I expect price to move towards the cloud at 107.15-107.50. Another sign of weakness will be if price breaks below 105.30. This is where we find the tenkan-sen support (red line indicator). The material has been provided by InstaForex Company - www.instaforex.com |
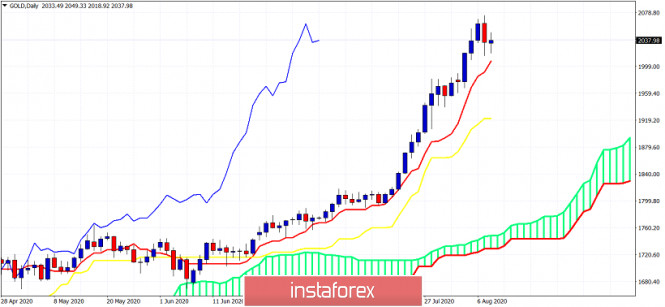
| Ichimoku cloud indicator analysis of Gold Posted: 10 Aug 2020 08:41 AM PDT Gold price remains in a bullish trend still above $2,000. In previous posts we justified a pull back towards $1,900 maximum currently although it is not necessary. The up trend is very strong and we advised traders not to bet against it. Better stay out and wait for pull back to buy.
In previous posts we noted that our next target is around $2,300-$2,400. However in order to achieve such a target Gold price will need first to make a considerable pull back, most probably towards $1,900. The material has been provided by InstaForex Company - www.instaforex.com |
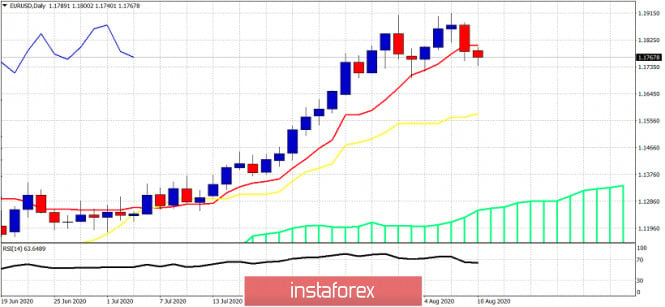
| Ichimoku cloud indicator analysis of EURUSD Posted: 10 Aug 2020 08:36 AM PDT EURUSD is moving lower as expected. In our previous analysis we noted how price had closed below the tenkan-sen indicator and we expect more EURUSD weakness to come this week. As long as price is below 1.1810 EURUSD is vulnerable to a move towards 1.16.
|
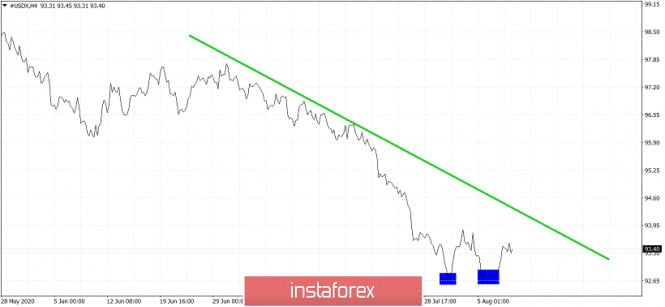
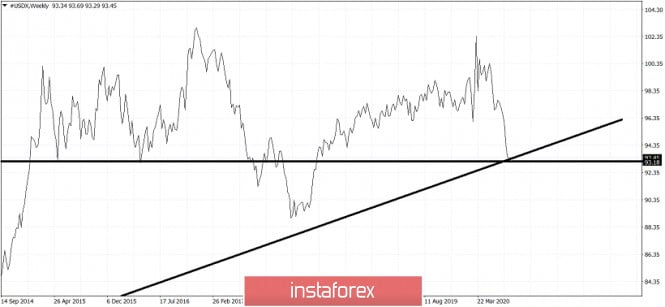
| Dollar index remains in bearish trend but could continue bounce higher. Posted: 10 Aug 2020 08:33 AM PDT The Dollar index has formed a double bottom around 92.70 but price is bouncing. The medium-term trend remains bearish but a bounce higher towards 94 should not be ruled out.
Blue rectangles - double bottom The decline in the Dollar index has paused around the support area of 92-93 as we expected it would in previous analysis. This is a major support area because both horizontal support is found here and a long-term upward sloping trend line comes from this area.
The Dollar index justifies a move higher and a bigger bounce towards 94. Price is at major confluence of support and we do not expect this support to break easily. At least a bounce should follow. That is why we do not prefer to be very bearish the Dollar currently. Only in specific pairs and specific setups we would choose to be bearish USD. In general the Dollar could continue to bounce higher this week. This bounce is considered selling opportunity. The material has been provided by InstaForex Company - www.instaforex.com |
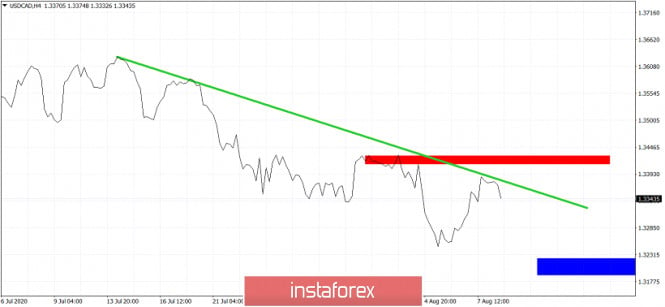
| Bearish short-term setup in USDCAD Posted: 10 Aug 2020 08:27 AM PDT USDCAD is trading at 1.3335 and we now prefer to be bearish as long as price is below 1.3420 looking for a move towards 1.32.
Red rectangle- stop loss Blue rectangle -target USDCAD is showing rejection signs at the green downward sloping resistance trend line. The medium-term trend remains bearish as price continues to make lower lows and lower highs. That is why any bounce is still considered as selling opportunity. This trade setup has a good risk reward as price is very close to resistance and our stop loss level around 1.34. Potential to the downside is more than 100 pips and as we explained in previous posts, USDCAD could continue lower towards 1.30. The material has been provided by InstaForex Company - www.instaforex.com |
| Brent and WTI diverged on opposite sides: oil prices fluctuate Posted: 10 Aug 2020 07:51 AM PDT
A surge on crude oil prices was noted on Monday morning after news that the US President, Donal Trump has signed a document ratifying a series of stimulus measures designed to bolster the country's economy. Moreover, Trump's decision was made bypassing Congress, which was never able to come to a consensus on the size of payments and their deliberate purpose, since the Democrats and Republicans did not manage to agree. The price of futures contracts for Brent crude oil with delivery in October on the trading floor in London has already jumped up on Monday by 1.10% or $ 0.49, which allowed the mark to move to the level of $ 44.89 per barrel. Bidding on the previous trading day ended in negative territory: Brent oil went down over the weekend by 1.5% or $ 0.69, and its price was at around $ 44.4 per barrel. On the contrary, the price of futures contracts for light crude oil of the WTI brand for delivery in September on the electronic trading floor in New York has significantly slid down declining by 1.46% or $ 0.6, and the price was $ 41.82 per barrel. It should be noted that Friday's trading also ended in the red zone: the price fell by 1.7% or $ 0.73, which forced it to move to the area of $ 41.22 per barrel. Positive news in the oil market on Monday is brought by an order from the US President, stating that an additional increase in unemployment benefits will again be paid to those who lost their jobs due to the coronavirus pandemic. However, its size will be slightly smaller than it was previously and will amount to $ 400 per week. The decree also states that 75% of these payments will come from the federal budget and only 25% will be financed by local authorities, that is, state governments. In addition to this long-awaited and exciting measure for investors, the order contains clauses according to which deferral of tax payments will be provided for employers on the salaries of those employees who have an income of less than $ 100 thousand per year. Moreover, the term of the still existing moratorium on loans for students has been extended, and the important part is that there is an indication of assistance to bona fide tenants of apartments and houses, as well as homeowners. The risky asset sector has strengthened today thanks to this news from the US, which makes one think that the black gold market will also feel significant support and will begin to strengthen in the coming days. The accepted stimulating payments, according to the US authorities, should have a positive effect on the economy of the state and at the same time provide good support to the citizens of the country. Among other things, participants in the oil market this week will closely monitor the situation in the negotiation process between the US and China. The talks will focus on, as analysts suggest, a trade agreement on Chinese energy imports. Recently, relations between the countries are very tense, acute conflict situations arise regularly. Therefore, investors cannot calmly ignore any agreements between the US and China that would hint at improving relations or, conversely, at the continuation of the conflict. The material has been provided by InstaForex Company - www.instaforex.com |
| Asian stocks traded positively, while European and US stocks showed irresolute dynamics Posted: 10 Aug 2020 07:51 AM PDT
Asian stock markets showed a positive attitude and increase positions Monday morning. Market participants were in good mood due to the news that the negotiation process on a trade agreement between the US and China had finally gotten off the ground. However, this is not an assurance that the tension has already ended. Last week, the US authorities continued their policy of imposing sanctions against Chinese officials. This time, the head of the Hong Kong administration and ten other officials of this province fell under the hot hand of the US government. Now the main problem for the markets is whether there will be retaliation from the Chinese authorities and whether this can harm the negotiations already scheduled for the end of this week. At the very least, investors will now follow the course of events with a particular bias, and any changes in this direction may lead to a change in the balance of power on the stock markets. Japanese trading floors were closed on Monday due to a national holiday, so it is worth evaluating the reaction here later. China's Shanghai Composite Index rose 0.9%. On the contrary, the Hong Kong Hang Seng Index felt the tension and went into the red zone declining 0.27% so far. Chinese statistics, however, are losing their previous positive. The inflation rate in the country for the second month of summer has changed upward. Growth reached 2.7% compared with 2.5% in June. Analysts' preliminary forecasts were also better than real data: an increase was expected to a maximum of 2.6%. The negative also affected the prices of Chinese manufacturers, which recorded a decline for the sixth time in a row. This time, the fall was 2.4% compared to the previous 3% level recorded in the first month of summer. It was assumed that prices will not fall by more than 2.5%, which was actually confirmed. South Korea's Kospi index went up by 1.42%. The Australian index grew even more by 1.87%. However, some warning signs still persist here. These include, in particular, an increase in the coronavirus mortality rate in one of the states in Australia which is Victoria. Over the past 24 hours, the number of deaths increased by 19, which cannot but worry the officials, since the epidemiological situation is far from stable. In this regard, the country's authorities are already saying that they are unlikely to be able to open the state's borders until Christmas, which is a rather significant factor of pressure on the markets. There was some confusion on the trading floors of the US on the last business day of last week. The Dow Jones and S&P 500 stock indicators closed in the green zone, while the Nasdaq unexpectedly began to correct downward. The Dow Jones Industrial Average was able to rise by 0.17% or 46.50 points, which allowed it to move to the level of 27 433.48 points. The Standard & Poor's 500 index was marked by a slight increase of 0.06% or 2.12 points, which moved it to the region of 3 351.28 points. The Nasdaq Composite index was the only one that showed negative dynamics declining by 0.87% or 97.09 points, which dragged it around 11,010.98 points. In general, over the past week, all indices were marked by growth. So, the most rapid rise was recorded in the Dow Jones amounting to 3.8%. The other two indicators, the S&P 500 and the Nasdaq gained 2.5% each. For the former, however, this has been a significant increase over the past few weeks. The main news that investors played here was related to incentive payments to citizens of the country. Recall that President Donald Trump had to sign a document bypassing Congress since Democrats and Republicans were never able to reach an agreement on this issue. In addition, the growing conflict between the US and China adds negative emotions to market participants. The sanctions against two well-known Chinese companies did not add any positive to the market. The sanctions measures against Hong Kong officials, which became known today, also do not help to raise investor sentiment. The statistics on the economic growth of the US slightly supported the mood of market participants. Thus, the statistics on its labor market, which came out on Friday, showed an increase of 1.763 million in the number of jobs in the state in the second month of summer. Meanwhile, the overall growth rate of this indicator began to decline. So, in June this year, a tremendous rise of 4.791 million was recorded, which became a new record. The unemployment rate in the United States in the second month of the summer was lower and reached 10.2% compared with the June level of 11.1%. At the same time, the preliminary data turned out to be somewhat more modest than the real ones: experts argued that there would be a decrease of no more than 10.5%. All this, of course, encourages investors, who continue to hope that the country's economy will be able to overcome the crisis associated with the coronavirus pandemic faster. However, good data on the unemployment rate and the number of jobs may stop officials from the next portion of the stimulus. At least, the very process of making this decision can be complicated. The country's government has more doubts about the need for new support measures against the backdrop of a fairly significant improvement in the situation in the country. Nevertheless, the regularity of officials may negatively affect the indicator statistics themselves in the future. Meanwhile, there was a multidirectional movement of the main stock indicators in the European stock market on Monday morning. Although positive news about the signing of a decree on support measures in the US provided support here as well. And the negative was provided by the continuation of the escalation of the conflict between Washington and Beijing. The general index of large enterprises in Europe Stoxx Europe 600 fell 0.07% and moved to the level of 363.31 points. In general, over the past week, it increased by 2%, which is a pretty good result. The German DAX index dropped 0.38%. The French CAC 40 index sank slightly by 0.07%. Also, Italy's FTSE MIB index did not drop too much, decreasing by 0.08%. However, there are indicators that, on the contrary, continued to grow: for example, the Spanish IBEX 35 index gained 0.24%, while the UK index increased by 0.09%. The material has been provided by InstaForex Company - www.instaforex.com |
| GBP / USD. Brexit delay may suggest potential growth for the pound Posted: 10 Aug 2020 06:54 AM PDT The pound against the dollar is currently trading in the wake of the USD, following the sentiment of the dollar bulls. The topic of Brexit has so far faded into the background, but it must not be overlooked categorically: as soon as the parties come to the key phase of the negotiation process, the behavior of the pound sterling will change dramatically. Unfortunately, not as much information comes from the fields of negotiations as we would like, nevertheless, it is still possible to draw certain conclusions regarding the prospects for a difficult dialogue. First, it is worth recalling that the "probationary period" that Boris Johnson defined for the negotiating group already expired at the end of July. Even at the end of winter, he said that by the middle of summer it would become clear whether there would be any sense from further negotiations or whether the country needed to prepare for other relations with the European Union (that is, to prepare for trade relations under the WTO rules). It's already August 10, but the British prime minister is in no hurry with such conclusions and does not recall the negotiating delegation. Moreover, the chief negotiator from the UK, Michael Gove said on Friday that the parties have made "some progress" and have taken another step towards a trade deal. Gove '
The parties accused each other of unwillingness to find a compromise, demonstrated peremptory adherence to principles and even hostility to each other. But the situation gradually began to level out, and the negotiators just as gradually began to smooth things over. The wording has become softer and the positions more flexible. As a result, information appeared on the market that Brussels might compromise in negotiations with London. According to Reuters, Europe may relax one of its key demands on Britain - the requirement to adhere to EU rules on state aid. According to unofficial information, Brussels is considering a dispute resolution mechanism that will allow London to fully control the cash injections and tax breaks for UK companies after a transition period at the end of this year. Thus, Britain will not have to adjust to EU requirements for a level playing field. It is worth noting that the provision of ensuring fair competition is the biggest stumbling block in the negotiations. Also recently, information appeared on the market that Brussels is ready to concede on another difficult issue - fishing. Let me remind you that the differences here were insurmountable. London considers the demands of the European Union to provide access for European fishermen to the British fishing areas unacceptable, calling this incompatible with the future status of the UK as an independent coastal state. Brussels, in turn, insists on the opposite. However, according to the British press, EU's chief negotiator, Michel Barnier is allegedly ready to back down here too. He proposed a model on the principle of "zonal attachment" - that is, the British shares of quotas will depend on the length of stay of fish populations in the UK waters. According to Brussels, this is also London's interest: with climate change, large volumes of fish will shift to the exclusive economic zone of Britain. In addition, according to journalists, Barnier backed down from the requirement to leave the EU ships the current level of access to UK waters. According to him, this policy was initially unbalanced, therefore it is subject to revision. In other words, the parties are clearly determined to find a compromise on the most important and difficult issues. Therefore, the "deadline" set by Boris Johnson passed unnoticed - the negotiating group continued its work, and Johnson took a wait-and-see attitude. Moreover, at the end of last week, UK Treasury Secretary Rishi Sunak announced that a trade deal between the UK and the European Union could be concluded as early as September.
Thus, the situation with Brexit looks quite promising: at least the latest information signals are positive. The parties demonstrate negotiability, and Boris Johnson is no longer voicing aggressive theses against Brussels. Therefore, if we consider the long-term time period, then short positions on the GBP/USD pair cannot be called reliable. As soon as a more or less tangible date for the conclusion of a trade agreement appears on the horizon, the pound will go up, regardless of how the dollar is feeling. Judging by the statements of the representatives of Britain and the EU, this may happen relatively soon, in a few weeks. Taking into account such a fundamental background, here we can consider a long game: on downturns in GBP/USD, enter purchases by investing in the pound sterling. But I repeat - we are talking about long-term positions since in the medium term and (even more so) in the short term, the pound will follow the dollar, which reacts quite sharply to political battles in the United States (especially after Trump signed four decrees on the provision of assistance to unemployed Americans). But in the long term, you can open long positions at the base of the 29th figure (the upper border of the Kumo cloud on the weekly chart) with an upward target at 1.3190 (the August price high, which was also tested (unsuccessfully) in March and February). The material has been provided by InstaForex Company - www.instaforex.com |
| Gold and silver: how long precious metals may grow? Posted: 10 Aug 2020 06:08 AM PDT
July was the most profitable month for gold. The precious metal grew by 11% in a month. Since the beginning of August, gold has already surged 3.5%. Silver is not far behind. Although it costs less than gold, silver comes first in terms of profitability. Since the beginning of this year, silver has risen by almost 53%. So, analysts of the largest investment banks say that the cost of gold in the future will reach $3,000. But how long will precious metals rise in price? In theory, there is no limit for growth. Gold and silver can grow indefinitely if all currencies in the world are devalued. However, growth is always followed by a fall. There is no one doubt that the price of gold will continue to rise if the yield on the US government bonds continues to approach zero. The longer gold and silver grow, the more likely low-quality investment proposals based on precious metals (derivatives) will appear. Also, do not forget that if the global financial crisis worsens, a selling process will begin on the stock exchanges. Traders will want to take profit and will sell all liquid assets. This happened at the beginning of the coronavirus pandemic. Today, the price of gold fell by 0.18% to $2,030.95 per troy ounce. This was caused by the strengthening of the US dollar amid the US labor statistics. CMC Markets analyst Michael Hewson noted that gold may continue to fall as investors are taking profit, but the precious metal is still attractive. Moreover, on August 15, important trade negotiations between the US and China will take place. The relations between the countries have worsened after Donald Trump banned US deals with China's ByteDance, the owner of the TikTok video app, and Tencent, the operator of the WeChat messenger. Investors are watching with concern the new aggravation of relations between the countries. The outcome of the negotiations may affect the US dollar rate. By the way, palladium rose by 0.19% to trade at $2,180.48 per ounce, while silver grew by 0.1% to $28.32 per ounce. Platinum also rose by 1.31% to $974.27 per ounce. The material has been provided by InstaForex Company - www.instaforex.com |


| You are subscribed to email updates from Forex analysis review. To stop receiving these emails, you may unsubscribe now. | Email delivery powered by Google |
| Google, 1600 Amphitheatre Parkway, Mountain View, CA 94043, United States | |
No comments:
Post a Comment