
Forex analysis review |
- Hot forecast and trading signals for the GBP/USD pair on August 18. COT report. Completely calm on Monday. Traders waiting
- Hot forecast and trading signals for the EUR/USD pair on August 18. COT report. Washington is considering new ways to pressure
- Overview of the GBP/USD pair. August 18. Scotland and Northern Ireland are increasingly hinting at their exit from the UK.
- Overview of the EUR/USD pair. August 18. The US dollar has no reason to get more expensive, except for technical reasons.
- EUR/USD. Dollar bulls worry: Washington's anti-China moves and Trump's rating
- Analytics and trading signals for beginners. How to trade the EUR/USD pair on August 18? Analysis of Monday trades. Preparation
- Evening review 08/17/2020. EURUSD. Euro keeps growing
- August 17, 2020 : EUR/USD Intraday technical analysis and trade recommendations.
- USD unlikely to change trend as major players betting on its weakness
- August 17, 2020 : GBP/USD Intraday technical analysis and trade recommendations.
- August 17, 2020 : EUR/USD daily technical review and trade recommendations.
- Commodity-related currency pairs AUD/USD, USD/CAD, and NZD/USD on 4-hour charts. Complex analysis of APLs & ZUP scenarios
- GBP/USD: plan for the American session on August 17
- EUR/USD: plan for the American session on August 17
- Analysis of GBP/USD on August 17. Wave markup looks "like a textbook", however, the news background from America can spoil
- Analysis of EUR/USD on August 17. It will be extremely difficult for the US dollar to rise due to the pandemic and contradictions
- Oil to hit $60 per barrel
- US stimulus package agreement conflict drags dollar further down
- The pound had a weak opponent
- EUR / USD: Dollar's decline slows down, euro positions look shaky
- BTC analysis for August 17,.2020 - Key pivot at the price of $11.950 on the test
- Asia, Europe, and US stock markets observed multidirectional dynamics
- EUR/USD analysis for August 17 2020 - First upward target from Friday at the price of 1.1865 has been reached. Next upward
- Analysis of Gold for August 17,.2020 - Watch for the breakout of the inside day to confirm further directon
- USD/JPY. Calm yen ignored the failed data on Japan's GDP growth
| Posted: 17 Aug 2020 06:39 PM PDT GBP/USD 1H The GBP/USD currency pair continued to trade in a very narrow price range on August 17, by only a few dozen points. So Monday was really very boring. Traders rested all day without even trying to trade the pair. As a result, the quotes moved flat even inside the side channel. In recent days, the pound/dollar pair does not even try to approach the upper or lower line of the side channel. In general, a complete calm. Thus, there is no movement with a certain direction even inside the side channel, which makes it difficult to trade even on the smallest timeframes. Based on this, we believe that the best option at this time is to wait for the flat to end and the resumption of the trend movement. GBP/USD 15M Both linear regression channels are directed upwards on the 15-minute timeframe, but the lower channel eloquently shows how volatile trading is now and where the pound/dollar pair is mainly moving. The latest Commitment of Traders (COT) report for the British pound, which was released on Friday, turned out to be almost an exact copy of the report on the euro currency. As for the euro, big traders opened new Buy-contracts (2,569) in the reporting week and closed Sell-contracts (8,405). Thus, the net position for non-commercial traders increased by almost 11,000 during the reporting week, which, in fact, means an increase in bullish sentiment. We could draw the same conclusions based on the nature of the movement of the pair itself. Given the fact that we have not seen even a normal correction of the British pound for several weeks, we can make a clear conclusion that big traders are not selling this currency now. Therefore, even the COT report does not yet suggest the beginning of a new downward trend. At the same time, the new week started with extremely weak movement. Have professional traders decreased their activity? The fundamental background for the GBP/USD pair was simply absent on Monday. Based on the nature of the pair's movement during the day, one could draw this conclusion without even looking at the calendar of macroeconomic events. Unfortunately, the situation with the fundamental background is unlikely to change today, because the news calendar is still empty. There is almost no news even on broad fundamental topics at the moment. There are rumors that Washington is going to use more serious weapons in the "cold war" with China, but it has not yet reached the point of actions and direct threats to use new "weapons". The whole world could already enjoy the trade war between China and the United States, which plunged the world economy into recession. As for the UK, there is generally a news calm. Several macroeconomic reports were published last week, which, however, also did not help the pair finish flat, and traders decided which way to trade. There are two main options for the development of events on August 18: 1) Buyers in general continue to hold the pound/dollar initiative in their hands. We recommend opening new purchases of the British currency, but not before the 1.3157-1.3181 area has been overcome with targets at the resistance levels of 1.3213 and 1.3284. Potential Take Profit in this case is from 20 to 90 points. You can also try to buy the pound when the price rebounds from the Kijun-sen, but this signal will be weak. 2) Bears have already failed to overcome the support area 1.3003-1.3023 five or six times. Thus, consolidating the price below the Kijun-sen line (1.3067) will allow us to expect the price to fall in this area. Each trader has to decide for himself whether to reject this signal or not, since the pair as a whole remains in a flat. We do not see the pair below the 1.3003 level yet, but if this level is overcome, we recommend opening sells with targets at 1.2939 and 1.2873. Hot forecast and trading signals for the EUR/USD pair. We also recommend that you study the fundamental background in these articles: Overview of the EUR/USD pair. August 18. The US dollar has no reason to get more expensive, except for technical reasons. Donald Trump is reducing the gap from Joe Biden by several percent. Overview of the GBP/USD pair. August 18. Scotland and Northern Ireland are increasingly hinting at their exit from the UK. The British economy will continue to experience problems in 2021. Explanations for illustrations: Support and Resistance Levels are the levels that serve as targets when buying or selling the pair. You can place Take Profit near these levels. Kijun-sen and Senkou Span B lines are lines of the Ichimoku indicator transferred to the hourly timeframe from the 4-hour one. Support and resistance areas are areas from which the price has repeatedly rebounded off. Yellow lines are trend lines, trend channels and any other technical patterns. The material has been provided by InstaForex Company - www.instaforex.com |
| Posted: 17 Aug 2020 06:38 PM PDT EUR/USD 1H. The euro/dollar pair continued its upward movement on the hourly timeframe of August 17, which began after the rebound from the Kijun-sen and Senkou Span B lines since the macroeconomic and fundamental backgrounds were practically absent on this day, the trading was calm, without sharp and strong movements. The pair reached the resistance area of 1.1886-1.1910 by the end of the trading day, near which its future fate will now be decided. If a rebound occurs from it, then the fall will resume within the side channel of $1.17-$1.19 while aiming for its lower border. The upward trend may resume if buyers finally gather their strength and overcome this area. EUR/USD 15M Both channels of linear regression are still directed upwards on the 15-minute timeframe, as the mood of traders did not change on Monday. A new Commitment of Traders (COT) report was released last Friday. According to this report, non-commercial traders reopened Buy-contracts and closed Sell-contracts. Thus, the net position for the "non-commercial" category of traders, which is the most important and significant category of traders, has grown again, this time by 15,000 contracts, which is a high value (5,128 Buy-contracts were opened and 9,681 Sell-contracts were closed). This leads to the conclusion that big traders have not changed their mood at all over the past week. In principle, the same conclusion can be drawn by looking at the chart of the euro/dollar currency pair itself. The pair has been in the side channel since July 27, which is three weeks ago. Thus, we can not even say that the euro has started to fall in price, which would allow us to conclude that the mood of the major players has changed. During all this time, traders managed to adjust the pair by a maximum of 200 points down, which is very little to be reflected in the COT report. Thus, the euro continues to rise in price, and the COT reports show a strengthening bullish mood. There was no fundamental background for the EUR/USD pair on Monday. Traders had only to reason and analyze common fundamental topics, one of which is the US-China confrontation. According to the latest information, Washington may resort to new methods of pressure on Beijing, including a ban on Chinese banks' access to the international money transfer system centered in New York; restricting the access of Chinese companies to the SWIFT system of international transfers, which is formally Belgian, but according to some sources is subject to Washington; prohibiting any US financial entity from interacting with Chinese companies. Thus, the United States is considering new ways to influence China, which has become the source of the spread of the coronavirus around the world, because of which the American economy suffered the greatest losses. Also, the Chinese side is in no hurry to start talks on the second phase of the trade deal and, according to some reports, does not fully comply with all the agreements under the January agreement. Beyond that, Beijing clearly wants Joe Biden to win the November election, further enraging US President Donald Trump. In general, the confrontation between Beijing and Washington continues to heat up. Based on the above, we have two trading ideas for August 18: 1) Buyers continue to wait and do not force events. To make new purchases of the euro,you are advised to wait until the price settles above the resistance area of 1.1886-1.1910. Then we will recommend buying the pair with the first target at the resistance level of 1.1958. In this case, the potential Take Profit is about 30 points. The next target is 1.2051, but with current levels of volatility and buying activity, it is not known when this level will be reached. 2) Bears continue to experience big problems and cannot go below the 1.1715 level. We recommend opening sales after breaking through the support area of 1.1702-1.1727 with the first target at the 1.1652 level. Potential Take Profit in this case will be about 30 points. If the price rebounds from the resistance area of 1.1886-1.1910, you can also open shorts with the targets of the Senkou Span B line and the 1.1715 level. In this case, Take Profit is from 60 to 100 points. Hot forecast and trading signals for the GBP/USD pair. We also recommend that you study the fundamental background in these articles: Overview of the EUR/USD pair. August 18. The US dollar has no reason to get more expensive, except for technical reasons. Donald Trump is reducing the gap from Joe Biden by several percent. Overview of the GBP/USD pair. August 18. Scotland and Northern Ireland are increasingly hinting at their exit from the UK. The British economy will continue to experience problems in 2021. Explanations for illustrations: Support and Resistance Levels are the levels that serve as targets when buying or selling the pair. You can place Take Profit near these levels. Kijun-sen and Senkou Span B lines are lines of the Ichimoku indicator transferred to the hourly timeframe from the 4-hour one. Support and resistance areas are areas from which the price has repeatedly rebounded off. Yellow lines are trend lines, trend channels and any other technical patterns. The material has been provided by InstaForex Company - www.instaforex.com |
| Posted: 17 Aug 2020 05:35 PM PDT 4-hour timeframe Technical details: Higher linear regression channel: direction - upward. Lower linear regression channel: direction - upward. Moving average (20; smoothed) - sideways. CCI: 100.3660 If the European currency is even in a side channel, then at least it is traded between its upper and lower borders, regularly working them out, then the pound sterling is traded in different directions even within the day. All its movements are similar to confusion and chaos, but in no way to calm trading, even in the flat. At the moment, the pound/dollar pair is fixed above the moving average line, but the last three attempts to overcome the Murray level of "6/8" - 1.3123 ended in failures. But the Murray level of "6/8" is not even the upper limit of the side channel, in which the pair has been trading for a month and a half. Thus, it is now completely unclear what market participants think at all, especially the major players who drive all the instruments. And this is especially true for non-profit traders, who are the most important group of large traders. As shown by the latest COT report, this group continues to invest in the British currency, but the size of these investments is not yet enough to continue the upward trend. Moreover, we have repeatedly drawn the attention of traders to the fact that, from a fundamental point of view, the pound sterling does not have such a big advantage over the US dollar (in contrast to the same Euro currency). And given that the pound has already risen in price in a pair with the dollar by 8 cents and there has not been a single significant correction for all this time, the probability of the pair going down, we would say, is now very high. It turns out that market participants have already played back all the negative fundamental background that has been coming from overseas for several months. But it is not possible to constantly sell the dollar for the same reasons. There are no new reasons. As for the British fundamental background, we see a paradoxical situation here. All traders forgot that the economic situation in the Foggy Albion is not much better than in the States. First, of all the European countries, the UK is the country that suffered the most from the first "wave" of the "coronavirus". Second, the British economy has been slowing and shrinking for four years because of Brexit. Third, London has not signed any trade agreements with America, the European Union, or anyone else. Fourth, even negotiations on a trade agreement are not going on with anyone (the EU can no longer be considered, despite the tons of optimism expressed by both sides). Fifth, Boris Johnson is now generally unclear what he is doing, since there is no information about this. The British Prime Minister was due to travel to Brussels in person at the end of July to hold talks with EU leaders. However, it seems that he decided to follow the most famous motto of Donald Trump: "My word, I want - I give it, I want - I take it back." So what happens? It turns out that the British economy lost 20% in the second quarter, and in 2021 it will be dealt another blow in the form of a complete break of all ties and agreements between British and European companies. The new trade agreement between Britain and the Alliance is already "fantastic". Accordingly, recovery from the "coronavirus crisis" will be long and difficult, complicated by new "kicks". Moreover, Britain may lose Northern Ireland and Scotland in the future. What is happening now in Belarus, what has previously happened in Ukraine and in many other countries before, clearly shows that if people do not like something, they express it from time to time. When the "boiling point" is passed, they will take to the streets and fight for the right to live as they want, and not as they are forced to. This is exactly what can happen in civilised Northern Ireland and Scotland. Edinburgh has long been telling London that it wants to hold a second independence referendum. After this, Prime Minister Nicola Sturgeon is confident of a positive outcome, the country will want to return to the European Union, from which it did not want to leave initially. In Northern Ireland, which has long been in conflict with the British authorities, separatist sentiments and national organizations have always flourished, which, as history shows, can fight for their ideas and beliefs for years. And if the economic situation due to Brexit and the lack of a deal with the EU deteriorates even more in these countries, then a direct confrontation with London may begin. Boris Johnson and Michael Gove just recently visited Scotland and Ireland with financial aid packages for local companies. However, the assistance is provided in the form of loans, not "new year's gifts". But still. Many sources note that London is afraid of losing these two regions. Moreover, the European Union has just recently shown the UK all the advantages of being part of it. "Coronavirus" hurt all European States, but the EU government has accepted an unprecedented package of assistance for 750 billion euros, 2/3 of which will be distributed by grants, that is, free of charge. Moreover, a number of bills aimed at implementing reforms in the fields of energy and finance were adopted, which would hardly be approved by the UK. Thus, it turns out that the EU has become even stronger with the departure of Britain. It should also be recalled once again that it is Britain that is more dependent on the EU, and not vice versa. Moreover, the Scottish government was much better at dealing with the pandemic itself than the British government, because it made its own decisions and did not follow London's lead. Northern Ireland shows an open desire to rejoin Ireland and does not want to have a border, customs and other bureaucratic issues between them. And the more such disputes and disagreements arise, the more likely it is that the discontent of the inhabitants of these countries will one day "overflow". Then Great Britain will feel for itself what it means when the people are forced to live as they do not want to. The Brexit referendum was devastating from the start. The margin of 3-4% had to be declared insufficient in order to start the procedure of leaving the European Union. 52% were in favor and 48% were against. This means that almost half of the British population is actually forced to leave the EU and live worse than before. The average volatility of the GBP/USD pair is currently 78 points per day. For the pound/dollar pair, this value is "average". On Tuesday, August 18, thus, we expect movement within the channel, limited by the levels of 1.3032 and 1.3188. A downward turn of the Heiken Ashi indicator will indicate a new round of downward movement inside the side channel of 1.3000-1.3180. Nearest support levels: S1 – 1.3092 S2 – 1.3062 S3 – 1.3031 Nearest resistance levels: R1 – 1.3123 R2 – 1.3153 R3 – 1.3184 Trading recommendations: The GBP/USD pair on the 4-hour timeframe is located inside the side channel and is currently moving up. Thus, at this time, it is recommended to either trade the pair between the boundaries of the side channel of 1.3000-1.3180 or wait for the end of the flat. The material has been provided by InstaForex Company - www.instaforex.com |
| Posted: 17 Aug 2020 05:35 PM PDT 4-hour timeframe Technical details: Higher linear regression channel: direction - upward. Lower linear regression channel: direction - upward. Moving average (20; smoothed) - sideways. CCI: 125.2834 The EUR/USD currency pair continues to trade in a side channel with a width of approximately 200 points and does not even try to leave the specified range. In recent days, the pair's quotes have been held slightly above the moving average line, however, they have not yet managed to even approach the upper line of the side channel. Thus, trading is now ultra-quiet. None of the currencies has advantages, just as neither bulls nor bears have it. Unfortunately for traders who clearly would like to conduct active trading, and not sit in the flat, the entire macroeconomic background of the previous week, in fact, was ignored. Recently, there were quite a lot of important macroeconomic indicators both in the European Union and in America, but none of them managed to force the pair to leave the range of $ 1.17 - $ 1.19. Also, the situation is now called "some can't, others don't want to". We have already written about this. Buyers now do not want to make new purchases, since there are no new fundamental reasons for this. And sellers still do not want to invest in the dollar, because there is no reason to do so for several months. So it turns out that the euro/dollar pair is just marking time in one place. Unfortunately, again for the US dollar, even macroeconomic statistics cannot support this currency now. Despite the fact that quite a large number of different reports have been published in America recently, the first place was the GDP report, which showed a drop of 33%, which has never been seen in the history of the United States. After these numbers, all reports like inflation (which has increased) or industrial production, did not matter much to traders. Even the report on NonFarm Payrolls, which exceeded forecasts, did not cause traders much optimism. The situation in the European Union is much better now. First, GDP in Europe fell by only 12%. Secondly, this country has managed to contain the coronavirus pandemic in at least some countries, at least for a few months. Although now there is again a fairly high number of cases in Spain and France (5-10 thousand daily), it is still not 50-60 thousand cases in America every day. In many EU countries, the coronavirus is under control, which has a positive impact on the pace of economic recovery. Plus, the European Union still adopted the budget for 2021-2027, as well as the economic recovery fund for 750 billion euros, and in the States, the Democrats and Republicans have been arguing for about a month on a new package of economic assistance and have not come to anything, because any actions by either side now pass through the prism of elections, which are less than 3 months away. Thus, the US government leadership continues to think more about how to win elections, rather than how to agree among themselves and mitigate the impact of the crisis on Americans and small and medium-sized businesses. By the way, about the election. Quite unexpectedly, this weekend we received information that the political ratings of Donald Trump began to grow, but the ratings of Joe Biden – to decline. This was stated on Sunday by CNN. According to him, if the vote was held now, Trump would have won 46% of the vote, and Biden – 50%. That is, the gap is only 4%, not 10%, as it was a few weeks ago. It is difficult to say how true this opinion poll is, since previously almost all studies and simulations showed that Biden would win with a probability of almost 90%. Now it turns out that the probability is already somewhere 40 to 60, and such a rapid change in the mood of the electorate can not even be associated with any event in the United States. After all, the vaccine against "coronavirus" has not yet been invented by American companies, mass protests and rallies continue in some US cities, the epidemic itself will continue to spread among Americans, and Americans themselves continue to die from the "Chinese virus". Moreover, he did not de-escalate the conflict between China and the United States, did not ease the tension between Democrats and Republicans, Trump did not stop making unfounded statements, accusations, and the economic situation in the country did not improve. So, on what basis did Trump's ratings begin to rise? We believe that the results of this study are erroneous. It is reported that only about 1,100 people took part in the telephone survey, so the margin of error for such a small sample may be 5-10%. Thus, most likely, the gap between Trump and Biden has decreased, if at all, then by 1-2 % at most. Based on all the above, we believe that the flat can continue for as long as you want, because it is difficult to imagine what fundamental or macroeconomic event can bring the pair out of the side channel. We have realized that even the all-important GDP data and US and EU are not able to bring a pair of flat, as fundamental events are now a very small number and the vast majority of them is only a background influence. In other words, market participants do not immediately respond to these events by buying or selling. They form the fundamental background, according to which trade is conducted in general. And for the US dollar, nothing changes for the better here. Thus, the fact that this currency has at least stopped depreciating against the euro is already good. However, we still tend to believe that a downward correction will begin (we mean at least a relatively strong downward correction). At the same time, we continue to put technical factors first. Therefore, before overcoming the level of 1.1909 (the upper line of the channel), we do not recommend considering the option of resuming the upward trend. It is the same as considering the option with a downward trend to overcome the level of 1.1710. Therefore, in the current conditions, market participants can either be "on the fence", or trade between the upper and lower lines of the side channel, or trade relative to the moving average line. However, it is always difficult to trade in the flat, so we recommend that you be extremely careful when opening any positions. The volatility of the euro/dollar currency pair as of August 18 is 79 points and is characterized as "average". Thus, we expect the pair to move today between the levels of 1.1790 and 1.1948. The reversal of the Heiken Ashi indicator downwards signals a turn of the downward movement within the side channel of 1.1719-1.1911. Nearest support levels: S1 – 1.1841 S2 – 1.1719 S3 – 1.1597 Nearest resistance levels: R1 – 1.1963 Trading recommendations: The EUR/USD pair continues to trade near the sideways moving average, which indicates a flat. Thus, at this time, it is recommended to either trade between the borders of the side channel based on the signals of the Heiken Ashi indicator or wait for the end of the flat and the resumption of the trend movement. The material has been provided by InstaForex Company - www.instaforex.com |
| EUR/USD. Dollar bulls worry: Washington's anti-China moves and Trump's rating Posted: 17 Aug 2020 02:49 PM PDT "Trump is playing the war card": a similar phrase can illustrate the events of recent days. However, we are still talking about a trade and diplomatic war, which, in fact, has been going on for years. But recently, the political conflict between the United States and China has increasingly acquired a "commercial" color. The market reacts accordingly: protective assets (yen, gold, franc) grow in price, the dollar continues to lose its position. Previously, the US currency was also used as a safe haven currency, but now the situation has changed: the greenback is under the weight of its own problems, including domestic political ones. Therefore, the buyers of the EUR/USD pair also get their benefit in this case. Here, the pair's growth is due only to the dollar's weakness, but this is quite enough for the bulls to keep the situation under control. What happened? The trade conflict between the US and China has been going on for several years – almost as long as Trump has been in charge of the White House. The months-long talks were repeatedly disrupted, rescheduled, and resumed again. As a result, the parties agreed on the first phase of the trade deal in the fall of 2019, thus preventing the development of a trade war. Washington has pledged not to impose so-called "December duties" on Chinese imports worth $160 billion a year. Beijing, in particular, has pledged to increase the volume of purchases of American goods. A kind of "thaw" occurred in relations between the United States and China, which lasted until the coronavirus pandemic. To be more precise, relations between the superpowers finally soured when the Americans accused the PRC of spreading COVID-19 – US President Donald Trump now calls the coronavirus nothing less than"the Chinese plague". Since then, Beijing and Washington have been exchanging recriminations and accusations of various kinds. For example, in late July, US Secretary of State Mike Pompeo accused China of spying and stealing American intellectual property, demanding the closure of the Chinese Embassy in Houston. A little later there were also retaliatory measures from the PRC: Beijing has demanded to close the US Embassy in the Chinese city of Chengdu. Despite political differences, the parties are fulfilling the terms of the trade agreement - or rather, the first part of this deal. Therefore, traders hoped that in spite of loud conflicts, negotiations on the second part of the trade deal would take place as usual. There were certain prerequisites for this: for example, a video conference was planned for this Saturday, during which the negotiators had to outline the trajectory of further prospects. But the video conference did not take place: it was postponed "for an indefinite period" without explanation. This turn of events disappointed dollar bulls. The fact is that the most difficult and strategically important issues will be discussed by the parties precisely within the framework of the second phase of talks (if they take place at all). According to some reports, the Chinese are counting on a change of power on the American political sphere. Trump has repeatedly put pressure on the PRC, threatening to tighten the terms of the deal if he is re-elected. Many forgot about this circumstance, as the representatives of the Democrats, according to polls, bypassed the incumbent president. In early summer, Biden was ahead of Trump by about 15%, amid the coronavirus crisis. But the latest ratings no longer speak of Joe Biden's unequivocal leadership. According to the latest polls, Biden's rating is on average at 49% in 15 key states of the country, while Trump's rating is 48%. Trump has significantly reduced the lead over his opponent, and this fact has alarmed many investors. Especially against the backdrop of the strengthening of anti-Chinese rhetoric on the part of the US president. For example, Trump today admitted that, following ByteDance, which owns the TikTok service, other Chinese companies operating in the United States may be at risk. When asked by journalists about whether the authorities plan to impose restrictions on Alibaba, the Trump did not rule out such an option, adding that his administration is "considering such a scenario." In addition, the United States expanded sanctions against Chinese Huawei: Washington imposed restrictive measures against 38 subsidiaries of this company. The Department of Commerce has also extended the amendments under which foreign companies using US-made chip-making equipment must obtain a US license before supplying certain chips to Huawei. The announced sanctions are just the tip of the iceberg. Before that, there was the Hong Kong issue, sanctions for oppressing Uighur rights in China, coronavirus charges, and charges of espionage. That is, on the one hand, Trump is strengthening anti-Chinese rhetoric, and on the other hand, he is strengthening his position in the US electoral field. And all this just three months before the presidential election. The news of the disrupted US-Chinese talks was an eloquent illustration of the situation. How to trade? The main beneficiaries of investor anxiety were the yen, the franc and gold. The euro-dollar pair is growing only due to the dollar weakening. Compare, for example, the dynamics of USD/JPY and EUR/USD. Actually, it is difficult to call it growth – the European currency only stays above the resistance level of 1.1810 (the Tenkan-sen line on the daily chart). Theoretically, this allows EUR/USD bulls to approach the nearest resistance level of 1.1900 and the main resistance level of 1.1940 (the upper line of the BB indicator on D1). Buyers still do not have enough news momentum for a price jump, while the dollar's sluggishness will not go far - even to the borders of the 19th figure. But all the prerequisites for the pair's growth are there – at least in the context of testing the 1.1900 mark. Therefore, long positions on EUR/USD remain a priority in the medium term. The material has been provided by InstaForex Company - www.instaforex.com |
| Posted: 17 Aug 2020 02:45 PM PDT Hourly chart of the EUR/USD pair. The EUR/USD currency pair, after overnight trading, which continued the upward movement within the upward trend (upward trend line) since Friday, still began a downward correction, having previously reached the 1.1865 level, which is the first target for buying on Monday, August 17. Novice traders could close buy trades near the 1.1865 level and make a profit of about 50 points, or they could close them on the MACD indicator signal for a correction and make a profit of about 25 points, which is not so little for intraday trading. However, a few hours later, the MACD indicator performed an upward reversal again, but this reversal took place near the end of the day, so each trader decided for himself whether to open new positions overnight. !!! Important: the signal line of the MACD indicator and the histogram have more accurate numeric values than displayed on the chart. If you hover the mouse over any bar, you can see the exact numeric value of both the signal line and the histogram bar. In other words, this indicator can generate a reversal signal earlier than it will be shown on the chart (the signal line and the histogram may coincide, but in fact the reversal occurred). From a fundamental point of view, traders had nothing to pay attention to on Monday. No important news released in the media and online publications, and no important macroeconomic reports were released. Thus, novice traders only needed to analyze the readings of technical indicators today. No macroeconomic reports on August 18, Tuesday. Instead, you are advised to track news feeds for news from US President Donald Trump and other top US officials, as well as just important people like Anthony Fauci. But in general, trading on Tuesday will most likely be extremely calm and "purely technical". Accordingly, as long as the price continues to be located above the upward trend line, novice traders are advised to only consider purchases. Given the proximity of the 1.1903 level, we believe that the pair may start attempting to move down and start going towards 1.1696 in the near future. Settling below the trend line will confirm this. Beginners can start looking for sales signals only after this point. If the price settles above the 1.1903 level at the end of the next hour, this will seriously increase the chances of a further upward movement of the pair and will allow further consideration of purchases of the euro currency. The following scenarios are possible: 1) Buying the pair at this time continues to be relevant, as the price continues to be above the upward trend line. Thus, at this time, we recommend that novice traders wait for a new round of a downward correction, after which, expect a new reversal of the MACD indicator upwards in the area of the next morning. We also remind you that a downward reversal is very likely near the upper line of the sideways channel, that is, near the 1.1903 level. 2) Selling the currency pair is temporarily irrelevant, since the price is above the trend line. We suggest novice traders to close the price at the end of the hour under the trend line, in this case, it will be possible to consider a drop in quotes to 1.1696 through the intermediate goals of 1.1797 and 1.1756, which you are advised to reach. What's on the chart: Support and Resistance Levels are the levels that serve as targets when buying or selling the pair. You can place Take Profit near these levels. Red lines are the channels or trend lines that display the current trend and show in which direction it is preferable to trade now. Up/down arrows show where you should sell or buy after reaching or breaking through particular levels. The MACD indicator consists of a histogram and a signal line. When they cross, this is a signal to enter the market. It is recommended to use this indicator in combination with trend lines (channels and trend lines). Important announcements and economic reports (you can always find them in the news calendar) can seriously influence the trajectory of a currency pair. Therefore, at the time of their release, it is recommended to trade as carefully as possible or exit the market in order to avoid a sharp price reversal. Beginners in the Forex market should remember that not every single trade should be profitable. The development of a clear strategy and money management are the key to success in trading over a long period of time. The material has been provided by InstaForex Company - www.instaforex.com |
| Evening review 08/17/2020. EURUSD. Euro keeps growing Posted: 17 Aug 2020 02:08 PM PDT EURUSD: Euro cannot break above the level of 1.1900. But it keeps growing. We keep buying from 1.1810. In case of a complete reversal down, sell from 1.1710. The material has been provided by InstaForex Company - www.instaforex.com |
| August 17, 2020 : EUR/USD Intraday technical analysis and trade recommendations. Posted: 17 Aug 2020 09:04 AM PDT On March 20, the EURUSD pair has expressed remarkable bullish recovery around the established bottom around 1.0650. Shortly after, a sideway consolidation range was established in the price range extending between 1.0770 - 1.1000. On May 14, evident signs of Bullish rejection as well as a recent ascending bottom have been manifested around the price zone of (1.0815 - 1.0775), which enhances the bullish side of the market in the short-term. Bullish breakout above 1.1000 has enhanced further bullish advancement towards 1.1150 then 1.1380 where another sideway consolidation range was established. Hence, Bearish persistence below 1.1150 (consolidation range lower limit) was needed to enhance further bearish decline. However, the EURUSD pair has failed to maintain enough bearish momentum to do so. Instead, the current bullish breakout above 1.1380-1.1400 has lead to a quick bullish spike directly towards 1.1600 (Fibonacci Expansion 78.6% level) which failed to offer sufficient bearish pressure. That's why, further bullish advancement pursued towards 1.1730 (Fibonacci Expansion 100% level) which failed to offer sufficient bearish rejection for a few days until Today. Bullish persistence above 1.1730 will probably favor further bullish advancement towards 1.2075 (161% Fibo Expansion Level) in the intermediate-term. On the other hand, bearish re-closure below 1.1730 indicates lack of bullish momentum and enhances further bearish decline initially towards 1.1600. Trade recommendations : Conservative traders should wait for the current bullish movement to pause and get back below 1.1730 as an indicator for lack of bearish momentum for a valid SELL Entry.T/P levels to be located around 1.1600 and 1.1500 while S/L to be placed above 1.1800 to minimize the associated risk. The material has been provided by InstaForex Company - www.instaforex.com |
| USD unlikely to change trend as major players betting on its weakness Posted: 17 Aug 2020 08:59 AM PDT With the increasing uncertainty in the markets, the US stock indices failed to continue the uptrend. Given that stock futures of major world indices are holding near record highs, and there are no new drivers for further growth, the bullish momentum may soon lose its steam. The US dollar is unlikely to rebound anytime soon amid a number of negative factors. First of all, traders are disappointed by the economic statistics and, in particular, by the data on the US economy. Thus, retail sales in July fell short of estimates. Due to the increase in COVID-19 cases, this indicator may drop even further. The downbeat data on consumer activity signals that the US economic recovery has slowed down. In addition, US lawmakers still have not reached an agreement on a new stimulus package to support the US economy. Now, lawmakers in Congress have left for August recess without a deal for the next coronavirus relief package. So, the negotiations are put on halt until September. This stalemate in the US fiscal policy puts additional pressure on the American currency. Moreover, the uncertainty around US-China trade relations serves as another bearish factor for the dollar. The meeting on a trade deal, which was scheduled for August 15, was postponed without confirmation of a new date. Meanwhile, Donald Trump issued an executive order forcing Chinese company ByteDance to stop its US TikTok business activity within 90 days. He also made it clear that similar measures could be applied to other Chinese companies, including Alibaba. Further escalation of tensions between the two economic giants is causing concern among investors. The US-China trade conflict is sure to affect the pace of global economic recovery, including the one of the US. Currently, Democrats and the Trump's administration have a conflicting view on a number of issues. One of them is voting by mail, which is strongly opposed by Donald Trump. Democrats fear that this will put pressure on the postal service. There were suggestions to call the lawmakers back from summer leave in order to avoid cuts in postal service funding. This week, investors will be closely watching the dollar index trajectory. The downtrend in the US currency is going on for the fifth session in a row, and the greenback is at risk of testing the mark of 92.47, the lowest level in 2.5 years. On Monday, the downward short-term trend in the US currency strengthened. In the long term, the upward trend may start at 92.85. All this time, DXY has been holding firmly near this level. However, today during the New York session, the dollar broke through it. Currently, it is not the best strategy to rush with long positions on the US dollar, at least for now. There has been a noticeable change in how Forex speculators are placing positions. They continue to bet further on the euro's rise at the expense of the US dollar. Thus, the net position of hedge funds in USD futures fell significantly. The last time when major players were net short on the US dollar was two years ago. The American currency came under pressure in late March when the Fed promised unlimited liquidity to support the economy hit by the coronavirus. Since then, the greenback has been depreciating due to low interest rates and the fall in 10-year Treasury yields to record lows. The material has been provided by InstaForex Company - www.instaforex.com |
| August 17, 2020 : GBP/USD Intraday technical analysis and trade recommendations. Posted: 17 Aug 2020 08:45 AM PDT Since April, the GBPUSD has been moving sideways within the depicted consolidation range extending between (1.2265 - 1.2600) On May 15, transient bearish breakout below 1.2265 (consolidation range lower limit) was demonstrated in the period between May 13 - May 26, denoting some sort of weakness from the ongoing bullish trend. However, immediate bullish rebound has been expressed around the price level of 1.2080 bringing the GBPUSD back above the depicted price zone of 1.2520-1.2600 which failed to offer sufficient bearish rejection. Further bullish advancement was expressed towards 1.2780 (Previous Key-Level) where another episode of bearish pullback was initiated. Short-term bearish movement was expressed, initial bearish targets were located around 1.2600 and 1.2520 which paused the bullish outlook for sometime & enabled further bearish decline towards 1.2265. Significant bullish rejection was originated around 1.2265 bringing the GBP/USD pair back towards 1.2780, where the mid-range of the depicted wedge-pattern failed to offer enough bearish rejection. Intermediate-term Technical outlook for the GBP/USD pair remains bullish as long as bullish persistence is maintained above 1.2780 (Depicted KeyLevel) on the H4 Charts. On the other hand, significant bearish rejection was demonstrated around the price level of 1.3160 in the form of (Multiple-Tops). Hence, upcoming bearish reversal should be expected provided that early bearish breakout occurs below 1.2980 (the depicted wedge pattern upper limit). Trade recommendations : Technical traders are advised to wait for any upcoming bearish breakdown below 1.2980 as a valid SELL Entry. Initial T/p level is to be located around 1.2780. On the other hand, bullish persistence above 1.2980 invalidates this trading scenario. The material has been provided by InstaForex Company - www.instaforex.com |
| August 17, 2020 : EUR/USD daily technical review and trade recommendations. Posted: 17 Aug 2020 08:41 AM PDT The EURUSD pair has been moving-up since the pair has initiated the depicted uptrend line on May 25. On June 11, a major resistance level was formed around 1.1400 which prevented further upside movement for some time and forced the pair to have a downside pause. Recently, the EURUSD demonstrated an ascending wedge around the mentioned price level of 1.1400.However, previous negative fundamental data from the U.S. have caused the EUR/USD to achieve another breakout to the upside. Two weeks ago, the EURUSD has approached the price levels around 1.1900 where signs of downside pressure were enhanced. Intraday traders should be considering the recent breakdown of the depicted short-term uptrend line. A Breakdown below the price level of 1.1650 is going to give a better confirmation for a valid SELL Position supported by the positive fundamental data from the U.S. Estimated targets would be located around 1.1550, 1.1500 then 1.1450. On the other hand, conservative traders should consider any bullish pullback to retest the newly-established downtrend line around 1.1850 for another SELL Position with a lower risk. The material has been provided by InstaForex Company - www.instaforex.com |
| Posted: 17 Aug 2020 07:03 AM PDT Minute (h4) operational scale What trend will AUD/USD, USD/CAD, and NZD/USD follow in the second half of August? Let's find out the scenarios of AUD/USD, USD/CAD, and NZD/USD from August 18, 2020 according to the 4-hour charts Australian Dollar vs US Dollar Starting from 18, 2020 a further move of the AUD/USD currency pair will depend on the price action and a direction of the channel's borders of a Median Line (0.7220 - 0.7203 - 0.7185) of the pitchfork under the Minuette scale. A breakout of the support level of 0.7160 at the lower border of a Median Line of the pitchfork under the Minuette operational scale will push AUD/USD towards the borders of a Median Line Minute (0.7160 - 0.7125 - 0.7090) with the prospects of reaching the upper border ISL38.2 (0.7010) of the equilibrium zone of the pitchfork under the Minute operational scale. A breakout of resistance of 0.7220 at the upper border of a Median Line Minuette and a new local high of 0.7244 will open the door for a further uptrend of AUD/USD to the borders of the equilibrium zone (0.7265 - 0.7295 - 0.7320) of the pitchfork under the Minuette operational scale. US Dollar vs Canadian Dollar Starting from August 18, 2020 a further scenario of USD/CAD will depend on the price action and a direction of breaking the borders of a Median Line (1.3225 - 1.3245 - 1.3265) of the pitchfork under the Minuette operational scale. When ISL38.2 Minuette that is support of 1.3225 is broken at the lower border of a Median Line Minuette, the door will be open to a lower local low of 1.3191. So, USD/CAD is expected to reach Shiff Line Minuette (1.3150) and the borders of the equilibrium zone (1.3125 - 1.3095 - 1.3065) of the pitchfork under the Minuette operational scale. New Zealand Dollar vs US Dollar From August 18, 2020 NZD/USD will depend on the price action at the borders of the equilibrium zone (0.6545 - 0.6500 - 0.6455) of the pitchfork under the Minute operational scale. If the lower border ISL61.8 that is support of 0.6455 of the equilibrium zone under the Minute operational scale is breached, NZD/USD could continue its downward move towards RL161.8 Minute (0.6390) as well as to the low of 0.6374. In case the upper border ISL38.2 that is resistance of 0.6545 of the equilibrium zone under the Minute operational scale is broken, NZD/USD is set to carry on with its move in a Median Line Minuette (0.6545 - 0.6565 - 0.6580) with the prospects for the price to reach the borders of a Median Line Minute (0.6610 - 0.6643 - 0.6670) and the equilibrium zone (0.6620 - 0.6643 - 0.6670) of the pitchfork under the Minuette operational scale. The review is composed without taking into account the news background, the hours of trading sessions at key financial hubs. This information should not be considered guidelines for placing sell or buy orders, but it is meant for your awareness. The material has been provided by InstaForex Company - www.instaforex.com |
| GBP/USD: plan for the American session on August 17 Posted: 17 Aug 2020 06:26 AM PDT To open long positions on GBPUSD, you need: From a technical point of view, nothing has changed for buyers or sellers. The bulls tried to hold above the support of 1.3081, forming several false breakouts from it, which is clearly visible on the 5-minute chart. Also, several points were formed for entering long positions, which I highlighted on the chart. However, to achieve a complete victory and continue the upward trend has not yet come out. Trading is still conducted in the support area of 1.3074, which was formed from the level of 1.3080 and buyers of the pound need to try not to allow a breakdown of this range, just below which is the lower border of the current ascending channel. While trading is above 1.3074, we can expect the pair to continue its upward movement to the high of 1.3139. The longer-term goal remains the resistance of 1.3181, where I recommend fixing the profits. If there is no demand for the pound in the support area of 1.3074 and in the second half of the day, it is best to postpone new long positions until the lower border of the broader side channel is updated at 1.3007 in the expectation of a correction of 30-40 points within the day.
To open short positions on GBPUSD, you need: Sellers need to break below the support of 1.3074, as only a consolidation below this level will be a good signal for further opening of short positions in the expectation of reducing the pair to a minimum of 1.3007. A break in the support of 1.3074 will also lead to a break in the lower border of the current ascending channel, which buyers of the pound have been trying to form since the middle of Friday last week. The longer-term goal of bears remains at least 1.2916, where I recommend fixing the profits. In the scenario of recovery of the pair today in the second half of the day, it is best not to rush with sales, and wait for the test of a large resistance of 1.3139, but you can open short positions from there only if a false breakout is formed. I recommend selling the pair immediately for a rebound only after updating the resistance of 1.3181 in the expectation of a correction of 30-40 points.
Signals of indicators: Moving averages Trading is conducted in the area of 30 and 50 daily averages, which indicates the lateral nature of the market. Note: The period and prices of moving averages are considered by the author on the hourly chart H1 and differ from the general definition of the classic daily moving averages on the daily chart D1. Bollinger Bands Breaking the lower border of the indicator around 1.3074 will lead to a larger movement of the pound down. Description of indicators
|
| EUR/USD: plan for the American session on August 17 Posted: 17 Aug 2020 06:24 AM PDT To open long positions on EURUSD, you need: In the first half of the day, absolutely nothing happened, and this is the probability I drew in my morning forecast. However, sellers were able to please the resulting entry point into short positions, which we will now analyze with you. If you look at the 5-minute chart, you will see that after an unsuccessful attempt to grow above the resistance of 1.1865, the bears returned the market to their control, which led to a rapid decline of the pair to the support area of 1.1826, allowing them to take about 40 points of profit from the market. It was not possible to wait for the formation of a buy signal from the 1.1826 level, so the technical picture in EUR/USD did not change. The main task of the bulls is to break through and consolidate above the resistance of 1.1865, which forms a new signal for entering the market in long positions. However, you need to understand that in the second half of the day, no important fundamental statistics are planned, which will limit the upward potential of the pair. If the resistance breaks 1.1865, the next target of the bulls will be a maximum of 1.1912, where I recommend fixing the profit. In the scenario of a decline in EUR/USD after an unsuccessful attempt to grow, it is best to postpone long positions until the formation of a false breakout in the support area of 1.1826, to which the bears did not quite reach the pair. It is possible to buy the euro immediately on a rebound only from the minimum of 1.1784, counting on a correction of 30-40 points within the day.
To open short positions on EURUSD, you need: The sellers' task for the second half of the day remains the same - to protect the resistance of 1.1865. Only the formation of another false breakout in it will allow us to further bring down the aggressive upward potential of the European currency at the beginning of this week. An unsuccessful breakout and return to the 1.1865 level will be a signal to open short positions. However, the more important task of the bears in the second half of the day is to break through and consolidate below the support of 1.1826, which will open a direct road to the minimum of 1.1784 and 1.1746, where I recommend fixing the profits. In case of further growth of EUR/USD according to the trend formed on August 12, it is best to open short positions on a rebound from the resistance of 1.1912 in the expectation of a correction of 30-40 points within the day. Given that the release of important fundamental statistics at the beginning of the week is not planned, it is better not to rush with sales, and open them only from really large levels of resistance.
Signals of indicators: Moving averages Trading is just above the 30 and 50 daily moving averages, which indicates a continuation of the bull market. Note: The period and prices of moving averages are considered by the author on the hourly chart H1 and differ from the general definition of the classic daily moving averages on the daily chart D1. Bollinger Bands If the pair falls in the second half of the day, support will be provided by the lower border of the indicator in the area of 1.1826, the break of which will increase pressure on the euro. Description of indicators
|
| Posted: 17 Aug 2020 06:13 AM PDT
The wave structure of the upward section of the trend, which originates on March 20, looks fully completed and took the form of a triple zigzag. The last wave Z may complicate its internal structure, but before a successful attempt to break through the 0.0% Fibonacci level, I would not recommend considering this option as a working one. However, if the news background from the US continues to remain so weak, the entire wave Z may take on a more complex and extended form. However, all the waves look quite harmonious relative to each other. Thus, I still believe that the increase in the quotes of the instrument is complete.
If you look at the current wave pattern in more detail, you can see that the wave structure a-b-c is visible inside the wave Z, and the waves 1-2-3-4-5 are visible inside the wave C. Thus, at the moment, I believe that the upward section of the trend has completed its construction. If this is true, then the decline in quotes will continue with the goals located around the 23.6% and 38.2% Fibonacci levels and below. At the same time, a weak news background from America may still lead to an even more complicated upward trend. The news background for the pound/dollar instrument on Friday was similar to the euro/dollar instrument. There was no report or other news in the UK. Moreover, in recent years, the topics that regularly had the strongest influence on the British have faded. The most important topic for the English currency (Brexit) has completely exhausted itself and the markets are now just waiting for this significant date of December 31, 2020, when Britain will finally leave the EU. About the Brexit negotiations, in my opinion, have already been forgotten or simply put an end to them. In general, there is no news from Britain, and the ones that were last week did not particularly interest the markets, although there were very important ones among them. And although the current wave markup implies a decrease in quotes, it is the news background from America that can prevent this option from being implemented. No economic events are expected in America or the UK today or tomorrow. Thus, the instrument can continue to trade with a minimum amplitude and with a minimum downward slope. However, news from the US continues to arrive, in particular on the negotiations between Republicans and Democrats, on the COVID-2019 pandemic, and all of them can further reduce the demand for the dollar. Nevertheless, I recommend considering the option of building a new downward wave as the main one, and only in the case of a successful attempt to break the 1.3185 mark, go to the option with the complication of the entire wave marking and the resumption of the increase. General conclusions and recommendations: The pound/dollar instrument presumably completed the construction of an upward wave Z around the 1.3183 mark. Therefore, I recommend at this time to close all purchases at least until a successful attempt to break through the 0.0% Fibonacci level and adjust for a possible long-term decline in quotes within the new downward trend with the first goals located around 1.2832 and 1.2719, which is equal to 38.2% and 50.0% for Fibonacci. The material has been provided by InstaForex Company - www.instaforex.com |
| Posted: 17 Aug 2020 06:09 AM PDT In the most global terms, the wave marking of the EUR/USD instrument looks quite complete. However, the entire section of the trend, which originates on March 20, can easily be transformed into a five-wave one. At the moment, everything looks as if the upward section of the trend is complete, and the internal wave structure of each global wave looks quite convincing and does not cause much doubt. A successful attempt to break the 0.0% Fibonacci level by 90% will mean that the upward section of the trend will take a 5-wave form and the euro will continue to rise. A smaller scale wave markup shows that the pair has built two new waves after the end of the assumed wave 3 or C. Thus, the decline in quotes should resume almost in any case within the framework of wave C or 4. The expected wave b has already taken a three-wave form, respectively, the decline in the instrument's quotes should resume today or tomorrow. A break in the peak of wave 3 or C will also initially indicate the construction of the same wave 4. On Friday, August 14, very important reports were released in America that could help the markets form an opinion about the state of the American economy at this time. However, before the markets learned the American statistics, the Eurozone released a report on GDP for the second quarter. Despite the fact that the European economy shrank by 12.1% compared to the first quarter, which also recorded a "minus", the euro currency did not experience any pressure on itself and demand for it did not decrease during the day. US statistics were intended to help the US currency, but two of the three economic reports did not differ much from market expectations (the consumer confidence index and industrial production), and retail sales rose by just 1.2% in July. However, the value of 1.2% is now considered normal after two months of collapse and two months of strong growth. This indicator simply returned to pre-crisis values. In general, the statistics from America did not impress the markets and the dollar did not get help. No economic reports are scheduled for Monday in the EU and the US. Meanwhile, more and more economists fear that the US economy will start slowing again in the coming months. If we are now talking about its recovery, it may be significantly slowed down due to the continuing spread of the pandemic due to the inability of the Democratic and Republican parties to agree on a new stimulus package for the economy. In this case, the demand for the US dollar may remain low and in accordance with the current wave pattern, it will be a maximum of a downward correction wave, and not a new downward set of waves. General conclusions and recommendations: The euro/dollar pair presumably completed the construction of an upward wave C or B. Thus, at this time, I do not recommend new purchases of the instrument, and I recommend closing the old ones at least until a successful attempt to break the 0.0% Fibonacci level. I also recommend considering the possibility of selling the instrument with the first targets located near the calculated levels of 1.1634 and 1.1465, which is equal to 23.6% and 38.2% for Fibonacci, based on MACD downward signals. The material has been provided by InstaForex Company - www.instaforex.com |
| Posted: 17 Aug 2020 05:30 AM PDT
Oil prices are rising again after a drop on Friday. Brent futures for October rose by 0.83% to trade at $45.17 per barrel, moving from the close of the previous session. At the same time, WTI oil futures for September went up by 0.98% to settle at $42.42 per barrel. By the end of the week, Brent added 0.9%, while WTI rose by 1.9%. The market was supported by the data showing a drop in US oil inventories for the third week in a row. Meanwhile, the US and China have postponed trade negotiations scheduled for August 15, thus disappointing investors. However, AxiCorp analyst Stephen Innes believes that the large volume of US oil imports to China is the most obvious confirmation of the trade deal. According to experts from BofA Global Research, at the end of 2020 there will be a shortage of oil in the market. In this regard, the price of Brent oil may surge to as high as $60 per barrel in the first half of 2021. Analysts expect that investors will gain confidence from the OPEC+ compliance with the terms of the current agreement on output cuts. In addition, US shale production will decline, and the recovery in global oil demand will be sustained. If these factors persist, then the global oil market may face a shortage of 4.9 million barrels per day. Thanks to this, the price of Brent can easily rise to $60 per barrel next year, experts say. Moreover, according to some reports, global oil reserves are reducing faster than expected. They have almost returned back to normal levels. The BofA forecast is based on the assumption that the world will be able to avoid a massive second wave of the coronavirus pandemic in the fourth quarter of 2020. The material has been provided by InstaForex Company - www.instaforex.com |
| US stimulus package agreement conflict drags dollar further down Posted: 17 Aug 2020 05:25 AM PDT
The US dollar continues to depreciate in relation to most major currencies on Monday. The dollar's troubles are primarily related to the lack of agreement on the adoption of the next financial stimulus program from the US government. There is no way Democrats and Republicans can come to a consensus on the need for this stimulus package. Adding to the tension is the conflict between Washington and Beijing, which recently led to the disruption of negotiations between the countries over a trade agreement. A meeting of representatives of the two states was supposed to take place last weekend, which has now been postponed indefinitely. The yen, on the other hand, became insignificant on Monday. It nevertheless, strengthened against the US dollar, however, went some pullback against the single euro. The poor statistics on Japan's economic growth in the second quarter of this year may be causing this negativity on the yen. According to the latest data, the decline in the country's GDP amounted to 7.8%, which was a record reduction against the background of a general decline in the indicator over the past three months. Thus, the Japanese economy still felt the weighty pressure of the coronavirus pandemic, which, according to analysts, will continue. Meanwhile, the Chinese yuan is becoming more expensive in relation to the dollar. The US dollar fell 0.18% against the yuan to trade at 6.9379 yuan per dollar. The People's Bank of China added some positive by making the decision to keep the base rate on loans at a low level of 2.95% for an indefinite period. In addition, the regulator made a financial injection into the banking system under the MLF program in the total amount of 700 billion yuan. The value of the euro amounted to 1.1867 dollars per euro Monday morning, this is 0.21% higher than the previous figure. Recall that the trading session on Friday last week ended at $ 1.1842 per euro. In relation to the Japanese yen, the euro increased by 0.12% and reached 126.39 yen per euro. Its previous level was located at around 126.24 yen per euro. The value of the US dollar against the yen has changed in the direction of reduction. The exchange rate fell by 0.08%, which moved it to the level of 106.52 yen per dollar, while earlier it was in the area of 106.60 yen per dollar. The pound sterling has also strengthened in relation to the dollar growing 0.11%, which is equivalent to $ 1.3100 per pound. Recall that the previous trading ended at around 1.3086 dollars per sterling. The pound against the euro, on the contrary, reduced its positions by 0.12% and began to cost 1.1042 euros, while earlier it was at the level of 1.1055 euros per pound. The dollar index against a basket of six major world currencies also continues to slowly but surely creep down declining 0.07% on Monday. It also sank 0.07% against a basket of sixteen major world currencies. Today, the most popular strategy in the foreign exchange markets is associated with the sale of the US dollar, which is evidence of a total loss of interest in the greenback itself. Most analysts argue that the European economy is now in a stronger position and will be able to quickly recover from the crisis associated with the coronavirus pandemic. But the US economy, according to their calculations, will still face problems in the very near future. In this regard, it is very thoughtless to place a bet on the dollar, which is what the market participants listen to, among whom the bearish trend has spread in relation to the dollar. The material has been provided by InstaForex Company - www.instaforex.com |
| Posted: 17 Aug 2020 05:01 AM PDT Disappointing statistics on US retail sales have become another nail in the coffin of the US dollar. The indicator fell short of the forecasts of Reuters experts, which in the conditions of increased sensitivity of the main world currencies to macro statistics, contributed to another weekly closing of the USD index in the red zone. According to BofA Merrill Lynch surveys, "American'' is actively sold by asset managers, 36% of whom consider this strategy the best this year. When the dollar loses positions, the "bulls'' for GBP/USD forget about the problems of the Foggy Albion. But the difficulties of the country and sterling is enough. In the second quarter, GDP sank by more than 20%, twice as much as the US or Eurozone economies. Britain started using lockdown a little later and got out of it 2-3 weeks later than the rest of Europe. The risks of a no-deal Brexit have not disappeared, and the recovery in gross domestic product is sure to be difficult. What is the matter, why is the pound growing so confidently? In my opinion, the main reason is the weak dollar, however, it is not the only one. After a meeting with British Prime Minister Boris Johnson, his colleague from Ireland, Michael Martin, said that Johnson has a sincere desire to make a deal with the EU. He would not want to exacerbate the recession with a no-deal Brexit. There is a "landing zone" in the negotiations between Brussels and London, and both sides want to complete the deal by October. Good news of a political nature is positive for sterling, especially since its opponent in the face of the US dollar is experiencing difficulties due to the elections. No one knows what the initiative of Donald Trump to cancel the postal vote will lead to, and how soon the results of this vote will be known? As for the economy, investors use investment ideas based on forecasts of future events, and leave the past alone as a winning factor. In this regard, strong statistics on inflation, retail sales and business activity can provide the "bulls" for GBP/USD with all possible help. It will finally dissuade the market from the desire of the Bank of England to introduce negative interest rates. Dynamics of business activity and GDP in Britain
The US dollar's positions continue to look vulnerable. Retail sales can be the beginning of the end. The deterioration of the epidemiological situation in the States in mid-summer is fraught with a series of disappointing macroeconomic reports, which will hit the dollar. In the run-up to the election, Donald Trump's attempt to make up for lost time and show harshness towards official Beijing and Chinese companies looks belated and hurts the USD index. The pound's opponent is barely on its feet, why shouldn't GBP/USD continue its rally? There are risks, of course. Gloomy data on inflation, retail sales and business activity in the Foggy Albion can return rumors of a fall in the repo rate below zero. The second wave of COVID-19 in the Old World will undermine confidence not only in the euro, but also in other European currencies. However, while all this has not happened, there is an opportunity to buy the pound on the breakout of resistance at 1.314 and 1.32. GBP/USD, the daily chart
|
| EUR / USD: Dollar's decline slows down, euro positions look shaky Posted: 17 Aug 2020 04:42 AM PDT
Over the past three weeks, the main currency pair has not been able to go beyond the range of 1.1700-1.1910. Moreover, the boundaries of fluctuations have become more narrow with the range of 1.1710-1.1865. According to National Australia Bank, "The good news at the moment is that the trade deal between the US and China remains in effect and without any changes. However, there are other uncertainties that need to be addressed, namely: the policy of the United States ahead of the presidential elections and new hot spots for the spread of coronavirus in the EU, which may challenge the notion that the euro is in an upward trend, " "The growth of the euro against the US currency in recent years looks excessive, so it is quite likely that EUR / USD pair will roll back to about 1.15 in a three-month perspective," said Rabobank strategists. "We also see the risk that global market sentiment may deteriorate after the release of the third quarter statistics, which could benefit the US dollar. However, the new direction of movement of EUR / USD, most likely, will not form until the liquidity returns to normal levels in September, "they added. The greenback came under pressure in late March when the Fed pledged to provide unlimited liquidity to support the national economy hit by the COVID-19 pandemic. Since then, the greenback has been depreciating amid low rates in the US and the fall in real yields on 10-year Treasuries to record lows in negative terms. The USD is currently trading near 92.96, roughly in the middle of the range, it has held since falling to two-year lows in late July. Although many market participants expect a further weakening of the greenback, its decline may be more restrained and gradual than in early April, after the American Central Bank sharply lowered the interest rate, bringing it to almost zero levels, and launched a number of stimulating programs for the national economy. According to data that was released by the US Department of Labor on Thursday, the wave of layoffs has subsided and the rate of hiring is growing. This is an encouraging signal that the weakness of the previous data could only be a temporary phenomenon and not a tipping point. Thus, it is worth being more cautious about building up short USD positions. This week the focus of traders' attention is the minutes from the Fed and the ECB meetings held in July, as well as the data on business activity in the US and the eurozone for August. The EUR / USD pair faced serious resistance around 1.1850. A breakdown of this level will aim the pair at 1.1900 and further at 1.1915-1.1920. Support at 1.1690-1.1700 should contain the pair's decline. The material has been provided by InstaForex Company - www.instaforex.com |
| BTC analysis for August 17,.2020 - Key pivot at the price of $11.950 on the test Posted: 17 Aug 2020 04:22 AM PDT Further Development
Analyzing the current trading chart of BTC, I found that BTC is testing the key pivot resistance at the price of $11,950 and you should watch carefully that level for the further directional play. Rejection of the pivot resistance at $11,950 can represent opportunity for downside rotation towards the $11,600 The breakout with strong momentum of $11,950 can represent potential for further upside movement towards $12,300 Key Pivot level is set at $1,950-$12,000 The material has been provided by InstaForex Company - www.instaforex.com |
| Asia, Europe, and US stock markets observed multidirectional dynamics Posted: 17 Aug 2020 04:21 AM PDT
Asian stock markets experienced mixed dynamics on Monday. The main stock indicators did not only change sluggishly but also moved in different directions. This mainly concerns Japan's Nikkei 225 index which began to fall after the release of statistics on the country's GDP. In addition to this is the escalating conflict between the US and China which puts increasing concerns amongst market participants. Japan's Nikkei 225 is down 0.7% in the morning. According to statistics, the Japanese economy has been hit hard in the second quarter of this year. The level of GDP contracted by 7.8% at once, which was only down by 0.6% during the first quarter. Thus, for three quarters in a row, there has been a decline, which was the last record-breaking one. The reason for this collapse is the impact of the coronavirus pandemic, which has not yet been fully dealt with. Meanwhile, experts warned Japan about a possible deep fall, but even their forecasts were slightly better than real data. Its GDP was expected to fall by at least 7.6% in the last quarter. If you compare the last figure with the one recorded a year ago, you can see a colossal difference: over the year, the Japanese economy collapsed by 27.8%. The main drop occurred precisely in the second quarter of 2020. Of course, such data could not please investors in any way, which was reflected in the stock indicator. China's Shanghai Composite Index rose significantly by 2.4%. The Hong Kong Hang Seng Index also followed the positive trend and climbed 1.2%. Australia's S & P / ASX 200, on the contrary, showed negative dynamics and has declined 0.8% so far. Stock markets in South Korea did not open today because of the holidays in the country. Multidirectional dynamics were also observed on the US stock exchanges on Monday due to a new portion of statistics and the expectation of a final decision on the fiscal stimulus program in the country. The level of retail sales in the second month of the summer in the US showed more modest growth, which was expected by analysts and market participants. This began to push the latter to believe that the country's economy is still in an extremely unstable and weak position. As it became known, retail sales rose only 1.2% compared to the previous month. At the same time, preliminary data were much higher: analysts spoke of an increase of 1.9%, and some even of a 2% increase, which never happened. However, there are some positive aspects as well. The level of labor productivity in the second quarter of this year increased immediately by 7.3%, which was the maximum growth over the past eleven years. The average labor cost from April to June also rose by about 12.2%. Of course, analysts expected an increase, but their data was much more modest. Thus, in preliminary forecasts, labor productivity growth was indicated by no more than 1.5%, and the cost of labor did not exceed 6.2%. The positive changes also affected the industrial production sector. Its volume in the US in July rose by 3% compared with the indicator that was recorded earlier. It is noteworthy that this time the preliminary forecasts coincided with the real data. Compared to last year's level of industrial production, its current figure has decreased by 8.2%. The consumer confidence index in the US in the last month of the summer rose by 72.8 points, while earlier it was equal to 72.5 points. The experts were not ready for such an increase: according to their data, this indicator should have remained around 72 points. The main attention of market participants was still associated with the adoption of a decision on the ratification of a new package of financial incentives in the country. Democrats and Republicans continue to come up with disagreements which caused an unfavorable effect on the mood of the stock exchanges. Clearly, the problem would remain for some time after the publication of data from the labor market, which turned out to be better than expected. This made the authorities ponder whether a stimulus package is needed at all. However, the situation with consumer confidence, which is rapidly falling, so far indicates the need for such measures. Another extremely unpleasant factor for investors was the news about the indefinite postponement of negotiation on the trade agreement between Washington and Beijing. This can only mean that the conflict between the countries is aggravating and the situation is still very far from being normal. The Dow Jones Industrial Average closed Friday's trading with an increase of 0.12% or 34.3 points, which allowed it to move to the level of 27,931.02 points. The Standard & Poor's 500 index, on the other hand, was negative declining 0.02% or 0.58 points. The current level of the indicator is 3,372.85 points. The Nasdaq Composite Index fell 0.2% or 26.33 points, which sent it to the level of 13,019.09 points. Stock markets in Europe are inactive this morning which also went on multidirectional dynamics. The general index of large enterprises in the Stoxx Europe 600 region went up 0.19% which allowed it to move to the level of 368.77 points. The UK FTSE 100 Index is up by 0.34%. Germany's DAX jumped 0.22%. France's CAC 40 index rose 0.23%. The Italian FTSE MIB index, on the contrary, went down by 0.13%. Spain's IBEX 35 followed suit and sank 0.62%. Most of the pressure on European markets comes from the conflict between the U and China. However, the epidemiological situation in the world, which is still very tense, is being monitored no less than this. The material has been provided by InstaForex Company - www.instaforex.com |
| Posted: 17 Aug 2020 04:15 AM PDT Bloomberg with the headline, citing OPEC on the matterJust a heads up to the meeting later this week, in case we hear of how the compliance issue is going or any possible plans for future production cuts and what not. The latest reports are suggesting that OPEC+ sees ~95% compliance to its production cuts in July and I reckon that is somewhat of a satisfactory figure, so there shouldn't be too much complaints despite that being down from ~107% in June.
Further Development
Analyzing the current trading chart of EUR, I found that EUR reached our Friday's first upward target at 1,1865 and that is heading for the second target at 1,1910. 1-Day relative strength performance Finviz
Based on the graph above I found that on the top of the list we got Ethanol and Silver and on the bottom VIX and Coffee EUR is sligthly in the positive territory and is waiting for the next direction movement. Key Levels: Resistance: 1,1910 Support level: 1,1826 The material has been provided by InstaForex Company - www.instaforex.com |
| Posted: 17 Aug 2020 04:09 AM PDT Brexit negotiations start up again this week The usual round of negotiations will start off with tomorrow's dinner, before getting into more serious talks on Wednesday and Thursday. Both sides will wrap things up on Friday before we are likely to hear from Barnier and Frost once again via their respective pressers.
As I discussed in the previous review, the Gold is still trading sideways at the price of $1,953 Further Development
Analyzing the current trading chart of Gold, I found that the Friday was inside day and that we defined the levels to watch. 1-Day relative strength performance Finviz
Based on the graph above I found that on the top of the list we got Ethanol and Silver and on the bottom VIX and Coffee Key Lvels: Resistance: $1,965 Support level: $1,912 The material has been provided by InstaForex Company - www.instaforex.com |
| USD/JPY. Calm yen ignored the failed data on Japan's GDP growth Posted: 17 Aug 2020 03:55 AM PDT The dollar/yen pair actually ignored the release of data on Japanese economic growth in the second quarter today. And although the indicators updated multi-year anti-records, the yen remained at practically the same positions as before the publication. This "stress resistance" is explained, firstly, by the weakness of the US currency, and secondly, by the growth of anti-risk sentiment against the background of the accelerating pace of the spread of coronavirus around the world. As a result, the indicated currency pair stayed afloat, although the published figures were in the "red zone". It is worth noting here that many of the world's leading countries have published their reports on GDP for the second quarter over the past few weeks. All of them reflected the consequences of the coronavirus crisis. The spring was the peak of the pandemic, when key countries were in a state of lockdown. Therefore, the "spring numbers" are of a corresponding nature: in the States, the country's economy contracted by 32%, Europe slowed down by 12%, and Britain by almost 30%. Japan is not exempted. On a quarterly basis, the Japanese economy slowed down by 7.8% (against the forecast of -7.5%). In annual terms, the volume of GDP declined by 27.8% (with the forecast of a decline to -26.9%). In turn, nominal GDP on a quarterly basis declined by 7.4% against the forecast of -6.5%, while the cost of goods for industrial purposes declined by -1.5%. For the first time since the summer of last year, capital expenditures have decreased (by 1.5% at once) - at the highest rate since 2018. The personal consumption indicator fell to -8.2%, declining for the third quarter in a row (for comparison, in the first quarter it came out at -0.8%). The rate of decline in this indicator is the highest over the past 30 years. The coronavirus also affected foreign trade - the volume of exports in the second quarter in Japan declined by 18.5%, this is the worst result in the last 11 years. Thus, many components of today's release have updated multi-year anti-records, but the yen remained indifferent to this publication. First, the economic downturn in the second quarter was widely expected, especially against the background of similar dynamics in all countries of the world (to one degree or another). Secondly, the yen received support from the Minister of Economy of Japan, Yasutoshi Nishimura, who rather restrainedly commented on the published figures. He stated that the Japanese economy "is in dire straits, but the rate of GDP contraction is lower than in Europe and the United States." He also expressed hope that the recovery of the largest economies of the world will contribute to the recovery of Japanese exports. In addition, according to Nishimura, the level of consumption of goods and services is already beginning to recover, as proven by more recent data. In other words, the head of the Japanese Ministry of Economy has neutralized the negative effect of today's release. This allowed traders of the USD/JPY pair to focus on the external fundamental background. Here, the role of the first violin is played by the coronavirus, which continues to spread the globe rapidly: over the past day, almost 300 thousand new cases of COVID-19 have been recorded in the world. This is a record daily increase since the start of the pandemic. At the same time, according to the data of the WHO experts, a significant number of infections are simply not recorded by statistics - there are countries in which tests are not even done. Against the background of such anti-records on the market, interest in protective instruments increased, and not only to the yen, but also to both gold and franc which showed positive dynamics at the start of trading. It is also necessary to take into account the dynamics of the dollar index. For the first time since May 2018, this indicator fell to the area of 92 points, reflecting the weakness of the US currency throughout the market. Lack of political coherence in the US Congress, a new round of political confrontation between Democrats and Trump (around the work of the Postal Service), as well as another escalation of the Cold War between Washington and Beijing – all these fundamental factors undermined the position of the dollar, which fell in price at the beginning of the trading week. the whole market. From a technical point of view, the situation is as follows. The dollar/yen pair on the four-hour chart is located between the middle and lower lines of the Bollinger Bands indicator. If the price consolidates below the level of 106.40, the Ichimoku indicator will form a "Dead Cross" signal, in which the Tenkan-sen and Kijun-sen lines will be above the price, and the Kumo cloud will be below it. This configuration will indicate the priority of short positions - up to the lower border of the above cloud, that is, to the level of 105.90. However, it is advisable to consider selling only after the bears break through the level of 106.40. The material has been provided by InstaForex Company - www.instaforex.com |
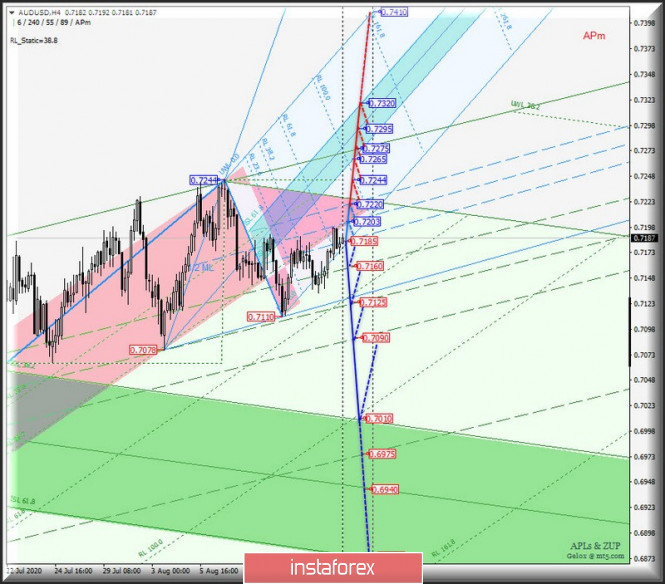
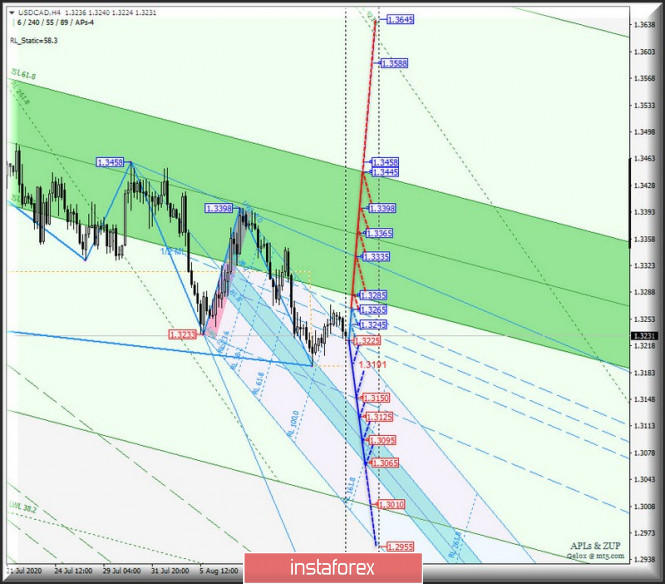
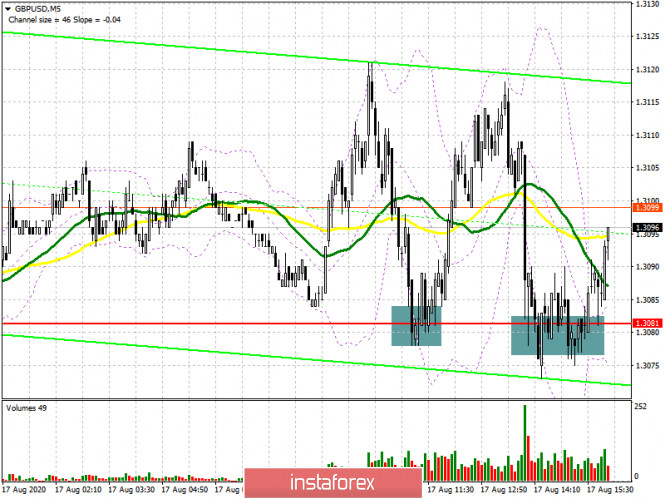
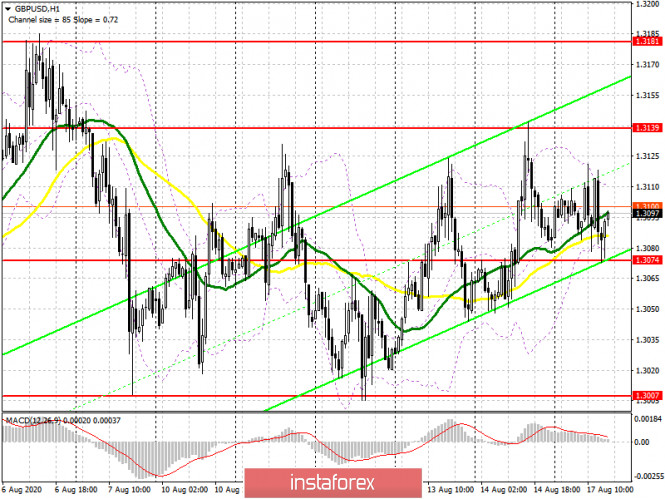
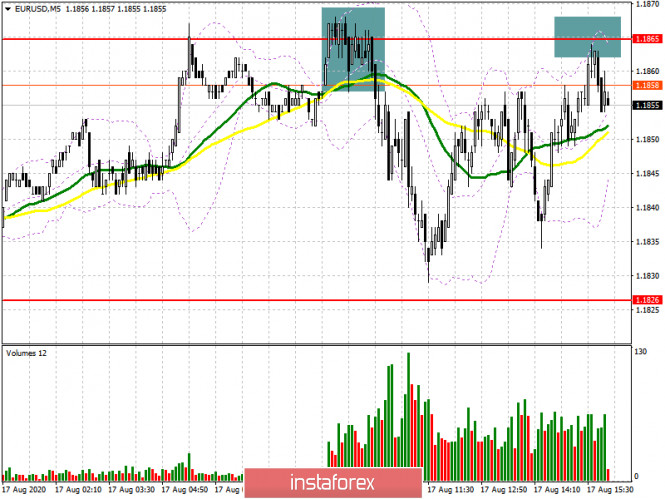
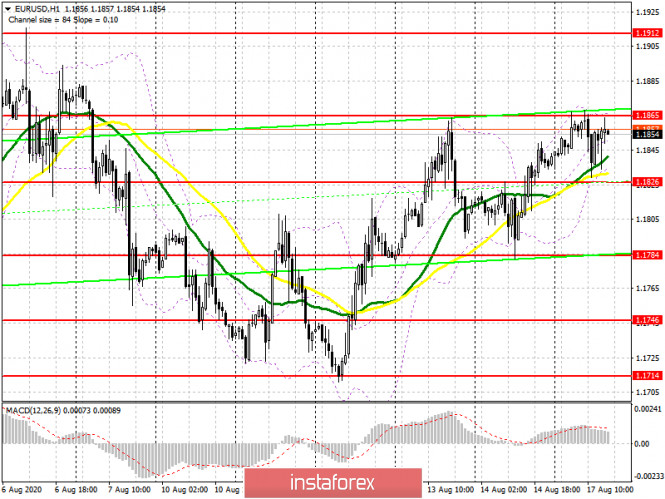
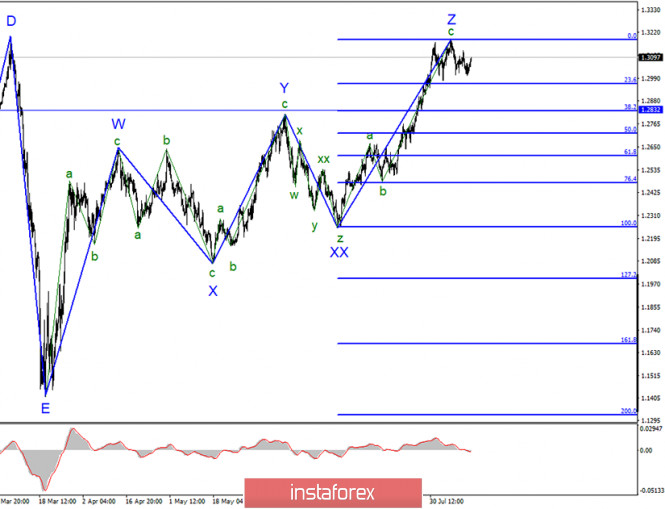
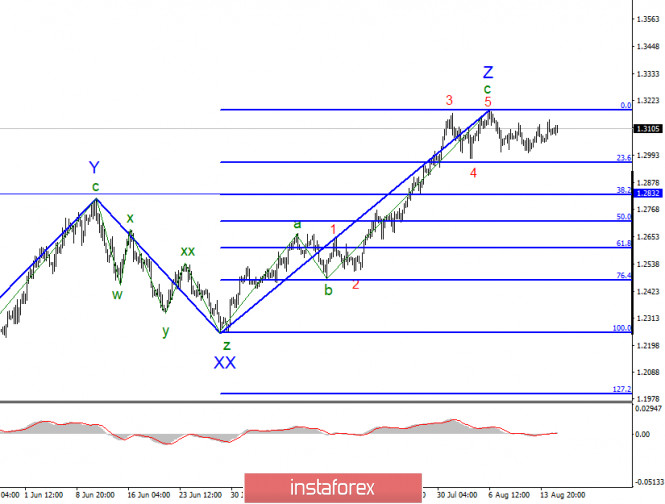
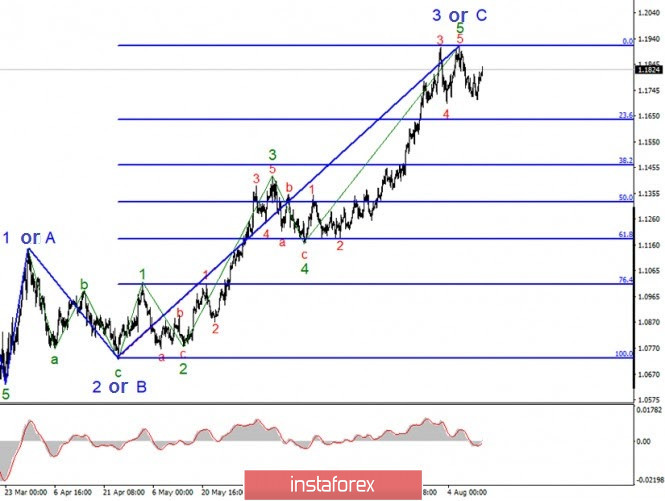
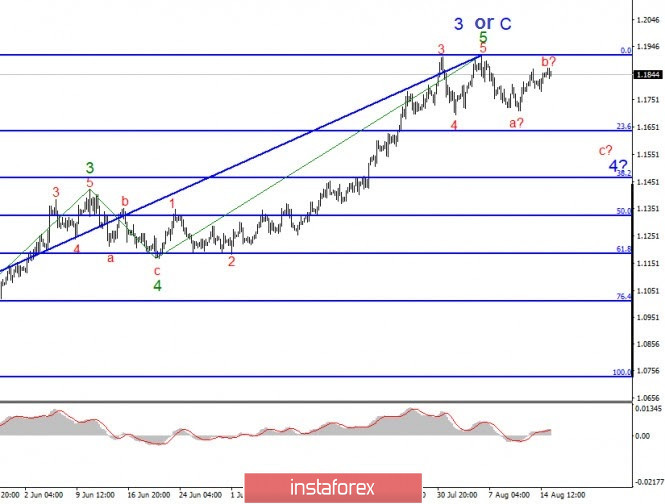


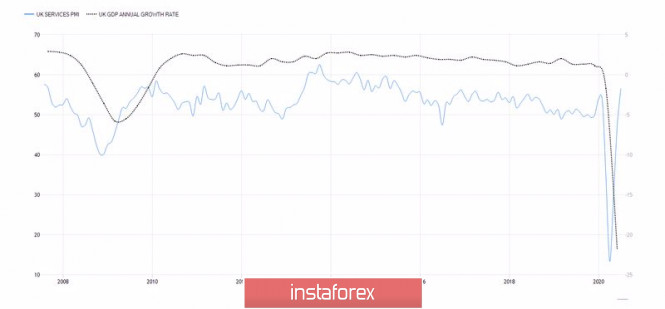
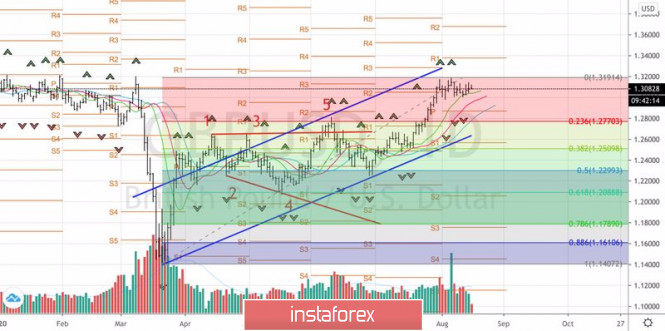
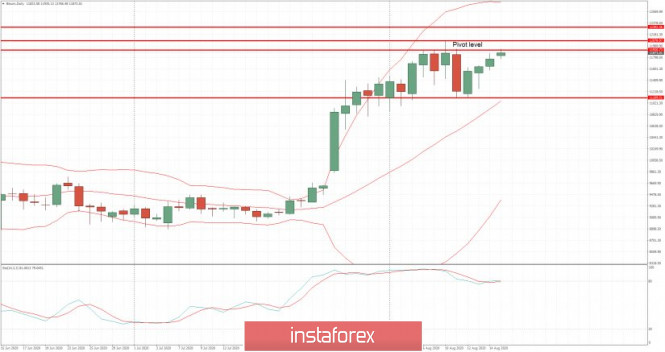


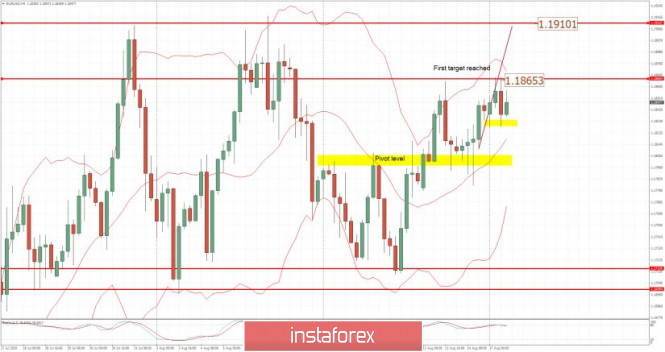


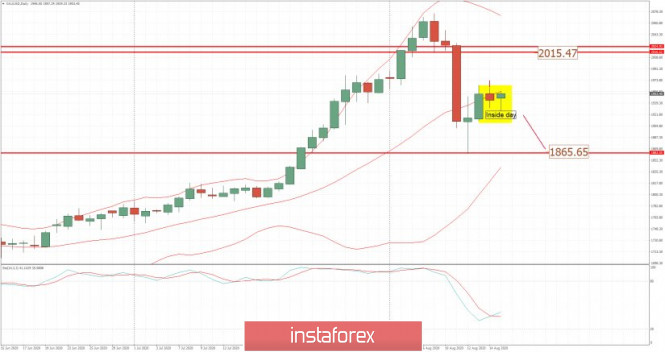
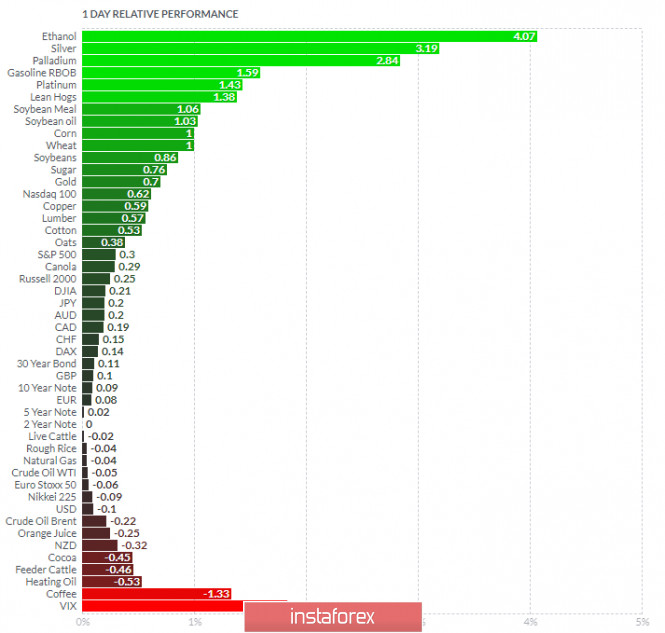

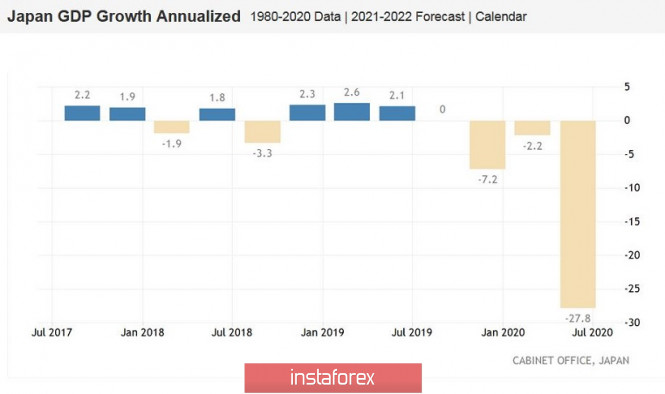
| You are subscribed to email updates from Forex analysis review. To stop receiving these emails, you may unsubscribe now. | Email delivery powered by Google |
| Google, 1600 Amphitheatre Parkway, Mountain View, CA 94043, United States | |
No comments:
Post a Comment