
Forex analysis review |
- Forecast for EUR/USD on August 19, 2020
- Forecast for AUD/USD on August 19, 2020
- Forecast for USD/JPY on August 19, 2020
- Hot forecast and trading signals for the EUR/USD pair on August 19. COT report. EU inflation report and FED meeting minutes
- Overview of the GBP/USD pair. August 19. The US and China are in conflict again, this time over Huawei. The dollar falls
- Comprehensive analysis of movement options for Gold & Silver (H4) on August 18, 2020
- Overview of the EUR/USD pair. August 19. Americans are going to vote for Biden not because he is good, but because Trump
- Technical picture, like the fundamental, promises big problems for the dollar
- Analytics and trading signals for beginners. How to trade the EUR/USD pair on August 19? Analysis of Tuesday trades. Preparation
- August 18, 2020 : EUR/USD Intraday technical analysis and trade recommendations.
- Donald Trump triggers another spike of EUR/USD
- August 18, 2020 : GBP/USD Intraday technical analysis and trade recommendations.
- August 18, 2020 : EUR/USD daily technical review and trade recommendations.
- Will ETH rise to $500? Ethereum price prediction
- Gold continues to rally amid falling dollar
- EUR / USD: dollar continues to fall, euro maintains positive momentum
- Short-term technical analysis of Gold for August 18th, 2020
- What is our next Bitcoin target?
- Ichimoku cloud indicator analysis of USDJPY for August 18th, 2020.
- USDCAD getting closer to our 1.30 target
- EURUSD breaks above trading range
- Evening review on August 18, 2020
- US and Asian stocks under pressure while European stock markets doing great
- Oil is driven by politics
- GBP/USD: plan for the American session on August 18
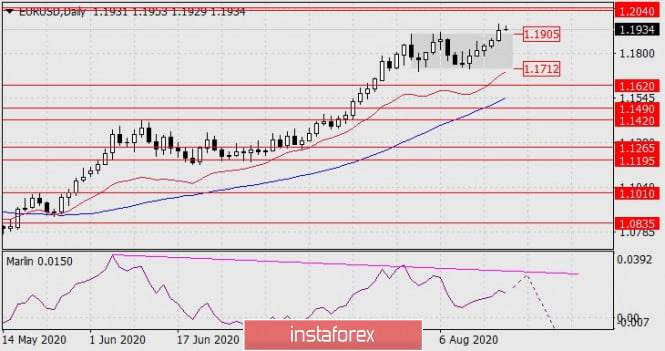
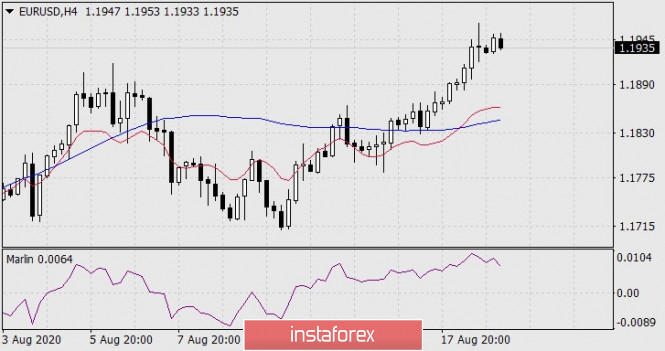
| Forecast for EUR/USD on August 19, 2020 Posted: 18 Aug 2020 07:49 PM PDT EUR/USD The euro finally came to terms regarding its direction on Tuesday, following two weeks of being in the uncertain zone of 1.1712-1.1905. It chose an upward direction against the background of established risk sentiment. The US stock index S&P 500 broke the pre-crisis high, setting a historical record of 3395. Restrictive stops of euro sellers at levels from 1.1900 were closed, the single currency received an additional boost for growth. Now its nearest target is the 1.2040/55 range, then the 1.2155 level – the March 1, 2018 low. The Marlin oscillator sluggishly moves up, which on the technical side preserves the probability of forming a double divergence after the price rises to 1.2155. The price develops above the balance and MACD lines on the four-hour chart, the Marlin slowly moves up, and the local growth keeps the trend. We are waiting for the euro in the area of the first target of 1.2040/55. |
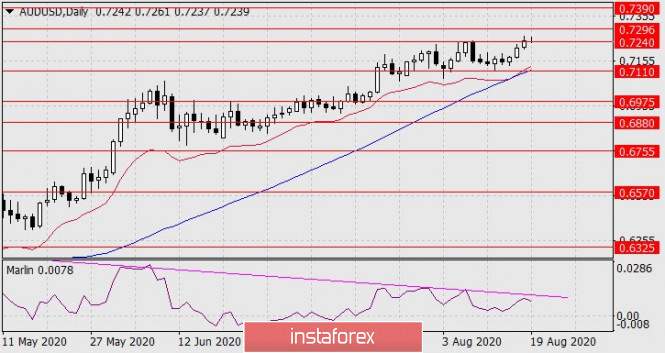
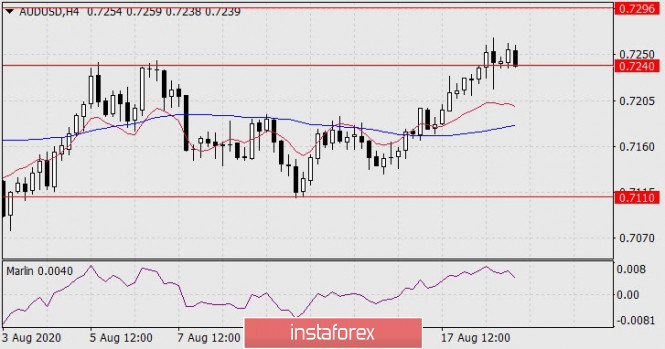
| Forecast for AUD/USD on August 19, 2020 Posted: 18 Aug 2020 07:46 PM PDT AUD/USD The Australian dollar continues to grow abnormally against the five-fold divergence of the price and the oscillator. When the price overcomes the next bullish level of 0.7296 (January 2019 high), the signal line of the Marlin oscillator will go above its forming line and the divergence will dissolve into the overall long-term picture, transforming into a wedge-shaped structure. Therefore, if the aussie does not turn around from 0.7296, the next target will be the 0.7390 level – the high of December 2018. The price settled above the target level of 0.7240 (peaks on August 5 and 7) on the four-hour chart and is ready to reach the nearest target of 0.7296. The Marlin oscillator still has growth potential, it is not in the overbought zone. |
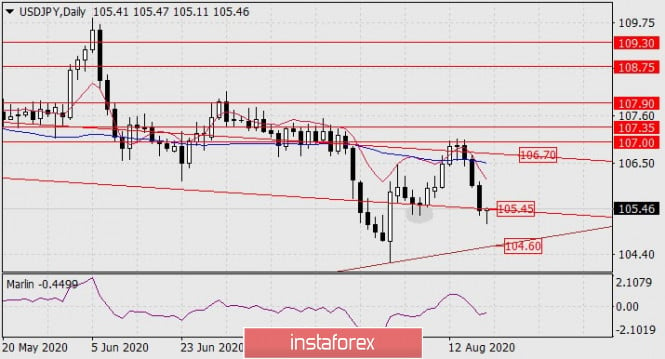
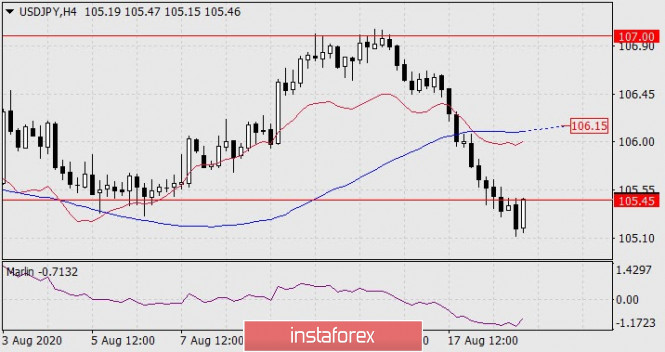
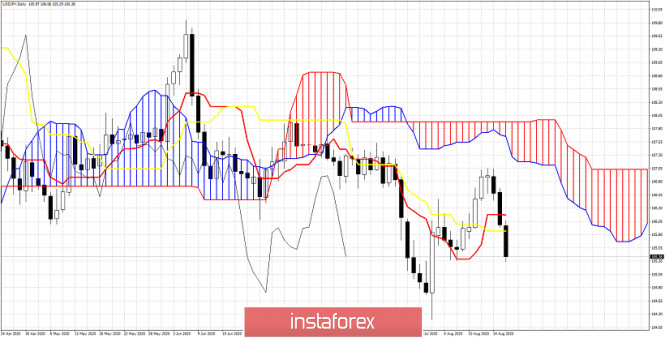
| Forecast for USD/JPY on August 19, 2020 Posted: 18 Aug 2020 07:44 PM PDT USD/JPY The dollar-yen pair fell by 58 points on Tuesday, having reached support for the embedded line of the price channel. The signal line of the Marlin oscillator is in the negative trend zone, but it is already showing the first signs of a reversal. Given the increased interest in risk in the stock markets (S&P 500 set a historical record of 3,395 yesterday), the yen might not move towards the 104.60 target and leaving support may turn out to be false, as it was on August 5-6 (highlighted by a gray oval). If the price settles above 105.45, we expect the pair to grow to the upper target of 106.70. The Marlin oscillator begins to turn up on the four-hour chart. To continue moving, the price needs to gain a foothold above the 105.45 level. The MACD line in the 106.15 area could be an obstacle for the price to rise to the 106.70 target on the daily chart, where it can grow before meeting the price. Overcoming this resistance will give the dollar additional strength. |
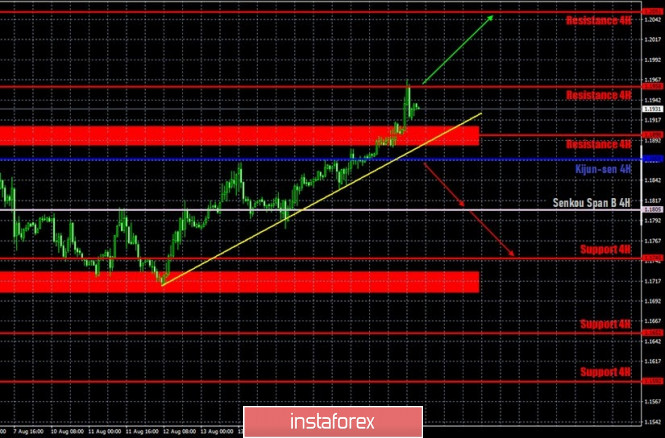
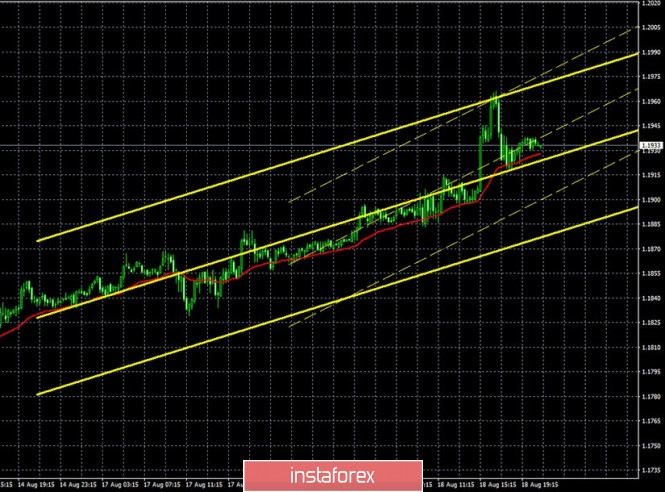
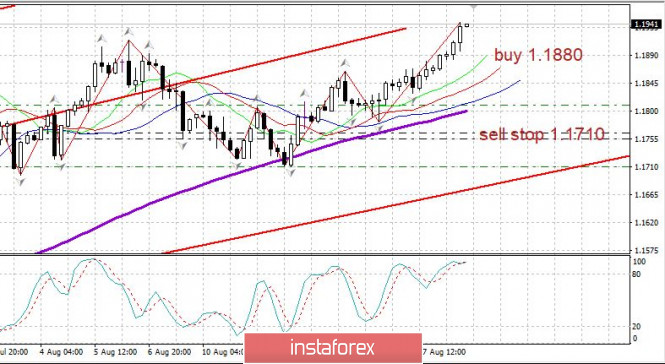
| Posted: 18 Aug 2020 06:07 PM PDT EUR/USD 1H The euro/dollar pair continued its upward movement on the hourly timeframe of August 18, breaking the resistance area of 1.1886-1.1910, which allowed buyers to continue to put pressure on the pair. Thus, the quotes reached the resistance level of 1.1958 by the end of the trading day, which is the second target this week. But most importantly, now we can say that the price has left the side channel, which means that the upward trend has resumed. At the same time, we remind traders that the price has not been able to adjust properly for the past three weeks, so the dollar remains firmly oversold. This means that the upward trend can end at any time. However, we still have an upward trend line at our disposal, which greatly helps in determining the current trend. EUR/USD 15M Both channels of linear regression are still directed upwards on the 15-minute timeframe, since the mood of traders at the beginning of the new week has not changed. Last Friday, a new Commitments of Traders (COT) report was released. According to this report, non-commercial traders reopened Buy-contracts and closed Sell-deals. Thus, the net position for the "non-commercial" category of traders, which is the most important and category of traders, has grown again, this time by 15,000 contracts, which is a high value (5,128 Buy-contracts were opened and 9,681 Sell-contracts were closed). Hence, the conclusion is that the mood of large traders has not changed at all over the past week. In principle, the same conclusion can be drawn by looking at the chart of the euro/dollar currency pair itself. The pair has been in the side channel since July 27, that is, for three weeks, after which the upward movement resumed. During all this time, traders managed to adjust the pair by a maximum of 200 points down, which is very little to be reflected in the COT report. At the same time, the euro continues to rise in price, and COT reports are likely to continue to show an increase in bullish sentiment. The fundamental background for the EUR/USD pair was extremely weak on Tuesday. No important macroeconomic reports were published that day, however, the dollar resumed to sharply fall for no apparent reason. However, the overall fundamental situation in America remains such that the next fall in the US dollar is not surprising. Traders will focus their attention on inflation in the European Union on Wednesday, the forecast for which is very low. Thus, it will not be difficult to surpass it, given the recovery of the European economy. At the same time, the euro has already risen in price quite strongly and at least a slight correction is needed. Thus, we believe that tomorrow, in almost any case, a correction to the trend line will begin, which the price may even try to overcome. Markets participants are unlikely to take note of tonight's release of the Fed minutes. Based on the above, we have two trading ideas for August 19: 1) Buyers stepped up their trading on Tuesday and again took the initiative into their own hands. The pair has reached the 1.1958 level, so we recommend buying the euro again while aiming for 1.2051 if traders overcome the target. In this case, the potential Take Profit will be about 80 points. 2) Bears could not go below the 1.1715 level, and now they still have to overcome the trend line in order to count on at least a small drop in the pair. We recommend opening sales after overcoming the support area of 1.1886-1.1910 and the upward trend line with the first target, the Senkou Span B line (1.1805). In this case, the potential Take Profit will be about 50 points. We recommend that you also explore the fundamental background in these articles: Overview of the EUR/USD pair. August 19. "Neither fish nor fowl". Americans are going to vote for Biden not because he is good, but because Trump is bad. Review of the GBP/USD pair. August 19. The US and China are in conflict again, this time over Huawei. The dollar falls back into the abyss and remains extremely oversold. Explanations for illustrations: Support and Resistance Levels are the levels that serve as targets when buying or selling the pair. You can place Take Profit near these levels. Kijun-sen and Senkou Span B lines are lines of the Ichimoku indicator transferred to the hourly timeframe from the 4-hour one. Support and resistance areas are areas from which the price has repeatedly rebounded off. Yellow lines are trend lines, trend channels and any other technical patterns. The material has been provided by InstaForex Company - www.instaforex.com |
| Posted: 18 Aug 2020 05:08 PM PDT 4-hour timeframe
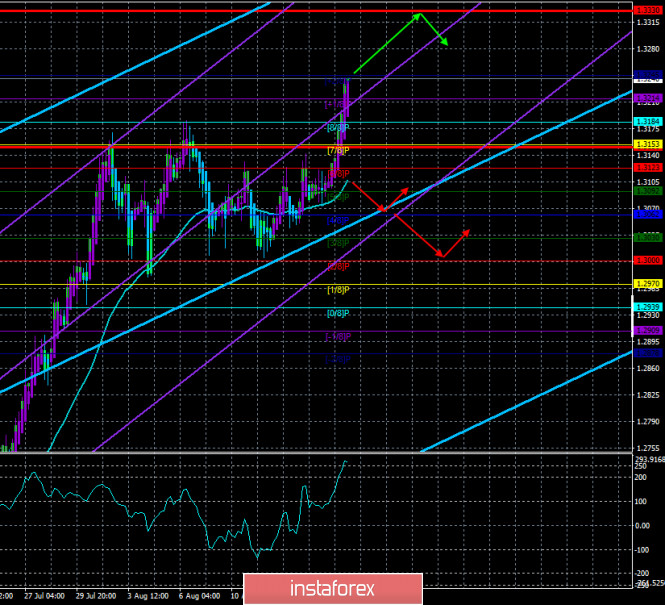
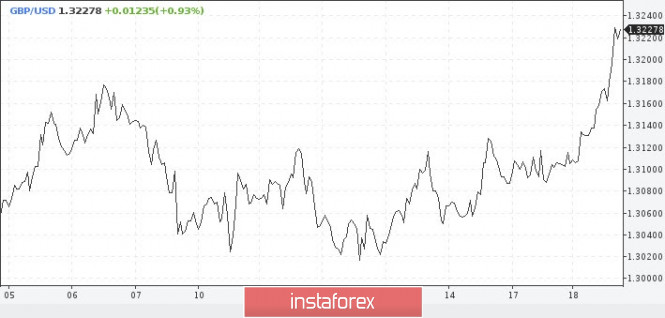
Technical details: Higher linear regression channel: direction - upward. Lower linear regression channel: direction - upward. Moving average (20; smoothed) - upward. CCI: 262.6622 The British pound, following the European currency, also resumed its upward movement on Tuesday, August 18, and managed to overcome the Murray level of "8/8" - 1.3184, from which it previously bounced several times. Thus, after several weeks of "trampling" in one place, we can state: the bulls again dominate the market, and the US dollar remains extremely weak. We did not see a normal correction for the pound/dollar pair, and the British currency remains very overbought because of this, which, by the way, is signaled by the CCI indicator, whose value now exceeds 250. And again, it is absolutely impossible to say that the reasons for the pair's growth lie in the strength of the British currency or the UK economy. Or in the positive news from the Foggy Albion. The euro currency and the pound are growing against the dollar almost synchronously, so the reasons should be found in the States. However, nothing extraordinary is happening in the States right now. It's just still bad. 1) The situation with "coronavirus" has changed a little for the better. For example, only 35,000 new cases of the disease were registered yesterday, and this value is falling from day to day. Thus, we can not say that the new fall in the US currency is associated with the COVID-2019 epidemic. 2) No macroeconomic statistics were published on Tuesday, so traders could not react to any bad report. However, we are forced to state that the economy's fall in the second quarter by 33% will be "reflected" in the US currency for a long time. 3) The situation with rallies and protests against the background of a racist scandal has also improved slightly. At least in most cities, popular riots have stopped. 4) The situation with China continues to deteriorate, but, thank God, at a fairly low rate, so there is reason to hope that with the change of power in the country (which is very likely), relations between Beijing and Washington will still improve a little. 5) The only thing that doesn't improve over time is the political crisis. And it's really bad here. Biden and Trump continue to pour mud on each other, sociological research suggests that Americans who support Biden are actually just against Trump. And we have already witnessed similar votes, when voters cast their votes not on the principle of "we choose their political program", but in order to solve certain issues (the parliamentary elections in the UK in December last year, when people voted not for the conservatives and Johnson, but for an early exit from the EU, which the conservatives and Johnson promised). As a result of such elections, not the best candidate usually comes to power. If, as in our case, there are only two candidates and one of them is obviously bad (in the opinion of the Americans themselves), then it seems that we will really have to choose the one who is less bad. And this role is perfect for Joe Biden, who just don't have time to remember during the Vice-presidency of Barack Obama, in recent months, when he was the main candidate of the Democratic party. But Donald Trump continues to conflict with Beijing and Chinese companies. Not so long ago, Washington imposed new sanctions against the Chinese technology giant Huawei. Recall that the US war with this company has been waged for several years. The American side accuses it and the equipment it produces of espionage. Donald Trump called the Chinese company a "disaster" that "did whatever it wanted on US territory". China, however, responds to any US sanctions very quickly and with mirror measures. This time Chinese Foreign Ministry spokesman Zhao Lijian said: "Recently, America, without any evidence, under the pretext of protecting national security, has taken various restrictive measures against Huawei and other Chinese companies. This is undisguised hegemonic behavior." According to the Chinese Foreign Ministry, Washington undermines the principles of fair competition, and China strongly protests such actions against China and its companies. At this time, the UK began another round of negotiations with Brussels on a comprehensive trade agreement. Many experts no longer believe that the parties will be able to reach an agreement, but the parties themselves continue to hold negotiations and continue to hope for a successful outcome. It is reported that this evening, Michel Barnier and David Frost will meet for dinner, and tomorrow the work of their negotiating groups will begin. Thus, this week it will be known whether the parties will make progress in the negotiations and whether there will be hope for the conclusion of a final agreement. The consumer price index for July is scheduled to be published on the third trading day of the week in the UK. This is a fairly important indicator, but unfortunately, traders can ignore it. First, the British pound, as we can see, does not need any reasons to continue growing against the dollar. Yes, the pair stood in one place for a few weeks, but then it resumed growth quite easily. Thus, even weak inflation is unlikely to significantly spoil the mood of traders who have completely forgotten about all the problems of the British economy. The evening publication of the minutes of the US Federal Open Market Committee meeting is likely to have even less chance to influence the movement of the currency pair. Thus, we believe that on Wednesday, August 18, technical factors will remain in the first place. We recommend continuing to trade the pound/dollar pair in accordance with the indications and signals of the "linear regression channels" system. For example, at the time of writing, both linear regression channels are directed upwards, as is the moving average line, and the Heiken Ashi indicator turns the bars purple, which also indicates a local upward movement. With such indicators, there is nothing left but to trade for an increase.
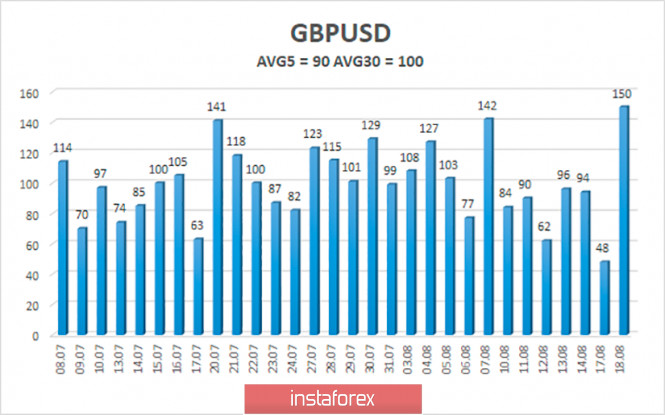
The average volatility of the GBP/USD pair is currently 90 points per day. For the pound/dollar pair, this value is "average". On Wednesday, August 19, thus, we expect movement within the channel, limited by the levels of 1.3150 and 1.3330. Turning the Heiken Ashi indicator downward will indicate a round of corrective movement. Nearest support levels: S1 – 1.3214 S2 – 1.3184 S3 – 1.3153 Nearest resistance levels: R1 – 1.3245 Trading recommendations: The GBP/USD pair resumed its upward trend on the 4-hour timeframe. Thus, today it is recommended to stay in the longs with the goals of 1.3245 and 1.3330 until the Heiken Ashi indicator turns downward. It is recommended to consider sell orders not before fixing the price below the moving average. At the moment, the price is extremely far from this line, so the trend is not expected to change in the near future. The material has been provided by InstaForex Company - www.instaforex.com |
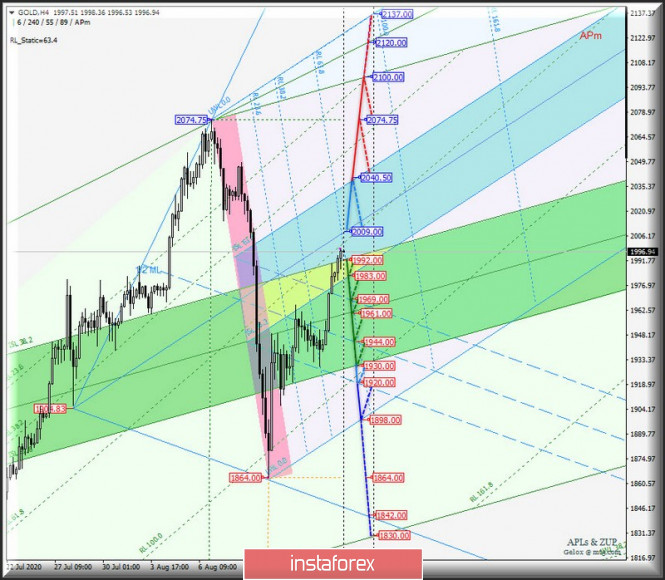
| Comprehensive analysis of movement options for Gold & Silver (H4) on August 18, 2020 Posted: 18 Aug 2020 05:08 PM PDT Minute operational scale (H4) Continuing to beat the US dollar? Review of options for the movement of Gold & Silver on August 18, 2020. ____________________ Spot Gold The movement of Spot Gold from August 18, 2020 will occur depending on the development and direction of the breakdown of the range:
A consistent break of the support level of 1992.00 on ISL38.2 Minute and lower bounds ISL38.2 (1983.00) equilibrium zone of the Minuette operational scale fork will determine the USD Spot Gold within the zone (1992.00 - 1961.00 - 1930.00) equilibrium of the Minute operational scale fork and channel 1/2 Median Line Minuette (1969.00 - 1944.00 - 1920.00). In case of breaking the Median Line Minuette - resistance level of 2009.00 - the upward movement of Spot Gold can be continued to the objectives:
Details of the Spot Gold movement since August 18, 2020 can be seen on the animated chart.
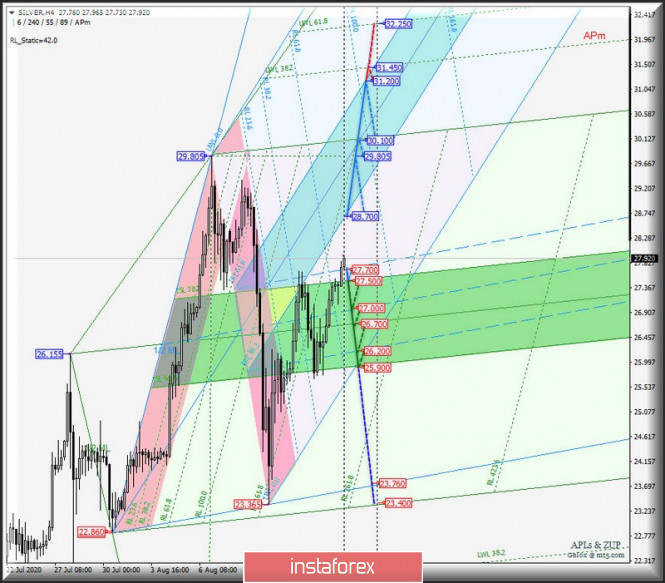
____________________ Spot Silver The development of the Spot Silver movement from August 18, 2020 will also be determined by the development and direction of the breakdown of the range:
Joint breakout of the support level of 27.700 on the upper border of the channel 1/2 Median Line Minuette and ISL38.2 Minute (27.500) make possible the continuation of the movement of Spot Silver in the zone equilibrium (27.500 - 26.700 - 25.900) of the Minute operational scale fork, taking into account the working out of 1/2 Median Line Minuette (27.000) and the lower border of the 1/2 Median Line Minuette (26.200). In case of breakdown of ISL38.2 Minuette - resistance level 28.700 - Spot Silver may continue its upward movement within the equilibrium zone (28.700 - 30.100 - 31.200) of the Minuette operational scale fork. Details of the Spot Silver movement options from August 18, 2020 are shown in the animated chart.
____________________ The review is compiled without taking into account the news background, the opening of trading sessions of the main financial centers and is not a guide to action (placing "sell" or "buy" orders). The material has been provided by InstaForex Company - www.instaforex.com |
| Posted: 18 Aug 2020 05:08 PM PDT 4-hour timeframe
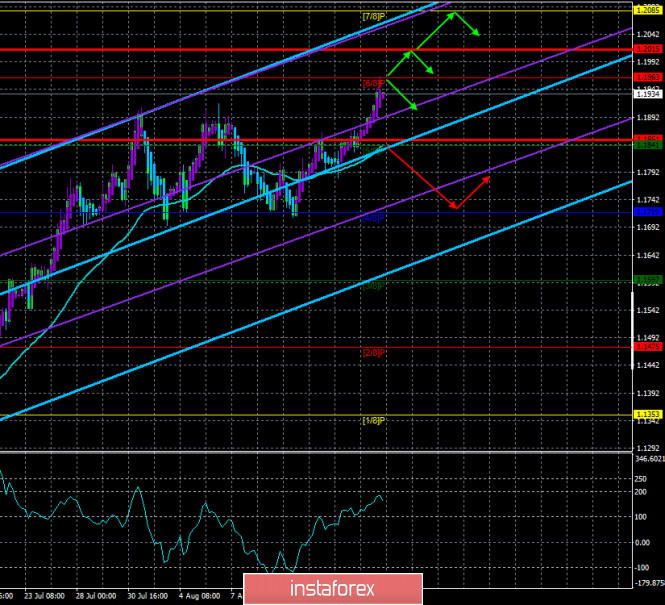
Technical details: Higher linear regression channel: direction - upward. Lower linear regression channel: direction - upward. Moving average (20; smoothed) - upward. CCI: 161.8946 The EUR/USD currency pair has been trading higher since August 12 after it failed to overcome the Murray level of "8/8" - 1.1719 for the third or fourth time. At the moment, everything is going to the point that the price will leave the side channel, where it was before three weeks ago. It seems that two hundred points of correction is the maximum that the US dollar can count on now. If this is the case and the correction is complete, and the markets are preparing a new round of upward trend, then the US currency is extremely bad. It turns out that market participants for three weeks did not find any reasons to correct the pair by at least 300-400 points, after an increase of 8-11 cents in three months. Traders did not find even technical reasons, and did not even want to fix a part of the profit on open long positions. So they don't believe in the dollar. The same opinion is reflected in the latest COT report, which showed that professional traders continue to increase their purchase contracts. Thus, the upward trend will continue again if in the near future the Heiken Ashi indicator does not urgently turn down and an urgent drop in quotes does not begin. Meanwhile, the most interesting information came from America. Recent research by the Wall Street Journal shows that more than 58% of voters who support Joe Biden's candidacy in the election actually oppose Donald Trump. About 50% of all respondents would vote for Biden if the election were held right now. However, almost 3/5 of those 50% will vote for Biden simply because they don't want to vote for Donald Trump. Statistics on the current US President are somewhat different. For Trump right now, 41% of respondents are ready to cast their votes, of which almost all voters really support Trump, and are not ready to vote for him simply because they do not want to vote for Biden. Thus, the results are as follows. Fewer Americans are still ready to vote for Trump than for Biden. And, most likely, the balance of power between the Republican and the Democrat will not change until November 3. Despite the fact that just a few days ago, another opinion poll showed that the gap in political ratings between opponents is narrowing and is already just a couple of percent. We even then questioned these results, because they looked too fantastic. Recent social research shows that the gap between Biden and Trump remains the same – about 10%. However, it should be noted that Trump voters are more aware of their choice. They choose Trump, and do not vote against another candidate. At the same time, former first lady Michelle Obama called Donald Trump the most wrong President of all and called for voting for Joe Biden in the election. "He had more than enough time to prove that he could do the job, but he jumped over his head. He just can't be what the country needs," Mrs. Obama said. Michelle Obama called what is happening now in the country "chaos" and said that the situation will not change under Donald Trump. The former first lady also criticized the President for his actions in suppressing rallies and protests, as well as his immigration policy. Donald Trump, who never had a word in his pocket, did not take long to respond to Mrs. Obama. He said that the administration of her husband, Barack Obama, was the most corrupt in US history. Recall that earlier, Donald Trump accused Barack Obama and other high-ranking Democrats of conducting surveillance of his election campaign in 2016 and tried in every possible way to prevent him from winning the election. Also, Donald Trump, speaking in Wisconsin as part of his election campaign, said that "if the Democrats in the US take the reins of government in their own hands, it will be the second Venezuela". In addition, Trump opposes mass voting by mail, believing that the election results can be falsified. "You can't send out 16 million ballots, no one knows who will actually receive them. They will be at the disposal of postal employees, who can take them in batches," the US leader said. This is the situation in America 2.5 months before the election. And it should be noted that everything that is happening now in the States clearly does not contribute to the growth of the US currency. Despite the fact that the US stock market is breaking records in the midst of the economic crisis, the US currency continues to depreciate. And experts, all as one, say that the recovery of the American economy will be extremely difficult and long. On Tuesday, August 18, no macroeconomic reports were published in the States. This was also the case in the European Union. However, this did not prevent traders from continuing moderate purchases of the euro currency and selling the dollar. On Wednesday, August 19, the EU and America will again not have any important macroeconomic publications, although the news calendar is not empty. The European Union will release the consumer price index for July, but we have repeatedly said that inflation is not an important indicator now. US inflation accelerated, according to the latest report, but the US dollar was not affected. Most likely, the same reaction of the markets will be tomorrow. In America, the publication of the minutes of the meeting of the Federal Open Market Committee is scheduled for the evening, which never causes a serious reaction from traders. Especially when no important decisions were taken at the meetings themselves. Of course, we do not recommend losing sight of this event, because anything can happen, surprises are not excluded. However, from our point of view, the macroeconomic background tomorrow will not have any impact on the mood of market participants. This means that technical factors will continue to be in the first place, according to which it is recommended to trade the euro/dollar pair. Both linear regression channels are still pointing upward, as is the moving average line. Thus, all trend indicators now support the continuation of the upward trend.
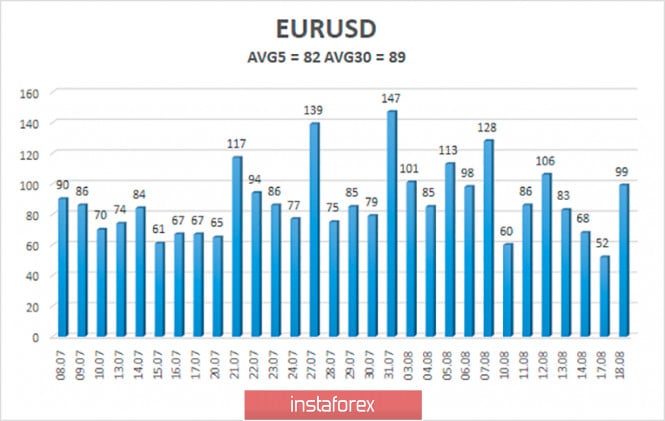
The volatility of the euro/dollar currency pair as of August 19 is 82 points and is characterized as "average". Thus, we expect the pair to move today between the levels of 1.1851 and 1.2015. The reversal of the Heiken Ashi indicator downwards signals a downward correction. Nearest support levels: S1 – 1.1841 S2 – 1.1719 S3 – 1.1597 Nearest resistance levels: R1 – 1.1963 R2 – 1.2085 R3 – 1.2207 Trading recommendations: The EUR / USD pair resumed its upward movement, managing to break out of the side channel. Thus, today it is recommended to continue trading for an increase with the goals of 1.2015 and 1.12085 as long as the Heiken Ashi indicator is directed upwards. It is recommended to consider short positions only after fixing the price below the moving average line with the first goal of the Murray level of "4/8" - 1.1719. The material has been provided by InstaForex Company - www.instaforex.com |
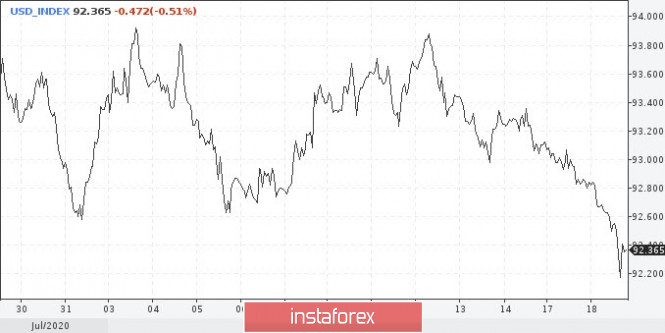
| Technical picture, like the fundamental, promises big problems for the dollar Posted: 18 Aug 2020 01:01 PM PDT The dollar has been growing for many years, but the coronavirus pandemic has confused all the cards, leaving its imprint on the American economy. Today, under the pressure of low yield of treasuries and gloomy macroeconomic data, the dollar fell to a 2-year low against a basket of competitors. The greenback was trading around 92.30 at the beginning of the US session. What is happening in the US economy and politics increasingly fuels the bearish beliefs of traders. At the end of last week, rates on the sale of the dollar increased to the largest value since May 2011, and, judging by the greenback's current dynamics, they continue to grow. Sales of the US currency look excessive, after a strong and prolonged fall, the dollar needs to be corrected. This may happen, but the trend is still downward. Market players are convinced that the dollar's fall will not end there. The greenback will remain under pressure due to the tense domestic political situation and the upcoming US presidential elections. In addition, the country has a high incidence of coronavirus compared to other developed countries. Market sentiment is also affected by the conflicting theme of new incentives, which is constantly overgrown with new and far from positive details. Representatives of the US Senate began to say that agreements will probably not be reached at the end. At this time, there were reports in the media about the plans of the Republicans to reduce the amount of stimulus. Meanwhile, Acting Chairman of the Council of Economic Advisers, Tyler Goodspeed, made it clear today that US President Donald Trump is not going to back down on incentives and will continue to push for his bill. Recall that Republicans insist on $1 trillion, and Democrats - $3 trillion. After this news, the dollar index fell to new lows at 92.20 at the moment. Investors continue to worry about the alleged deterioration in US-China relations. They expected an increase in tension ahead of the elections, but did not think that any concrete steps would follow. However, Trump contributed to the creation of a new rule that restricts Huawei Technologies' access to foreign-made chips. Innovation can have far-reaching consequences. Trump issued a new statement on Tuesday. He promised to punish companies that move production abroad, such as to China, and create jobs in another country. These companies will be subject to duties, and those who return from China to their homeland will receive tax benefits. Thus, Trump encourages companies to produce goods and services at home. America has high unemployment, and the election is 11 weeks away. It is worth noting that previously, the White House's policy in the trade war with China assumed pressure against Chinese companies like Huawei. Now, because of the pandemic, which Trump calls the Chinese plague, and probably from a certain despair, it was decided to go further and put pressure on American companies. Strong data were released on Tuesday. Housing construction in the US rose in July for the third consecutive month. This sector seems to be becoming a strong side of the American economy, which is extremely small now. However, surpassing the forecast did not save the greenback from falling, but it should be noted that it slowed down. The technical picture also does not promise anything good for the dollar. The first serious call for the greenback's fall sounded at the end of July, when the 94.70 level was broken. Now, when the bears continue to put pressure on the dollar, demonstrating their superiority, a new round of decline is expected. Two points are important at the moment - this is the long-term upward trend line, which began in April 2011, and the round psychological value of 90.00. These two points will be critical. If they can resist, the dollar will have a chance to return to the March levels, that is, above 100. In the event of a breakout, the greenback will go deeper. If anyone wins here, it is the euro. Due to the dollar's fall, traders maximized rates on the euro's growth. The 1.2000 mark is a matter of time, and the nearest one. Today, buyers of the main pair managed to bring the rate to 1.1960. As for the pound, it probably won't be able to take full advantage of the dollar's fall. Brexit is back in sight, and unwary traders of the British pound may face a stressful situation. The good performance of sterling, which shows today, as well as its resilience to gloomy economic data, was most likely based on the fact that investors pushed the Brexit story into the background. If there is no deal, the markets may begin to return the rate to previous levels. |
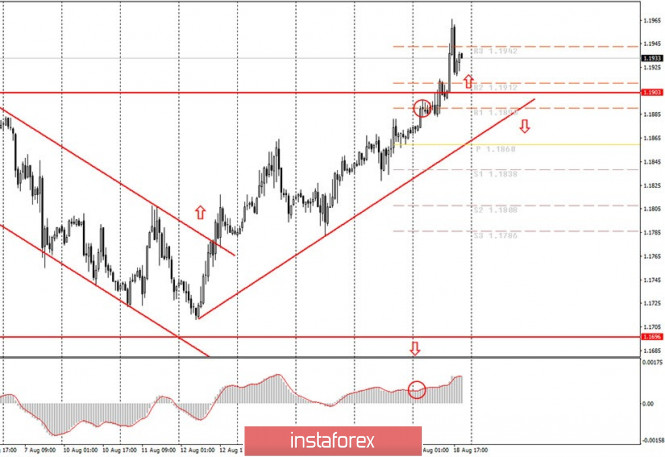
| Posted: 18 Aug 2020 11:30 AM PDT Hourly chart of the EUR/USD pair The EUR/USD pair continued its upward movement on Tuesday, August 18. The illustration shows that the last upward reversal of the MACD indicator is encircled in red and it formed tonight. Unfortunately, most traders and novice traders sleep at night, so few opened buy positions. However, they had such an opportunity in the morning, when the price had not yet gone very far upward. This is the market. Signals can be generated at any time of the day. Another thing is remarkable. The price has officially exceeded the 1.1903 level today, which we previously called the upper line of the sideways channel 200 points wide. Thus, only the upward trend line remains in action, which continues to make long positions relevant. All three resistance levels for today have been reached. Despite the fact that the pair dropped 35 points a few hours ago, the MACD indicator has not yet reversed downward, so long positions can still be kept open. However, we recommend closing them at the current levels. From a fundamental point of view, there was not much news for the euro/dollar pair again today. However, there is such a thing as a general fundamental background – these are events that have a long-term impact on a particular currency. For example, coronavirus is such a topic for the US dollar. However, the epidemic has begun to recede in the US in recent weeks, so we can not conclude that today's collapse in the dollar is somehow connected with the pandemic overseas. But the economic and political problems have not gone away. A striking example of a long-playing fundamental background is the overall fall of the US economy by 33% in the second quarter. Traders and investors understand that with such losses, recovery will take a long time and so they do not want to buy the dollar. In addition, the Democrats and Republicans can not agree on a package of financial assistance to the US economy (the money should be intended for the unemployed, small and medium-sized businesses), which also negatively affects the US currency's appeal in the Forex market. The European Union is set to publish inflation for July on Wednesday, August 19. This report usually has a big impact on any currency, but it may not have a proper impact at this time. First, the real value of inflation must differ from the forecast value in order for traders to start trading based on this. Secondly, after today's strong growth, a downward correction should follow. Perhaps it will pass at night, perhaps not. As long as the upward trend line remains relevant, we continue to recommend considering only long positions on the euro/dollar pair. The forecast for inflation in the European Union is 0.4% y/y. If the latest report exceeds this figure, then we can expect a new growth of the pair and the euro, but only if the price has time to adjust by the time this report is released. The following scenarios are possible on August 19: 1) Long deals on the pair at this time remain relevant, as the price continues to be above the rising trend line. Thus, at this time, we advise novice traders to wait for a new round of a downward correction, after which, wait for a new reversal of the MACD indicator upwards around next morning, and then enter the market again with purchases. In any case, the MACD indicator will turn down in the near future, as it cannot keep growing. 2) You are still advised to not consider selling the currency pair, since the price is above the trend line. We suggest novice traders to close the price under the trend line at the end of an hour, and in this case it will be possible to consider pulling down quotes while aiming for 1.1838 and 1.1808. However, now the price is too far from the trend line, therefore, in the near future it is unlikely that the price will settle below it. What's on the chart: Support and Resistance Levels are the levels that serve as targets when buying or selling the pair. You can place Take Profit near these levels. Red lines are the channels or trend lines that display the current trend and show in which direction it is preferable to trade now. Up/down arrows show where you should sell or buy after reaching or breaking through particular levels. The MACD indicator consists of a histogram and a signal line. When they cross, this is a signal to enter the market. It is recommended to use this indicator in combination with trend lines (channels and trend lines). Important announcements and economic reports (you can always find them in the news calendar) can seriously influence the trajectory of a currency pair. Therefore, at the time of their release, it is recommended to trade as carefully as possible or exit the market in order to avoid a sharp price reversal. Beginners in the Forex market should remember that not every single trade should be profitable. The development of a clear strategy and money management are the key to success in trading over a long period of time. The material has been provided by InstaForex Company - www.instaforex.com |
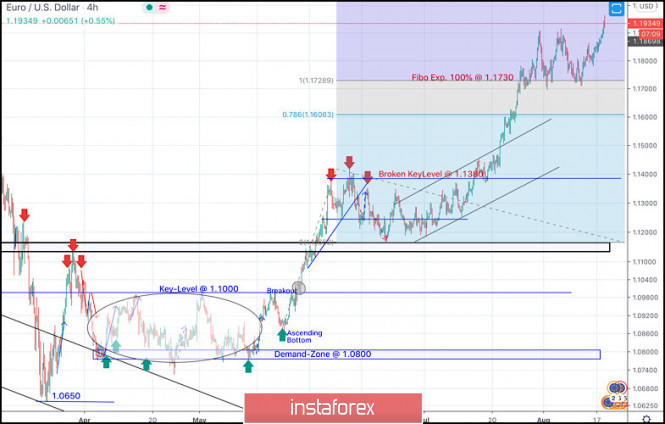
| August 18, 2020 : EUR/USD Intraday technical analysis and trade recommendations. Posted: 18 Aug 2020 09:55 AM PDT
On March 20, the EURUSD pair has expressed remarkable bullish recovery around the established bottom around 1.0650. Shortly after, a sideway consolidation range was established in the price range extending between 1.0770 - 1.1000. On May 14, evident signs of Bullish rejection as well as a recent ascending bottom have been manifested around the price zone of (1.0815 - 1.0775), which enhances the bullish side of the market in the short-term. Bullish breakout above 1.1000 has enhanced further bullish advancement towards 1.1150 then 1.1380 where another sideway consolidation range was established. Hence, Bearish persistence below 1.1150 (consolidation range lower limit) was needed to enhance further bearish decline. However, the EURUSD pair has failed to maintain enough bearish momentum to do so. Instead, the current bullish breakout above 1.1380-1.1400 has lead to a quick bullish spike directly towards 1.1600 (Fibonacci Expansion 78.6% level) which failed to offer sufficient bearish pressure. That's why, further bullish advancement pursued towards 1.1730 (Fibonacci Expansion 100% level) which failed to offer sufficient bearish rejection for a few days until Today. Bullish persistence above 1.1730 will probably favor further bullish advancement towards 1.2075 (161% Fibo Expansion Level) in the intermediate-term. On the other hand, bearish re-closure below 1.1730 indicates lack of bullish momentum and enhances further bearish decline initially towards 1.1600. Trade recommendations : Conservative traders should wait for the current bullish movement to pause and get back below 1.1730 as an indicator for lack of bearish momentum for a valid SELL Entry.T/P levels to be located around 1.1600 and 1.1500 while S/L to be placed above 1.1800 to minimize the associated risk. The material has been provided by InstaForex Company - www.instaforex.com |
| Donald Trump triggers another spike of EUR/USD Posted: 18 Aug 2020 09:38 AM PDT Today the EUR/USD pair tested the resistance level of 1.1940 - the upper line of the Bollinger Bands indicator on the daily chart. It cannot be said that this event was a big surprise: the clouds have been gathering over the American currency for a long time, so the next price spurt of EUR/USD looks quite natural. Buyers of the pair have not yet managed to overcome the resistance level and gain a foothold above it, but the "bid to win" is important here. The euro bulls once again demonstrated their dominance, not allowing the scales to tilt towards the south. And do not forget that at stake is the psychologically important 1.2000 mark, which will open the way for traders to the area of above 1.20. That is why there is such excitement around the resistance level of 1.1940: by and large, this is a price citadel of bears, breaking which the bulls can develop a large-scale bullish trend. What is going on? The dollar is weakening for many reasons, among which there are several main ones. As you know, American politicians have been trying for several months to agree on a bill on the allocation of additional assistance to the US economy. Initially, Congressmen rejected the $ 3 trillion Democrats' project. This document was able to pass in the Lower House of Congress (which is controlled by the Democratic Party), but they could not pass it through the Upper House (Senate), which is controlled by the Republicans. A little later, namely at the end of July, the White House submitted to Congress its version of the new stimulus package, which turned out to be much more modest (one trillion dollars). But here a mirror situation occurred: the Republicans need the votes of the Democrats who refused to make serious concessions to their opponents, especially on the eve of the presidential elections scheduled for November. In early August, White House economic adviser Larry Kudlow announced that talks on a stimulus package were "deadlocked." Since then, the dollar index has been gradually sliding down, despite rising inflation and a recovery in the US labor market. Macroeconomic reports have faded into the background, but the political battles within the triangle "Democrats - Republicans - White House" attract the attention of traders. Last week, US Treasury Secretary Stephen Mnuchin said that negotiations in Congress could be resumed "in the near future", and the parties are ready to make mutual concessions. Democratic representatives indirectly confirmed the minister's words, saying that they are ready to revise the expenditure side of the bill, reducing its volume to two trillion. And although many experts doubted that the negotiations would end successfully, everyone agreed that additional stimulus was needed for the American economy. That is why today's comments from a White House spokesman acted as a trigger, putting the strongest pressure on the dollar. A representative of the Trump Council of Economic Advisers in an interview with one of the TV channels actually denied the words of the Treasury Secretary, saying that the President still insists on the adoption of the bill in its original form. However, he categorically rejected the idea of increasing its volume to two trillion dollars. This means that the political confrontation between the Democrats and the White House continues, and the bill on the new stimulus package will remain a draft - at least for the foreseeable future. The American currency was already under pressure, amid the strengthening of anti-Chinese rhetoric on the part of Trump and the strengthening of the political positions of Trump himself in the key states of the country (if earlier the head of the White House lagged behind Democrat Joe Biden by 14-15%, then according to the latest data, the gap is 1-2%). But today's events have finally knocked down the dollar bulls: this allowed the euro bulls to overcome the intermediate resistance level of 1.1900 and test the main resistance level of 1.1940. Interestingly, the market neglected the strong data released today on the construction sector: the volume of new housing construction in the US jumped 22.6% in July. But the market remained indifferent to these figures. All this suggests that the EUR/USD pair will remain at the mercy of political jitters that put pressure on the greenback. How to trade? Such impulse movements are usually followed by a downward correction. In this case, the price may roll back to the base of 1.9. The 1.1900 mark now acts as a support level. If the pair does not pull back below this target, it will be possible to consider buying, with the first target at 1.1940 (the upper line of the Bollinger Bands indicator on the daily chart) and further to the borders of 1.2. If buyers manage to gain a foothold above 1.1940 today, thus making a "blitzkrieg", then in this case, long deals to the key level of 1.2000 can be considered. The material has been provided by InstaForex Company - www.instaforex.com |
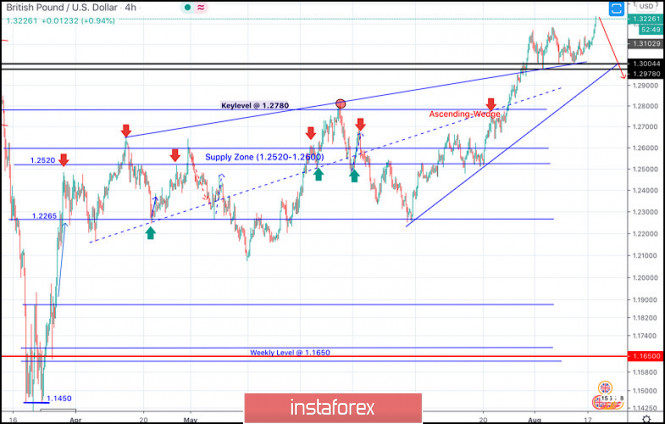
| August 18, 2020 : GBP/USD Intraday technical analysis and trade recommendations. Posted: 18 Aug 2020 09:28 AM PDT
In the period between April and June 2020, the GBPUSD has been moving sideways within the depicted consolidation range extending between (1.2265 - 1.2600) Transient bearish breakout below 1.2265 (consolidation range lower limit) was demonstrated in the period between May 13 - May 26, denoting some sort of weakness from the ongoing bullish trend. However, immediate bullish rebound has been expressed around the price level of 1.2080 bringing the GBP/USD back towards 1.2780 (Previous Key-Level) where another episode of bearish pullback was initiated. Short-term bearish movement was expressed towards 1.2265 where Significant bullish rejection was originated bringing the GBP/USD pair back towards 1.2780 where the mid-range of the depicted wedge-pattern failed to offer enough bearish rejection. Intermediate-term Technical outlook for the GBP/USD pair remains bullish as long as bullish persistence is maintained above 1.2780 (Depicted KeyLevel) on the H4 Charts.On the other hand, the pair looks overbought after such a quick bullish movement. Hence, upcoming bearish reversal shouldn't be excluded provided that early bearish breakout occurs below 1.2980 (the depicted wedge pattern upper limit). Trade recommendations : Technical traders are advised to wait for any upcoming bearish breakdown below 1.2980 as a valid SELL Entry. Initial T/p level is to be located around 1.2780. On the other hand, bullish persistence above 1.2980 invalidates this trading scenario. The material has been provided by InstaForex Company - www.instaforex.com |
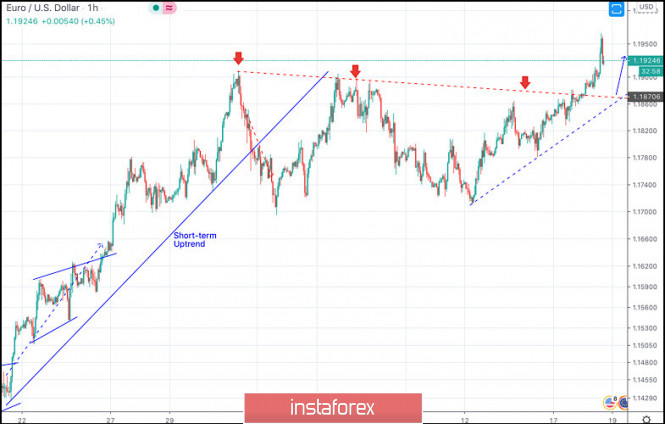
| August 18, 2020 : EUR/USD daily technical review and trade recommendations. Posted: 18 Aug 2020 08:50 AM PDT
The EUR/USD pair has been moving-up since the pair has initiated the depicted short-term uptrend line on July 21. By the end of July, a resistance level was formed around 1.1900 which prevented further upside movement for some time and forced the pair to have a downside pause towards 1.1715 in the form of a Wedge-Pattern.On August 12, a new short-term uptrend line was initiated around 1.1715. Since then, the EURUSD pair has been moving upward until Yesterday when we had a breakout above the previously mentioned resistance zone. Short-term outlook turns positive for the pair. Hence, BUY Positions are preferred at the current time. Hence, Intraday traders should wait for downside pullback to retest the backside of the broken downtrend line around 1.1860-1.1880 for a valid BUY Position. Initial target would be located around 1.1950 and Stop Loss should be set at 1.1820. The material has been provided by InstaForex Company - www.instaforex.com |
| Will ETH rise to $500? Ethereum price prediction Posted: 18 Aug 2020 08:18 AM PDT Cryptocurrency experts, inspired by the growth of the second most popular digital asset, predict a rise in Ethereum to $500. However, the digital currency may also decline despite good prospects and a surge of interest in ETH. Since the beginning of this year, Ethereum has advanced by 220%, surging from $130 in January to $430 in August. During the COVID-19 pandemic, ETH growth was put on halt, but then it gained momentum again. According to analysts, the second most popular digital currency has every chance of hitting $500 by the end of this year. The potential take-off of a virtual asset is favored by a number of factors, including enormous enthusiasm of crypto investors. Experts are sure that active development of the Decentralized Finance (DeFi) will prompt the growth of Ethereum. Decentralized Finance system includes a number of services and applications that allow users to directly work with cryptocurrency. Currently, the turnover in this sector is $8 billion and it continues to expand. Most of the DeFi protocols are run through the ETH platform which makes the digital asset more and more expensive. Another reason for Ethereum to rise in value is the major upgrade of its blockchain network in 2021. After the upgrade, users will be able to increase the amount of ETH coins by storing them in the wallet without much effort. Notably, most of the DeFi applications run on the Ethereum blockchain network. That is why the number of transactions and the size of commissions have increased significantly. Over the past 2.5 months, the average commission fee on the ETH network has skyrocketed by 1,600%. Ethereum has long remained undervalued, but now it is the time for it to shine. Increasing popularity of the DeFi projects has largely supported the altcoin, and this scenario may continue in the future. Many crypto market participants see ETH as the main investment vehicle for the next two to three years. This trend is gradually gaining momentum. The material has been provided by InstaForex Company - www.instaforex.com |
| Gold continues to rally amid falling dollar Posted: 18 Aug 2020 08:04 AM PDT
The price of gold is up by 1% Tuesday morning allowing it to step over its strategically and psychologically important mark of $ 2,000 per troy ounce. This was due to another recorded downward correction of the US dollar to the lowest values for the last two years. At the same time, market participants are preparing for the release of the new minutes of the meeting of the US Federal Reserve System. Gold has already risen in price by 1.08% and is now trading at $ 2,007.07 per troy ounce. The level of support for the metal is at around $ 1,923 per troy ounce, while resistance, in turn, is $ 2,005.35 per troy ounce. Now everything is on the side of the precious metal. Firstly, gold is supported by a very unstable situation in the currency markets: the dollar falls, investors stop trusting it, and the precious metal continues to move up. The US dollar ceases to satisfy market participants as a defensive asset. In addition, the weak economic performance of the US further alarms investors, as it indicates a long-term outlook for the dollar's decline. There are no surprises for traders in turbulent times, complicated by the coronavirus pandemic, so the "safe haven" gold is again coming to the fore. In this regard, it is worth noting that the purchase of the precious metal will continue, which will undoubtedly lead to even greater price surges and new record levels, especially since support for it is also provided by a soft stimulating policy against the backdrop of an increase in the incidence of coronavirus infection. Nevertheless, temporary corrections in the precious metals market are quite possible, so you need to be ready for when this time finally comes and prepare yourself not to fall into unnecessary panic. Silver futures for September delivery rose 1.07% today, pushing it to $ 27.962 per troy ounce. Palladium also gained 0.82% to hit $ 2,217.81 an ounce. Platinum jumped even more, by 2.07%. Its current value is $ 969.23. Copper futures, on the other hand, showed a slight drop of 0.05%. Its value is equivalent to $ 2.9065 per pound. The material has been provided by InstaForex Company - www.instaforex.com |
| EUR / USD: dollar continues to fall, euro maintains positive momentum Posted: 18 Aug 2020 07:37 AM PDT
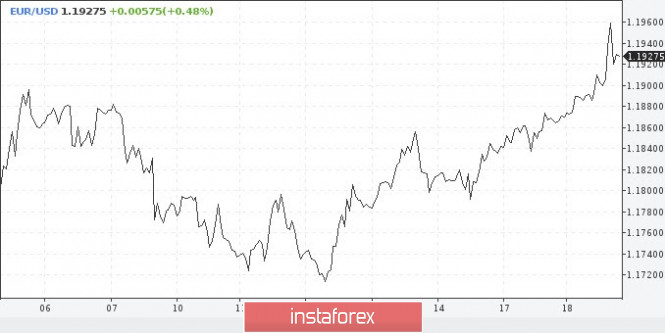
The greenback has been depreciating against its main competitors for the fifth trading session in a row. On Tuesday, the USD index updated two-year lows around 92.14 points. According to experts, the greenback was hit by a triple blow from the declining yield of US government bonds, weak US statistics, and reduced demand for defensive assets. The rise in technology stocks provided a positive backdrop for the markets and undermined demand for the dollar as a safe haven. At the same time, the worse-than-expected value of the Empire Manufacturing index of manufacturing activity in New York strengthened traders' bearish views on the US dollar. In addition, the level of overdue mortgage payments in the United States showed the largest quarterly growth on record. Commonwealth Bank of Australia said that "The high rate of delinquencies over a long period could wreak havoc on the American banking system. A weakened banking system can hold back the recovery of the national economy, as it did after the 2008 crisis. " Moreover, there are fears that the failure of the White House and the US Congress to agree on the next stimulus package could lead to a severe recession in the US economy. According to JPMorgan experts, each month of suspension of the federal unemployment assistance program may result in a 0.4% reduction in US GDP and a 0.9% depreciation of the USD exchange rate. "The dollar's fall is not over yet, so we disagree with those who argue that the sale of the US currency has become excessive," strategists at Mizuho Bank said. "There is a fairly positive momentum for the euro, so there is reason to believe that the EUR / USD pair will rise much higher," they added. The euro has risen almost 12% against the US dollar since mid-March when EUR / USD hit its 35-month low around 1.0640. A statement from the Bank of America stressed that "The decision of EU leaders to create a fund for economic recovery in the region was a catalyst for positive investor sentiment towards the euro, and the negative attitude towards the dollar was caused by expectations of some weakening of its status as a reserve currency," - EUR / USD continues to develop an upward trend, recovering above the key 1.19 level and testing the area of peak highs of 2020. It is assumed that a pure breakdown of this area will switch traders' attention to the important level of 1.2000, near which the pair was last seen in early May 2018. The material has been provided by InstaForex Company - www.instaforex.com |
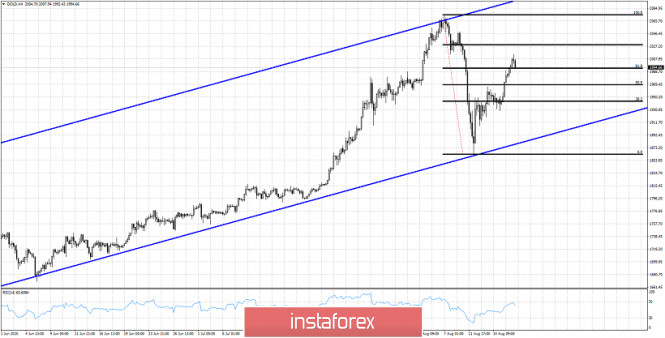
| Short-term technical analysis of Gold for August 18th, 2020 Posted: 18 Aug 2020 07:21 AM PDT Gold price remains inside the bullish medium-term channel. Trend remains bullish also in the short-term, however traders should keep in mind that another pull back close to the lower channel boundary is justified and very possible.
Black lines - Fibonacci retracement Gold price is showing reversal signs around the 61.8% Fibonacci retracement level of the latest downward move. A creation of a lower high around $2,000 would not be a good sign for bulls. Minimum expectations for a pull back would be at $1,900-$1,920 area. So I would not be very optimistic at current levels. Bulls need to be cautious. Short-term support is found at $1,980. Breaking below it will open the way for a move towards $1,920. Aggressive traders could try a short position now at $1,994 with stops at $2,015 and target at least $1,920-$1,900. The material has been provided by InstaForex Company - www.instaforex.com |
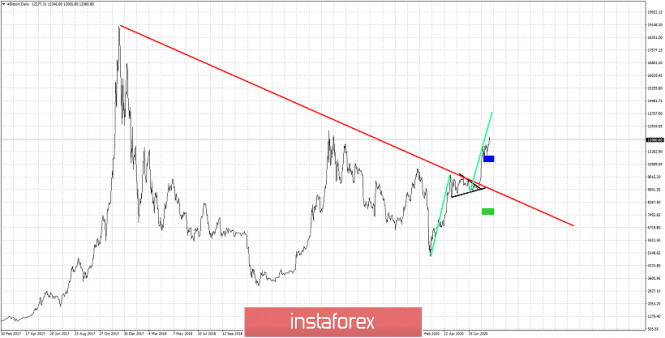
| What is our next Bitcoin target? Posted: 18 Aug 2020 07:16 AM PDT Bitcoin has reached our triangle breakout target of $11,000 and is staying above it making new higher highs. Trend remains bullish after the breakout and we see $13,000 as the next potential stop for the popular cryptocurrency.
Black lines - triangle pattern Blue rectangle- triangle breakout bullish target Green rectangle- triangle breakout bearish target Green lines - equal size upward move BTCUSD is making higher highs and higher lows. In a previous analysis we noted the importance of resistance at the $9,500 price level and that a break above it will open the way for a move towards $11,000. Now price has surpassed this target and our next target would equal the first upward move from around $5,000 to $9,800. This brings price near $13,000. We remain bullish as long as price is above $11,150. The material has been provided by InstaForex Company - www.instaforex.com |
| Ichimoku cloud indicator analysis of USDJPY for August 18th, 2020. Posted: 18 Aug 2020 07:09 AM PDT Using the Ichimoku cloud indicator we have a new bearish signal for USDJPY in the Daily chart. Trend remains bearish as price is still below the Daily Kumo (cloud) but today's break below the tenkan-sen and kijun-sen provides even more confirmation of the bearish scenario.
|
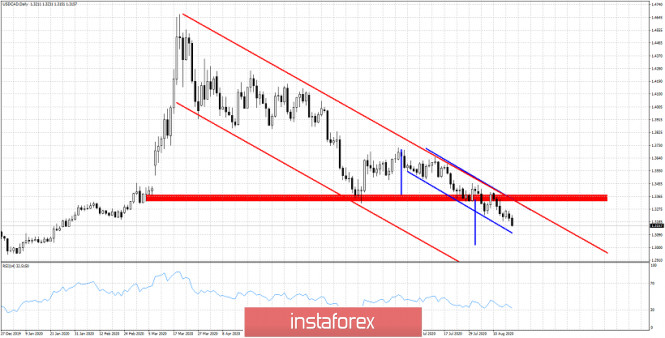
| USDCAD getting closer to our 1.30 target Posted: 18 Aug 2020 07:03 AM PDT USDCAD remains in a bearish trend. Price has given an initial bearish signal back in 1.35 and has since then continued making lower lows and lower highs. Price has made an important resistance at previous key support at 1.3350.
Blue lines - short-term bearish channel Blue vertical lines - size of downward move expected Red rectangle- key resistance USDCAD is approaching our 1.30 target since it broke below 1.3350. Now it is trading at 1.3160 and I expect price to continue lower. The RSI is still not in oversold levels. Resistance is found at 1.3350 and as long as price is below this level we remain bearish. The material has been provided by InstaForex Company - www.instaforex.com |
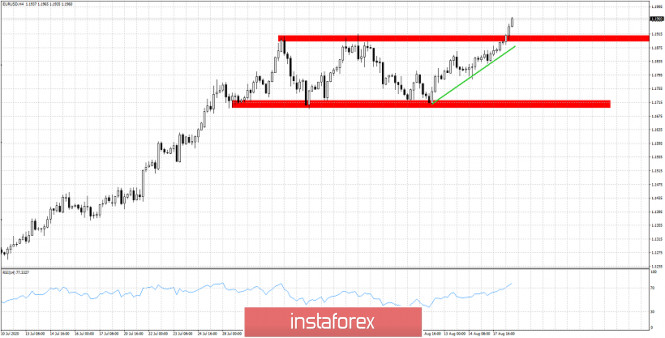
| EURUSD breaks above trading range Posted: 18 Aug 2020 06:59 AM PDT EURUSD breaks above resistance today and is making new 2020 highs. Price is making higher highs and higher lows and it seems that the consolidation period has ended and we are now again in a bullish move.
Green line- short-term support As long as price is above the green short-term support trend line I expect this upward move to continue above 1.20. Support is now at the previous resistance at 1.1890-1.19 area. Breaking below this level could bring price back towards 1.18. Next resistance and upside target is at 1.21. Trend remains bullish. The material has been provided by InstaForex Company - www.instaforex.com |
| Evening review on August 18, 2020 Posted: 18 Aug 2020 06:11 AM PDT
The EURUSD pair is coming out of 18-day consolidation below 1.1900. Looking back, we saw a way out of consolidation below 1.1400, and further growth by 500 points to 1.1900. By this logic, 1.2400 seems attainable. Further, the monthly candlestick is clearly bullish, thus those who considered purchases from 1.1810 with a stop at 1.165, the stop is at the opening point of the month. It makes sense to hold in time until the end of August. If you look at the pullback, then you need to see either a rollback on a daily basis to the green line of the Williams alligator, or a rollback to the red alligator by an H4 chart. Then go up on a new entry. You may consider purchases from the green average alligator at H4 which is now at 1.1880. The material has been provided by InstaForex Company - www.instaforex.com |
| US and Asian stocks under pressure while European stock markets doing great Posted: 18 Aug 2020 06:01 AM PDT Yesterday, the main stock indexes were trading mixed on the US stock exchange. Today, the indexes are still trading sideways without any particular direction. Thus, Standard & Poor's 500 Index once again approached its record high but failed to break through this level, since the activity of investors in the market was extremely low. It seems that market participants prefer not to rush until the new stimulus package in the United States is finally adopted. The Dow Jones Industrial Average fell 0.31%, or 86.11 points, when closing the trade on Monday, having settled at the level of 27,844.91. The S&P 500, on the contrary, showed an increase of 0.27%, or 9.14 points. It was last seen at the level of 3,381.99 points. During the day, the stock index managed to reach the high of 3,386.15 points and even broke above this mark. Yet, when closing the session, the S&P 500 moved below it. The index has been testing this important level for the second week in a row. However, it turned out to be a strong level of resistance. Nasdaq Composite Index rose 1%, or 110.42 points, moving closer to the 11,129.73 mark, thus hitting a new high. US energy stocks and the shares of financial companies were performing quite well. This uptrend supported the US stock market, as it was a signal of the economic recovery in the country. Recently, however, the pace of growth has slowed down due to the stalemate in the negotiations between Democrats and Republicans over the new stimulus package. Besides, the escalation of the conflict between Washington and Beijing put additional pressure on the markets, especially when the meeting on trade agreement has been delayed. The news about restrictions against China's telecommunication companies, including Huawei Technologies Co. and its key components, raised more worries among investors. In addition, the US authorities have published a list of 38 companies that are now prohibited from exporting technology from the US without obtaining a special license. The US leader also said that he was not going to stop here and that his plans included further pressure on China. He suggested adding another Chinese giant, Alibaba, on the sanctions list. If the situation deteriorates, then in the near future the US stock exchange will have a hard time. This morning, the Asian stock market also showed mixed dynamics. Asian stocks are still under pressure from the tensions between the United States and China and the uncertainty around the next stimulus package in the US. Today, Japan's Nikkei 225 Index was down 0.12%. Shanghai Composite Index climbed 0.51%. In contrast, the Hang Seng Index went down 0.1%. South Korea's Kospi Index dropped significantly by 2.3%. Australia's S&P/ASX 200 Index rose 0.74%. The Asian stock market indicators were affected by the new restrictive measures imposed on the Chinese company Huawei. Moreover, the American leader said that he planned to continue his restrictive policy. Last Friday, Donald Trump signed an executive order which invalidates the purchase of TikTok app by the Chinese company ByteDance. At the moment, a large company Oracle is negotiating to purchase the assets of the controversial application. Microsoft Corporation also announced its plans to acquire TikTok. In the meantime, the ongoing issue of adopting the next relief package is going to be resolved soon. Reportedly, US lawmakers are called back from summer holidays in order to put an end to this long-lasting story. This sparked enthusiasm in the markets which were already losing hope. On the other hand, the European stocks are doing great today. In the early trade, the indexes were fluctuating and trying to go into negative territory. Later in the day, the stocks stabilized and entered the green zone. All bad the news that scares Asia and America so much has the opposite effect in Europe. European investors continue to closely monitor the situation with the spread of coronavirus. According to the latest data, the number of infected people has already surpassed 21.881 million cases, which is 209 thousand more compared to yesterday's reports. Of course, this raises some concerns among market participants. The Stoxx Europe 600 Index, the general index of large enterprises in the region, rose by 0.1% in the morning trade and moved to 369.64 points. The UK FTSE 100 Index climbed 0.13%. Germany's DAX jumped 0.21%. The French CAC 40 index increased by 0.18%. Italy's FTSE MIB Index gained 0.28%. And the best performer today was the Spanish IBEX 35 which jumped 0.62%. The material has been provided by InstaForex Company - www.instaforex.com |
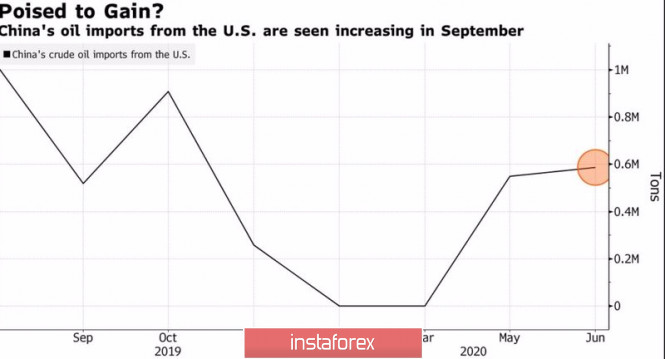
| Posted: 18 Aug 2020 05:57 AM PDT The oil market has always been dependent on politics. It used to be said that the price of black gold will change if the Prince of Saudi Arabia sneezes. In 2020, Donald Trump put an end to the oil war between Moscow and Riyadh. Currently, China is increasing purchases of American energy products, although it has its own reserves in excess, which suggests that there is no policy here either. Finally, Joe Biden's victory in the US presidential election may cost the "bulls" on Brent and WTI dearly. The Democrat's slogan "make America great again!" suggests a variety of environmental programs, including an active shift to electric vehicles, which could seriously hit global demand for oil and petroleum products. According to OPEC estimates, global demand for black gold in 2020 will be 90.6 million b/d, which is 9.1 million b/d lower than in 2019, and 9.1% less than in the previous forecast of the authoritative organization. The cartel also lowered its estimate of a reduction in global GDP from 3.7% to 4%. The IEA paints an equally bleak picture: the forecast for global demand was lowered by 240 thousand b/d to 97.1 million b/d, which is about 3 million bd below the pre-crisis level. Both the International Energy Agency and OPEC link the dynamics of oil consumption to the dynamics of the global economy, citing, among other things, the growing number of COVID-19 infections in the United States. Nevertheless, the market is looking at US stock indices that are ready to rewrite historical highs, and believes that everything will be different. This cannot but affect Brent and WTI. The North Sea variety is confidently holding near the upper limit of the consolidation range of $ 39-46 per barrel. Investors hope that in fact everything will turn out to be much better than the IEA and OPEC forecast, including due to Beijing's active increase in purchases of American energy goods. Vortexa estimates, based on pre-booking tankers, that 14 million barrels will be loaded in September, twice as much as in August. Dynamics of Chinese imports of American oil
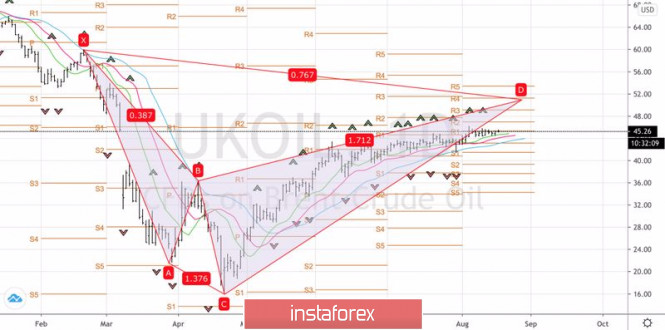
There is an opinion in the market that such activity of the Middle Kingdom is due to politics, because it still stores large reserves of black gold, and the prices of the United States and its Middle Eastern competitors do not differ much. As for the supply side, the fulfillment of OPEC+ commitments to reduce production by 95-97% in July calmed the financial markets. Given the decline in the number of drilling rigs from Baker Hughes to a 15-year low, the decrease in US oil reserves for 3 consecutive weeks and the weakness of the US dollar, the "bulls" for oil can sleep well. It seems that nothing is threatening them yet, and the probability of Brent going beyond the upper limit of the medium-term consolidation range of $ 39-46 per barrel looks more preferable than the chances of breaking the lower limit. The strategies described in the previous article for bringing the North Sea variety to the surface at the level of $ 45 work. A successful assault on the resistance at $ 46 per barrel will allow you to increase long positions. The target is still $ 51, where the target is located at 78.6% for the "shark" pattern. Brent, the daily chart
|
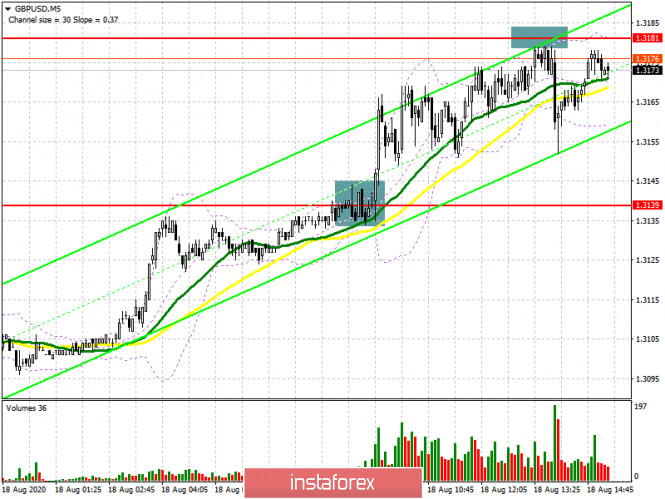
| GBP/USD: plan for the American session on August 18 Posted: 18 Aug 2020 05:57 AM PDT To open long positions on GBPUSD, you need: Buyers of the pound immediately achieved a breakdown of the resistance of 1.3139, but they could not form a good entry point for us. If you look at the 5-minute chart, you will see that after the breakout of 1.3139, the pair did not return to this level and did not make it a top-down test. But who was more attentive, remembered the level of 1.3181, from which I recommended in my morning review to open short positions immediately on the rebound, which led to the expected downward correction of 30 points within the day. Now, the goal of the bulls is to return to the level of 1.3181 again and fix on it, which forms a good entry point into long positions to strengthen the bullish trend. In this case, the targets will be the highs of 1.3238 and 1.3265, where I recommend fixing the profits. In the scenario of no support from major players and a decline in the pound in the afternoon, you can still open long positions on a rebound from support 1.3139 or from a larger minimum 1.3074, counting on a rebound of 30-40 points within the day.
To open short positions on GBPUSD, you need: The bears' task for the second half of the day is to protect the resistance of 1.3181, and while trading will be conducted below this range, we can expect a decline to the support area of 1.3139, but, to be honest, the chances are quite small. Only a consolidation below 1.3139 will increase the pressure on the pound, which will lead to a larger downward movement to the support of 1.3074. If the bullish trend continues to develop in the second half of the day, then after the breakout of the resistance of 1.3181, I recommend not to rush to open short positions, but wait for the update of the maximum of 1.3228 and sell the pound from there for a rebound in the expectation of a correction of 30-40 points within the day. A larger resistance is seen in the area of 1.3268.
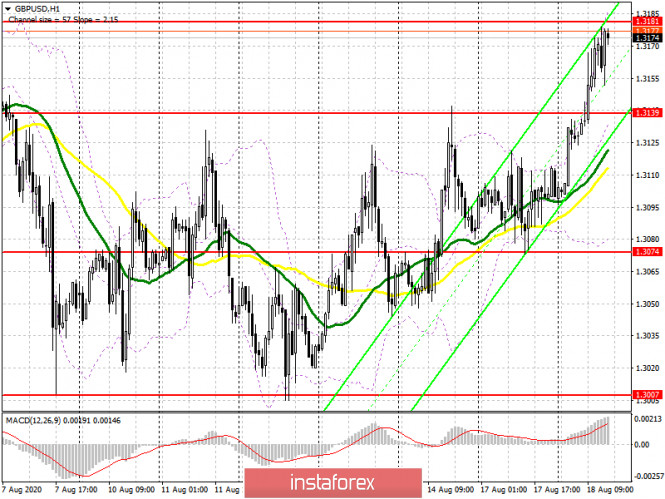
Signals of indicators: Moving averages Trading is conducted above the 30 and 50 daily averages, which indicates the development of a bull market. Note: The period and prices of moving averages are considered by the author on the hourly chart H1 and differ from the general definition of the classic daily moving averages on the daily chart D1. Bollinger Bands In case of a decline, the pair will be supported by the lower border of the channel at 1.3074, from where it is possible to open long positions immediately for a rebound. Description of indicators
|


| You are subscribed to email updates from Forex analysis review. To stop receiving these emails, you may unsubscribe now. | Email delivery powered by Google |
| Google, 1600 Amphitheatre Parkway, Mountain View, CA 94043, United States | |
No comments:
Post a Comment