
Forex analysis review |
- Hot forecast and trading signals for the GBP/USD pair on August 20. COT report. Trump is going to end his dependence on China
- Hot forecast and trading signals for the EUR/USD pair on August 20. COT report. Traders started taking profits on long positions
- Overview of the GBP/USD pair. August 20. Traders are not interested in the negative from Foggy Albion. The next in line to
- Overview of the EUR/USD pair. August 20. Is Joseph Biden the American version of Jeremy Corbyn? What can a Democratic presidential
- USD/CAD. Weak Canadian inflation and new hopes for dollar bulls
- Technical analysis and trade signals for beginners. How to trade EUR/USD on August 19? Analysis of trade on Wednesday with
- August 19, 2020 : EUR/USD daily technical review and trade recommendations.
- August 19, 2020 : EUR/USD Intraday technical analysis and trade recommendations.
- August 19, 2020 : GBP/USD Intraday technical analysis and trade recommendations.
- Gold drops suddenly
- GBPUSD and EURUSD: Pound's inflation and Investors' reaction on the Fed minutes
- European stock indicators are growing, but American and Asian stocks cannot determine the dynamics
- USDCAD follows our plan and trading strategy.
- Short-term Ichimoku cloud indicator analysis of EURUSD for August 19, 2020
- Short-term trading plan for Gold
- GBP/USD analysis on August 19. UK inflation rate boosts demand for GBP. Markets eager to invest in pound.
- Analysis for EUR/USD on August 19. Politics prevents the dollar from rising. Wave counting is getting more complicated, and
- GBP/USD: plan for the American session on August 19
- Fed minutes may not support the dollar, correction may be expected
- EUR/USD: plan for the American session on August 19
- Comprehensive analysis of movement options for EUR/USD & GBP/USD (H1) on August 19-21, 2020
- Gold loses momentum for growth
- Oil prices: to rise or to fall?
- BTC analysis for August 19,.2020 - Completion of the ABC downside correction and potential for the upside continuation
- Analysis of Gold for August 19,.2020 - Potetnial end of the downside correction and continuation of the up-trend
| Posted: 19 Aug 2020 06:59 PM PDT GBP/USD 1H The GBP/USD pair began a downward movement in the morning of August 19, failing to reach the third resistance level of 1.3284. And so there are reasons to assume the end of the fairly long upward trend. Especially if you consider a much weaker fundamental basis for this trend. Therefore, overcoming the support area of 1.3157-1.3181 will make it possible for the pair's quotes to continue moving down. It is not yet possible to say for sure that the bears have taken the initiative in the market, since most likely, the current drop in quotes is due to buyers closing long positions. GBP/USD 15M The lower channel of linear regression turned down on the 15-minute timeframe, signaling the possible beginning of a new downward trend. The latest Commitments of Traders (COT) report for the British pound, which was released last Friday, turned out to be almost an exact copy of the report on the euro currency. As for the euro, large traders opened new Buy-contracts in the reporting week (2,569) and closed Sell-contracts (8,405). Thus, the net position for non-commercial traders increased by almost 11,000 during the reporting week, which, in fact, means an increase in bullish sentiment. We could draw the same conclusions based on the nature of the pair's movement itself. Given the fact that we have not seen a normal correction of the British pound for several weeks, we can make a clear conclusion that big traders are not selling this currency now. Therefore, even the COT report does not yet suggest the beginning of a new downward trend. At the same time, quotes began to fall on Wednesday, but this day will not be included in the new COT report, which will be formed for the period of August 12-18. Therefore, it is unlikely that we will see a major change in the mood of non-commercial traders in the new report. The fundamental background for the GBP/USD pair was interesting on Wednesday, as UK inflation for July was published. And immediately it can be noted that traders, despite a fairly optimistic report, began to get rid of long positions on the pound. Thus, we can safely assume that the report was ignored. But US President Donald Trump recently announced his intention to return the production of American companies from China to the United States. In fact, Trump announced his intention even before he became president. Now Trump is going to impose duties and taxes on companies that leave America and create jobs in other countries (a direct reference to China - approx. author), as well as introduce tax incentives for those who return jobs from China to America. On the one hand, Trump's desire is absolutely logical. On the other hand, he recalled this when the United States had an unprecedented high unemployment rate. Therefore, many analysts believe that Trump is trying to increase his political ratings again with such statements. They say that if Americans elect him for a second term, unemployment will quickly decrease, and new jobs will be created in the country again. "Car factories are opening and developing in Michigan. This has not been the case for the past 42 years. We will end our dependence on China. We will produce our most important medicines and other goods here in the US," the US leader said. There are two main options for the development of events on August 20: 1) Buyers finally let go of the pound/dollar pair, which immediately led to a fall. Thus, we recommend opening new purchases of the British currency but not before quotes return to the area above 1.3157-1.3181. Although now buyers will have to do it very hard in the near future. 2) Bears got down to business and, together with the bulls, which began to drop longs, started to invest in the dollar. Thus, settling the price below the Kijun-sen line (1.3156) will allow opening short positions with the targets of the Senkou Span B line (1.3084) and the support level of 1.3010. Take Profit in this case will be from 40 to 100 points. After such a strong fall in quotes, an upward pullback is not excluded. Hot forecast and trading signals for the GBP/USD pair. We recommend that you also explore the fundamental background in these articles: Overview of the EUR/USD pair. August 20. Is Joe Biden the American version of Jeremy Corbyn? What can a Democratic presidential candidate give America? Review of the GBP/USD pair. August 20. Traders are not interested in the negative from Great Britain. Chinese giant Alibaba next in line to be banned in the US Explanations for illustrations: Support and Resistance Levels are the levels that serve as targets when buying or selling the pair. You can place Take Profit near these levels. Kijun-sen and Senkou Span B lines are lines of the Ichimoku indicator transferred to the hourly timeframe from the 4-hour one. Support and resistance areas are areas from which the price has repeatedly rebounded off. Yellow lines are trend lines, trend channels and any other technical patterns. The material has been provided by InstaForex Company - www.instaforex.com |
| Posted: 19 Aug 2020 06:58 PM PDT EUR/USD 1H The euro/dollar pair perfectly reached the second resistance level of 1.1958 on the hourly timeframe of August 19, rebounded off it and after standing in one place for almost a day, began a strong fall. It seems that the upward trend has come to an end, at least now it seems that buyers have started to reduce their long positions en masse. If the price manages to gain a foothold below the support area of 1.1886-1.1910, this will be another signal for a new downtrend to form. In addition, the Kijun-sen line is also in the way of sellers, which should also be overcome if they want to count on something more than a downward movement of a hundred points. At the same time, it should be noted that at this time, sellers can continue to remain on the fence, since there is a 99% probability that the pair's quotes are falling because buyers are reducing their longs. Demand for the euro is falling, which causes the currency to drop against the US dollar. EUR/USD 15M The lower channel of linear regression turned down on the 15-minute timeframe, which signals a change in the trend in the most short-term plan. A new Commitments of Traders (COT) report was released last Friday. According to this report, non-commercial traders reopened Buy-contracts and closed Sell-deals. The net position for the "non-commercial" category of traders, which is the most important and significant category of traders, has grown again and this time by 15,000 contracts, which is a high value (5,128 Buy-contracts were opened and 9,681 Sell-contracts were closed). This leads to the conclusion that the mood of big traders has not changed at all over the past week. In principle, the same conclusion can be drawn by looking at the chart of the euro/dollar currency pair itself. The pair has been in the side channel since July 27, that is, for three weeks, after which the upward movement resumed. During all this time, traders managed to adjust the pair by a maximum of 200 points down, which is very small to be reflected in the COT report. The euro began to fall in price yesterday evening, which gives reason to assume the end of the upward trend. If we see non-commercial traders sharply reducing Buy-contracts or increasing the number of Sell-contracts in the next COT report, it will show that their mood is beginning to change in favor of a bearish one. The fundamental background for the EUR/USD pair remained extremely weak on Wednesday. And the fact that both European currencies moved almost synchronously again indicates that the reasons should again be sought in the US. Since there has not been much positive news in the United States recently, and nothing overly optimistic happened in the US yesterday, we are inclined to believe that the fall in the euro/dollar pair quotes is purely technical. Yesterday's report on inflation in the European Union was, for example, ignored. The next report on US applications for unemployment benefits is scheduled for today. If our assumption that the bulls have started to massively reduce longs is correct, then now the market will cling to any positive message from overseas. If tomorrow it turns out that the number of new applications for unemployment benefits has decreased again, compared to the previous week, then the dollar can continue to grow. Based on the above, we have two trading ideas for August 20: 1) Bulls abandoned further purchases of the pair and began to take profits. The pair reached the 1.1958 level and after that a strong fall began. Thus, we do not expect the upward trend to resume in the near future. It is recommended to consider new purchases of the pair only if the price returns to the area above 1.1910 with targets at the resistance levels of 1.1958 and 1.2051. 2) Bears finally seized the initiative in the market and began to attack. However, so far, more and more depends on the bulls, which simply close the longs. Nevertheless, we recommend opening sales after breaking through the support area of 1.1886-1.1910 and the Kijun-sen line (1.1874) with the targets of the Senkou Span B line (1.1805) and the support level 1.1745. Potential Take Profit in this case will be from 40 to 100 points. Hot forecast and trading signals for the GBP/USD pair. We recommend that you also explore the fundamental background in these articles: Overview of the EUR/USD pair. August 20. Is Joe Biden the American version of Jeremy Corbyn? What can a Democratic presidential candidate give America? Review of the GBP/USD pair. August 20. Traders are not interested in the negative from Great Britain. Chinese giant Alibaba next in line to be banned in the US Explanations for illustrations: Support and Resistance Levels are the levels that serve as targets when buying or selling the pair. You can place Take Profit near these levels. Kijun-sen and Senkou Span B lines are lines of the Ichimoku indicator transferred to the hourly timeframe from the 4-hour one. Support and resistance areas are areas from which the price has repeatedly rebounded off. Yellow lines are trend lines, trend channels and any other technical patterns. The material has been provided by InstaForex Company - www.instaforex.com |
| Posted: 19 Aug 2020 05:43 PM PDT 4-hour timeframe
Technical details: Higher linear regression channel: direction - upward. Lower linear regression channel: direction - upward. Moving average (20; smoothed) - sideways. CCI: 35.8597 The British pound stayed in one place for most of the past day, and in the second half of the day – started a downward movement, so far a correction. As in the case of the euro currency, we believe that the pound is overbought very much, but the dollar is oversold. Therefore, we continue to insist on the option that the US dollar should start growing again, at least within the framework of a corrective movement. Yesterday, the pound/dollar pair, having worked out the area of 1.3250-1.3260, began to adjust to the moving average line and only fixing the price below it will change the current trend to a downward one. By the way, yesterday, the British currency could well continue to move up. On August 19, in the morning, the UK inflation report was published and it turned out that the main CPI indicator accelerated to 1% with a forecast of 0.6% y/y, and core inflation accelerated to 1.8%, while experts expected it to slow from 1.4% to 1.3% y/y. Thus, it was a pleasant surprise for buyers of the pound. So pleasant that they were even confused and began to reduce long positions. However, we have repeatedly noted in recent months that macroeconomic statistics are ignored by market participants. Thus, we are not surprised by the fact that the next report did not have any impact on the movement of the currency pair. Plus, we have already noted several times that inflation is not the most significant indicator at this time. This leads to the conclusion that it is better to keep track of all macroeconomic reports, but now we need to pay more attention to the overall fundamental background. This is what traders focus on when opening any positions, and especially large, professional traders who drive the market. Unfortunately, at this time, currency market participants do not pay any attention even to the general fundamental background from the UK. For example, the latest GDP data showed that the British economy is the leader in losses among all the countries of the European Union, which it will no longer be a member of at the end of the year. In addition, in Northern Ireland and Scotland, as many journalists and political analysts note, separatist sentiments have begun to mature and strengthen. It is no secret that Scotland wants to leave the United Kingdom and return to the EU. And Northern Ireland is completely unimpressed by the prospect that the island will now have a physical border with Ireland, which will remain in the EU. Moreover, the economic crisis can only worsen the mood of the left that the UK should leave the same way as Britain itself left the Alliance. After all, if the EU countries now have every right to rely on free aid from other countries of the bloc (the 750 billion euro economic recovery fund), then Britain can now only rely on itself. Negotiations with Brussels on a trade agreement that would take effect on January 1, 2021, are still in place, and all reports of the beginning of the seventh, unplanned round of negotiations between Michel Barnier and David Frost sound like an anecdote. Just like reports that London expects to conclude an agreement in September. Recall that according to Michel Barnier, London is absolutely not eager to make concessions. In other words, London is just waiting and hoping that the EU will give in to everything and the parties will sign a deal. Moreover, Bloomberg economists conducted a vote among top managers and bankers, which shows that few of them expect the economy to fully recover by the end of 2021, as promised by the Bank of England. Most likely, by the end of 2021, the British economy will be 5% smaller than before the pandemic. Moreover, this figure reflects the most optimistic scenario, in which the second "wave" of the epidemic will not occur. However, doctors as one declare that with the arrival of autumn and, moreover, winter, the second "wave" of COVID-2019 will begin. Thus, potentially, the economy of almost any country in the world with the arrival of the cold season can again begin to slow down or even shrink. We have repeatedly said that even if the government of a country does not impose strict quarantines, people will not be forced to work or lead an active social life if an epidemic is raging outside the window. Especially in developed countries, where it is quite possible to live on unemployment benefits. In general, all forecasts of the Central Bank of England are regarded by investors as "surprisingly optimistic". Moreover, most economists expect that the Bank of England will once again expand the asset purchase program by 50 or 100 billion pounds. All these factors are now simply ignored by traders, so in general, it is the US dollar that continues to fall. Interesting information at the same time comes from overseas. On August 19, Donald Trump said in a conversation with reporters that trade talks with China were put on pause. "I don't want to talk to him at this time," Trump said. "What they did to this country and the world is unthinkable." The US President did not forget to once again prick his opponent Joe Biden: "If sleepy Joe worked with them, they would already own America. Biden would give them everything. He is not very smart and is frankly weak." In addition to the war we have already mentioned against the Chinese company Huawei, Trump seriously intends to work against other Chinese giants, forcing them out of the American market. Just the other day, Trump said that he is studying the possibility of banning the Chinese giant Alibaba in the United States. Earlier, we wrote that Trump requires the sale of the social network TikTok to any American company, or this network will be banned in the States. Any such aggression against a Chinese company is explained by national security interests. In addition to all this,Trump seriously intended to return American companies from China to the States. He promised to do this during the 2016 election campaign, and now, a few months before the end of his first presidential term, he recalled this issue. It is not known whether Trump will have time to solve this problem, but it is expected that all companies with production facilities in China will receive tax benefits when returning to America and, conversely, will be punished and fined if they refuse to do so. Thus, relations between the United States and China will continue to deteriorate with a 90% probability. And especially if Trump wins the 2020 election.
The average volatility of the GBP/USD pair is currently 103 points per day. For the pound/dollar pair, this value is "high". On Thursday, August 20, thus, we expect movement within the channel, limited by the levels of 1.3052 and 1.3258. Turning the Heiken Ashi indicator upward will indicate the possible completion of the downward correction. Nearest support levels: S1 – 1.3123 S2 – 1.3062 S3 – 1.3000 Nearest resistance levels: R1 – 1.3184 R2 – 1.3245 R3 – 1.3306 Trading recommendations: The GBP/USD pair started a strong correction on the 4-hour timeframe. Thus, today it is recommended to consider new longs with the goals of 1.3245 and 1.3258 if the Heiken Ashi indicator turns upward or the price rebounds from the moving average. It is recommended to open sell orders no earlier than fixing the price below the moving average with the goals of 1.3062 - 1.3052. The material has been provided by InstaForex Company - www.instaforex.com |
| Posted: 19 Aug 2020 05:43 PM PDT 4-hour timeframe
Technical details: Higher linear regression channel: direction - upward. Lower linear regression channel: direction - upward. Moving average (20; smoothed) - sideways. CCI: 15.7404 On Wednesday, August 19, trading was held in a very quiet and calm channel. After the price managed to break out of the three-week 200-point side channel, it seems that traders again do not know what to do next. After all, the technical picture for the euro/dollar pair has not changed. The US dollar has been heavily oversold, and remains so. There was no normal correction for the pair either. And yet, in recent weeks, the overall fundamental background in America has become less negative. First, somehow in many American cities rallies and protests against police violence and racism "Black Lives Matter" ended. And this is a small victory, because they very much hindered the recovery of the economy, and at the same time were an excellent springboard for the spread of the "coronavirus". Second, the coronavirus epidemic has been on the wane in recent weeks. In the last three days, no more than 50,000 illnesses were recorded every day. This is still a lot, but at least this figure has crept down, which means the situation is gradually improving. Third, the bottom of the US economy has probably already passed. Although the recovery promises to be long and difficult, but still the worst is over. But in the European Union, nothing has changed for the better, everything is as it was, and remains quiet and calm. However, there are several factors that may have caused the US currency to resume its decline. First, this is another escalation in relations between China and the United States. Now these two countries are at war for/against Huawei, which US President Donald Trump has accused of spying and stealing the data of American citizens. Second, Republicans and Democrats cannot agree on a new package of economic assistance to small and medium-sized businesses, as well as to Americans who lost their jobs during the pandemic. Differences remain over the size of the package. Trump is offering no more than $ 1 trillion, which means $ 200 in "coronavirus surcharges" to every unemployed person, Democrats are pushing for $ 600 in surcharges. Trump wants Americans not to sit at home without work and not live on unemployment benefits, and Democrats believe that the unemployed should be helped in any case, and not driven into poverty. Third, the political crisis in America is gaining momentum and may soon reach its climax. Biden and Trump continue to conduct their election campaigns, all leading publications and media continue to count the political ratings of both candidates, and in general, this topic is now the most popular in America. Just yesterday, we wrote that Americans, judging by the polls, are going to vote for Biden not because he is good, but because Trump is bad. The list of "merits" of Trump is so extensive that it does not raise questions why many Americans do not want to see him in the presidential chair for a second term. The biggest claims against Trump are a complete failure in the fight against the COVID-2019 epidemic, as well as a record decline in the American economy. Thus, the majority of Americans are really ready to vote on November 3 on the principle of "just not Trump". However, if Trump loses, and so far everything is going to this, one can not help but wonder what awaits the United States with President Biden? According to many American political analysts, Biden is one of the most unattractive presidential candidates in the history of the United States. They call him "their guy" and respect him for his human qualities and the hardships of life that he had to go through. For example, Robert Gates, the Secretary of Defense under Obama, said that it was impossible not to love Biden, but at the same time, he was wrong on almost any issue related to foreign policy and national security. That is, in fact, Biden can become President not because of his knowledge of the economy, the ability to lead the country, the ability to negotiate, in general, not because of the leadership qualities that the President should undoubtedly have, but because he is "his own guy" and after Trump, it is better to choose someone "calmer". Many experts also believe that Biden will lead the country without a certain political course, without reformist plans. That is, in fact, it will be extremely similar to the former leader of the British Labor Party, Jeremy Corbyn, who during the parliamentary wars over Brexit and the parliamentary elections suffered a crushing defeat just because he did not have a clear policy that would offer his voters. Biden may become a complete antipode of Trump, but the results of his rule may not differ much from the results of the rule of Trump himself. It is unlikely that Biden will further worsen the situation of the United States, with him there will almost certainly be a recovery and growth, because this always happens after a crisis, but at the same time, in the international arena, Washington may again make important mistakes that will eventually "return" to the country. Trump is a pure businessman who is used to promoting and pushing his personal interests. This is what he did as President of the United States for almost four years, often forgetting that what is good for him is not always good for the country. He was well versed in Economics, but at the same time could not agree with anyone, fought and conflicted with everyone who did not support his point of view. As a result, he made a huge number of enemies in the US government and around the world. Biden, according to many, who will turn 78, also does not have the qualities that a President needs. First, he is already too old and there is a big question in his energy, will he be able to lead the country, especially when in the last year of the presidency, he will be 82 years old? Second, Biden does not give a clear political course. It is unclear what policy the White House will follow, for example, in the conflict with China. Third, Biden is often in the shadows. Thus, we believe that the Americans will choose Biden on the same principle that the conservatives in Britain were chosen in the parliamentary elections. Then it was "we want to leave the EU", now it will be "we do not want Trump to be president".
The volatility of the euro/dollar currency pair as of August 20 is 78 points and is characterized as "average". Thus, we expect the pair to move today between the levels of 1.1794 and 1.1950. A reversal of the Heiken Ashi indicator to the top will signal a possible resumption of the upward trend. Nearest support levels: S1 – 1.1841 S2 – 1.1719 S3 – 1.1597 Nearest resistance levels: R1 – 1.1963 R2 – 1.2085 R3 – 1.2207 Trading recommendations: The EUR/USD pair has started to adjust, but still continues to be located above the moving average. Thus, today it is recommended to open new long positions with targets of 1.1950 and 1.2085 if the pair bounces off the moving average line. It is recommended to consider short positions only after fixing the price below the moving average with the first goals of 1.1794 and 1.1719. The material has been provided by InstaForex Company - www.instaforex.com |
| USD/CAD. Weak Canadian inflation and new hopes for dollar bulls Posted: 19 Aug 2020 01:59 PM PDT Weak inflation data, which was published in Canada today, did not affect the mood of investors. The Canadian dollar continued to trade in the same way as before the release, ignoring the slowdown in inflation indicators. The loonie only reacts to the behavior of the US currency. However, the national statistics of Canada should not be ignored, since today's release will still affect USD/CAD traders in the foreseeable future. July inflation significantly fell short of the forecast values. In monthly terms, the overall consumer price index showed positive dynamics for two months – in May and June. But the index fell back to zero in July. The indicator also fell to almost zero (0.1%) in annual terms. Core inflation fell into negative territory altogether: the core index slowed to -0.1% on a monthly basis. Considering the structure of these indicators, we can conclude that the main anchor of activity is still tourism. For example, air travel prices fell by 8.6%, while housing prices dropped 27%. In connection with today's release, it is necessary to recall the last meeting of the Bank of Canada, which took place on July 15th. The newly appointed central bank governor, Tiff Macklem, then outlined the conditions under which the regulator would consider raising the interest rate. According to him, rates will remain at current levels until "inflation reaches the two percent target, and does not gain a foothold in this area." In other words, he emphasized the importance of inflation indicators, linking the dynamics of their growth with the prospects for tightening monetary policy. The next meeting of the Canadian central bank will take place in mid-September - but now there is no doubt that the Bank of Canada will react negatively to the July figures. Despite the fact that the oil market showed positive dynamics last month - the price of a barrel of oil WTI fluctuated in the range of 39-42 dollars, Brent - in the range of 42-43 dollars. Therefore, the weak growth in inflation indicators is mainly associated with internal reasons due to the coronavirus crisis. USD/CAD traders only formally reacted to today's release. The Canadian dollar follows the US dollar today, which in turn sharply reacts to US political events. The long-suffering bill to stimulate the American economy was again in the spotlight. Over the past few weeks, rumors surrounding this document have been contradictory. Republicans and Democrats, who can not separately pass the law (the Upper House of Congress is controlled by US President Donald Trump's party members, while the Lower House is controlled by representatives of the Democratic party) sat down at the negotiating table at the end of July. At first, the parties voiced optimistic comments, declaring a constructive dialogue and hinting at an early compromise. But then the situation began to deteriorate and along with it, the mood of dollar bulls began to go down as well. As a result, talks reached an impasse, as reported by White House Economic Adviser Larry Kudlow the Friday before last. US Treasury Secretary Steven Mnuchin assured reporters that the negotiations "are about to resume". However, Head of the Council of Economic Advisers Tyler Goodspeed refuted the treasury secretary's optimism. He said that Trump will not compromise with the Democrats and will not agree to their proposal (they proposed to increase the volume of the bill from one to two trillion dollars). Against the backdrop of such controversial rhetoric, as well as against the backdrop of increased anti-Chinese rhetoric on the part of Trump, the dollar collapsed across the market. Today, however, dollar bulls have a light at the end of the tunnel again. And quite unexpectedly, given the previous rhetoric of Republicans, representatives of the Trump administration - and even Trump himself, who recently issued executive orders bypassing Congress. Nevertheless, White House Chief of Staff Mark Meadows said today that unofficial negotiations with the Democrats are underway, which are "very, very productive." After this announcement, the dollar index turned and went up, reflecting the increased demand for the US currency throughout the market. The USD/CAD pair was no exception: the loonie retreated from the bottom of the 31st figure and updated the daily high. The future prospects of the pair also depend on the greenback's behavior. If the information about the ongoing talks is confirmed, the price will continue its corrective growth up to the 1.3260 level (the Tenkan-sen line on the daily chart). But if journalists exaggerated or misinterpreted Meadows' words, then the bears will move with new strength to the main support level of 1.3100 (the lower line of the Bollinger Bands indicator on the daily and weekly charts). The situation is uncertain, so it is worth waiting with trading positions for now – we will find out tomorrow in which direction the pendulum will swing. The material has been provided by InstaForex Company - www.instaforex.com |
| Posted: 19 Aug 2020 09:29 AM PDT 1-hour chart for EUR/USD On Wednesday, August 19, the EUR/USD pair was making a correction for most of the day after the spike on Tuesday. The MACD indicator turned down in the evening on August 18 and has not given new buy signals since then. Thus, it was a bad idea for novice traders to open long positions during the day. Later in the trading day, the currency pair slumped sharply and broke the upward trend line. In essence, it means that the uptrend is over and the pair is about to reverse downwards. However, we would not recommend making hasty conclusions ahead of time. First, the trend line was crossed almost in the evening. Second, in a few hours, the minutes of the last Fed meeting will be published, which means that the market could give a strong response. In general, if the trend has reversed downwards, then nothing will change by tomorrow morning. If this breakdown is fake, then tomorrow morning it will become clear. From a fundamental point of view, there was little news for the EUR/USD pair today. Actually, the only report on the eurozone's inflation for July was posted which disappointed traders. The consumer price index is one of the crucial indicators of the economic health. Central banks usually view a CPI as the barometer when fine-tuning the parameters of monetary policy. However, in times of global jitters which are happening nowadays, it is perfectly logical to expect that inflation will not be "quiet". It can either accelerate sharply (often in developing countries), or, on the contrary, fall sharply (typical for advanced economies). Thus, the drop in inflation to 0.4% in annual terms is not surprising at all. Core inflation (excluding changes in food and energy prices) amounted to 1.2% y / y in July. It is clearly seen from the chart of the currency pair that EUR/USD was not making sharp swings up and down movements at that time. Thus, the market neglected the report. On August 20, Thursday, there will be few macroeconomic publications again. Novice traders can turn their attention only to the report on claims for unemployment benefits in the United States, the total number of which may drop to 15 million last week. However, this is not the indicator that arouses a serious reaction from market participants. Nevertheless, if the number of new initial applications is significantly lower than the forecast (925,000), then the US dollar is more likely to assert strength (or EUR/USD will decline). This is what began on Wednesday. Thus, during the day, market sentiment will be cautious and the price should not make gyrations (unless other important, unplanned news comes in). On August 20, the following scenarios are possible: 1) Buying the pair at this time makes no sense as the price has overcome the upward trend line. Thus, you need to either wait for the formation of a new upward trend, or recognize the current breakdown of the trend line as fake, or rebuild the trend line itself. So far, none of these options work. After the price sank by 45 points, an upward retracement may follow. Let me recommend novice traders waiting at least until the morning to assess the prospects for buying EUR/USD. 2) Selling the currency pair at present could become a good trading idea, if the breakdown of the trend line is not fake. It may turn out to be false if today and tomorrow night the pair abruptly resumes its upward movement, and the MACD indicator turns up. However, if everything clears up by tomorrow morning, then it will be possible to consider selling EUR/USD with the targets of 1.1876 and 1.1822. What's on the chart: Support and Resistance Price Levels - Levels that are targets when buying or selling. Take Profit levels can be placed near them. Red lines are channels or trend lines that display the current trend and show which direction it is preferable to trade now. Up / down arrows - show when reaching or overcoming which obstacles should be traded up or down. MACD indicator (10,20,3) - a histogram and a signal line, the crossing of which are signals to enter the market. Recommended for use in combination with trend lines (channels, trend lines). Important speeches and reports in the economic calendar can greatly influence the movement of the currency pair. Therefore, during their release, it is recommended to trade as carefully as possible or exit the market in order to avoid a sharp price reversal against the previous movement. Forex beginners should remember that every trade cannot be profitable. The development of a clear strategy and money management are the key to success in trading over a long period of time. The material has been provided by InstaForex Company - www.instaforex.com |
| August 19, 2020 : EUR/USD daily technical review and trade recommendations. Posted: 19 Aug 2020 09:20 AM PDT
The EUR/USD pair has been moving-up since the pair has initiated the depicted short-term uptrend line on July 21. By the end of July, a resistance level was formed around 1.1900 which prevented further upside movement for some time and forced the pair to have a downside pause towards 1.1715 in the form of a Wedge-Pattern.On August 12, a new short-term uptrend line was initiated around 1.1715. Since then, the EURUSD pair has been moving upward until Yesterday when we had a breakout above the previously mentioned resistance zone. Short-term outlook turns positive for the pair. Hence, BUY Positions are preferred at the current time. Hence, Intraday traders should wait for downside pullback to retest the backside of the broken downtrend line around 1.1860-1.1880 for a valid BUY Position. Initial target would be located around 1.1950 and Stop Loss should be set at 1.1820. The material has been provided by InstaForex Company - www.instaforex.com |
| August 19, 2020 : EUR/USD Intraday technical analysis and trade recommendations. Posted: 19 Aug 2020 09:12 AM PDT
On March 20, the EURUSD pair has expressed remarkable bullish recovery around the established bottom around 1.0650. Shortly after, a sideway consolidation range was established in the price range extending between 1.0770 - 1.1000. On May 14, evident signs of Bullish rejection as well as a recent ascending bottom have been manifested around the price zone of (1.0815 - 1.0775), which enhances the bullish side of the market in the short-term. Bullish breakout above 1.1000 has enhanced further bullish advancement towards 1.1150 then 1.1380 where another sideway consolidation range was established. Hence, Bearish persistence below 1.1150 (consolidation range lower limit) was needed to enhance further bearish decline. However, the EURUSD pair has failed to maintain enough bearish momentum to do so. Instead, the current bullish breakout above 1.1380-1.1400 has lead to a quick bullish spike directly towards 1.1600 (Fibonacci Expansion 78.6% level) which failed to offer sufficient bearish pressure. That's why, further bullish advancement pursued towards 1.1730 (Fibonacci Expansion 100% level) which failed to offer sufficient bearish rejection for a few days until Today. Bullish persistence above 1.1730 will probably favor further bullish advancement towards 1.2075 (161% Fibo Expansion Level) in the intermediate-term. On the other hand, bearish re-closure below 1.1730 indicates lack of bullish momentum and enhances further bearish decline initially towards 1.1600. Trade recommendations : Conservative traders should wait for the current bullish movement to pause and get back below 1.1730 as an indicator for lack of bearish momentum for a valid SELL Entry.T/P levels to be located around 1.1600 and 1.1500 while S/L to be placed above 1.1800 to minimize the associated risk. The material has been provided by InstaForex Company - www.instaforex.com |
| August 19, 2020 : GBP/USD Intraday technical analysis and trade recommendations. Posted: 19 Aug 2020 09:11 AM PDT
In the period between April and June 2020, the GBPUSD has been moving sideways within the depicted consolidation range extending between (1.2265 - 1.2600) Transient bearish breakout below 1.2265 (consolidation range lower limit) was demonstrated in the period between May 13 - May 26, denoting some sort of weakness from the ongoing bullish trend. However, immediate bullish rebound has been expressed around the price level of 1.2080 bringing the GBP/USD back towards 1.2780 (Previous Key-Level) where another episode of bearish pullback was initiated. Short-term bearish movement was expressed towards 1.2265 where Significant bullish rejection was originated bringing the GBP/USD pair back towards 1.2780 where the mid-range of the depicted wedge-pattern failed to offer enough bearish rejection. Intermediate-term Technical outlook for the GBP/USD pair remains bullish as long as bullish persistence is maintained above 1.2780 (Depicted KeyLevel) on the H4 Charts.On the other hand, the pair looks overbought after such a quick bullish movement. Hence, upcoming bearish reversal shouldn't be excluded provided that early bearish breakout occurs below 1.2980 (the depicted wedge pattern upper limit). Trade recommendations : Technical traders are advised to wait for any upcoming bearish breakdown below 1.2980 as a valid SELL Entry. Initial T/p level is to be located around 1.2780. On the other hand, bullish persistence above 1.2980 invalidates this trading scenario. The material has been provided by InstaForex Company - www.instaforex.com |
| Posted: 19 Aug 2020 07:52 AM PDT
On Wednesday morning, there was an unexpected drop in gold price. Only yesterday, the precious metal managed to finally settle above psychologically important mark of $2,000 per troy ounce. A day later, gold plunged below this level. Notably, both the rise and the fall were caused by the US dollar. The US national currency has moved slightly upwards thus putting pressure on gold. Today, markets are still awaiting the release of the minutes from the US Federal Reserve's last policy meeting. Investors will be looking for more clues on the Fed's approach to support the country's economy in a crisis caused by the coronavirus pandemic. Gold prices fell 0.65% this morning to $1,987.93 per troy ounce. The support level for the precious metal was seen at $1,923, while the resistance moved to $2,024.6 per troy ounce. Nevertheless, prospects for gold remain rather optimistic. Most analysts believe that the US dollar will continue its massive decline in the very near future. In this case, gold will easily regain ground. So this retreat from gold is a temporary and short-lived phenomenon. The precious metal is sure to break above the level of $2,000 in the coming days. Moreover, it is likely to hit new highs soon. In the meantime, market participants are waiting for signals from the Fed and details of its monetary policy. However, the interest rates are unlikely to change until the end of next year. It is recommended that investors stay cautious when buying gold as the daily volatility of the metal is extremely high. So yesterday morning, gold was trading at $2,015 per troy ounce. By the end of the trade, the price reversed and stopped at $1,985. And in early hours, it jumped again to the level of $2,010. On Wednesday morning, everything changed, and the price dropped to $1,992 per troy ounce. Of course, such high volatility made market participants nervous. However, the yellow metal is likely to continue the uptrend. Some experts do not exclude a trend reversal which is not so obvious yet. So far, most experts predict that gold has every chance of reaching $2,500 per troy ounce as soon as next year. This confidence is supported by an increase in demand for precious metal. The demand is high, and not only from major market players, such as banks and financial organizations. There was is spark of interest from the jewelry sector, including jewelry factories as well as individuals. Silver futures for September were significantly lower this morning, falling 1.07% and currently trading at $27.775 per troy ounce. The price of palladium also went down by 0.33%, having settled at around $2,181.43 per ounce. Platinum dipped by 1.15% to $945.25. On the other hand, copper futures for September moved up by 0.83%, currently holding at the level of $2.9977 per pound. The material has been provided by InstaForex Company - www.instaforex.com |
| GBPUSD and EURUSD: Pound's inflation and Investors' reaction on the Fed minutes Posted: 19 Aug 2020 06:37 AM PDT Today's UK inflation data surprised many, if not all. However, why then the pound sterling did not rise, and instead returned from its local maximums in the area of 1.3260 to the larger support 1.3210, for which a fierce struggle is now being waged. It is not excluded that the pressure on the pound will continue in the second half of the day, and a short pause in the support area at 1.3210 will develop into a new sale of the pound to the minimums of 1.3170 and 1.3120. If the buyers of the trading instrument nevertheless turn out to be stronger and regain the bullish momentum, then it will be possible to talk about the resumption of the trend only after the breakout and consolidation above the area of 1.3260, which will open a direct road to the highs of 1.3320 and 1.3380. But let's figure out why the pound did not react with growth to such confident inflation data, which in normal times would lead to an inevitable wave of strengthening of the pair by 100-150 points within the day. The report is very simple - the current data cannot be considered representative, or reliable, due to distortions that were caused by the coronavirus pandemic in the spring of 2020. It will be possible to get a real picture only after the economy recovers from the consequences of the pandemic, but for now, this is very far away. So it turns out that the statistics awaiting us will continue to be unpredictable, and in August we may see a sharp decline in the indicator, although many economists will bet on continued growth. But there is also an undoubted plus since the growth of inflation indicates and once again proves the fact that the country's economy has confidently taken the path of recovery after Covid-19 and, most likely, will continue to recover in the fall. A slowdown in growth can only be expected by winter when a second outbreak of the pandemic is expected, which will lead to more cautious spending among the population. The reaction of many UK companies in the manufacturing and services sectors is unlikely to raise prices to cover costs incurred amid continuing social distancing measures. But, as has been repeatedly noted, today's report is unlikely to influence the decision of the Bank of England to resort to a new stage of monetary policy easing. According to the data, the UK consumer price index (CPI) in July 2020 rose 0.4% compared to June, while economists surveyed had expected the figure to remain unchanged. Particularly strong growth was recorded in the annual period. The report indicated that annual inflation in the UK in July was 1.0%, and the core CPI, which does not take into account volatile categories, increased by 1.8% at all compared to the same period last year. It is already clear that the increase in the indicator was also partly due to the rise in oil prices, after their collapse amid the spread of the coronavirus pandemic. The August indicator will most likely be less dependent on this variable since prices have partially stabilized. You also need to understand that a sharp inflationary jump, as in the indicators of a significant rise in the volume of retail sales, was associated with the satisfaction of the deferred demand among the population, which fueled the prices of goods and services. Most likely, the influence of this factor will completely disappear in the next few months, which will significantly slow down the growth of prices, or even lead to some decrease in prices. Also, the weakening of demand will be affected by the completion of state employment support programs, EURUSD As for the euro, traders ignored the data on inflation in the eurozone, as they fully coincided with the forecasts and were not of significant interest to the market. For statistics, according to the data, the consumer price index of the eurozone for July 2020 rose by 0.4% compared to June, while the forecasted growth was 0.3%. Compared to last year, inflation rose by only 0.4%, fully in line with economists' forecast. We see how all the prerequisites for slowing inflation growth, which I spoke about a little higher and which I tied to the UK, are already being implemented by the eurozone. As for the underlying index, it increased by 0.3% compared to June. This suggests that the volatility and pressure of commodity prices and energy resources have been minimized. As for the report on the surplus of the current account of the balance of payments of the euro area, there is noticeable good progress. According to the data, the balance in June rose to 21.0 billion euros, while in May the figure was 11.0 billion euros. This afternoon it is necessary to pay attention to the report of the Federal Reserve System from the last meeting. The report may further reveal the attitude of investors to risk, which is no longer a clear driver of the US dollar. If the Central Bank continues to adhere to the current super-soft monetary policy, then the growth in the yield of Treasury bonds will certainly remain in the dreams of many investors. This will certainly lead to further growth in gold prices, counting on the acceleration of inflationary expectations. Further easing of monetary policy will further hit the yield of US treasuries and increase pressure on the US dollar. As for the technical picture of the EURUSD pair, it remained unchanged. To maintain buying momentum, a break and consolidation above the 1.1963 resistance is required, which will lead to a new wave of growth towards the highs of 1.2000 and 1.2055. If we talk about the variant of a downward correction, which is more acceptable for buying the euro, then you can open long positions after the update of support at 1.1885, where the lower border of the ascending channel passes. The bulls will also try to defend the 1.1920 range, but this buying option will be optimal given the weak minutes of the Federal Reserve System, which are published later this afternoon. A break of 1.1885 support will quickly push EURUSD to the 1.1830 and 1.1780 lows. The material has been provided by InstaForex Company - www.instaforex.com |
| European stock indicators are growing, but American and Asian stocks cannot determine the dynamics Posted: 19 Aug 2020 06:36 AM PDT
US stock markets remained practically without visible movements on Tuesday. The dynamics of the main stock indicators were extremely low, but this did not prevent the S&P 500 from reaching its maximum record value. In general, since mid-spring, the indicator was able to add 54%, which became possible due to an increase in the value of securities of the largest corporations in the technology sector. Thus, the S&P 500 returned to its pre-crisis level, however, without considering the fact that some sectors have not even started their recovery process, which makes us believe in the future grandiose rise of the indicator. The Nasdaq Composite was also able to reach its next record high, which has happened for the thirty-fourth time this year. Market participants have focused on the escalating conflict between the US and China. Another deterioration in relations happened just a couple of days ago when the US ratified the access ban for the Chinese telecommunications company Huawei Technologies Co. to the main components of her work. Companies from twenty-one countries of the world, where the export of American technology is now prohibited, were under the sanctions. In the meantime, the problem of deciding on a financial incentive program seems to be beginning to be solved. Thus, the Republican Party is ready to present its somewhat abbreviated version of the bill, which contains the main measures to support the country's economy. Among other things, it will present increments to unemployment benefits totaling $ 300 per week, as well as a separate additional measure to support the US Postal Service in the form of a financial injection. The problematic point is that the Democrats are not willing to compromise. They cannot agree in any way that the US President Donald Trump intends to allocate large funds that will also be used to support children, preserve jobs, a new stage of the loan program for small businesses, and direct targeted payments. However, it is already becoming clear that the negotiation process has slightly moved off the ground. Investors will now also be interested in corporate reporting, which is also preparing to be released soon. The Dow Jones Industrial Average fell 0.24%, or 67.19 points, pushing it down to 27,777.72 points. The Standard & Poor's 500 index, on the contrary, rose by 0.23% or 7.78 points. Its current level was 3,389.76 points. The Nasdaq Composite Index rose 0.73% or 81.12 points, allowing it to take a position at 11,210.84 points. The Asian stock markets, on the other hand, again did not demonstrate a uniform dynamics on Wednesday: the main stock indicators diverged on different sides. Japan's Nikkei 225 Index rose by 0.26%. This was supported by statistics on the country's economic growth. Thus, the level of exports in the country for the first time in seven months began to decline at a slower pace, but the very fact of the fall has been recorded for twenty months in a row. In the second month of summer, the figure dropped by 19.2% compared to the same indicator last year. In monetary terms, the fall was 5.37 trillion yen. But Japanese imports fell more strongly by 22.3% or 5.36 trillion yen, and this is also a prolonged decline, which has been going on for fifteen months in a row. China's Shanghai Composite Index fell 0.71%. The Hong Kong Hang Seng Index continued this negative trend and sank even more by 0.92%. South Korea's Kospi Index, on the other hand, reacted positively to all the news and added 0.74%. The Australian S & P / ASX 200 Index rose 0.72%. Despite the fact that most of the indicators are still in the green zone, there are certain risks associated with the escalation of the conflict between Washington and Beijing. Recall that a new round of tension has already led to the disruption of the negotiation process on a trade agreement between the countries, as well as to the imposition of sanctions by the US against a Chinese telecommunications company. Meanwhile, the European stocks moved up on Wednesday after Tuesday's fall. They were supported by the statements given by the US President Trump that he did not intend to conduct a dialogue with China in the near future since he considers the PRC government to be the culprit of all the troubles the world has faced this year. There is also confirmation on the absence of plans for talks in the White House. As long as the conflict remains unresolved, European stock indicators will have at least one support factor. However, there are also moments that cause particular concern to market participants. One of them, and perhaps the most important, is the growing epidemiological situation in Europe. The number of new cases of coronavirus infection is growing, which indicates the next wave of the pandemic, the consequences of which for the economy of states can be even direr. At the same time, there are not very encouraging data on the economic growth of the region. For example, the consumer price level in the UK increased by 1% on an annualized basis. This means that inflation also increased by 06%, which moved it to the highest values that were recorded at the beginning of this spring. The general index of large enterprises in the European region Stoxx Europe 600 rose by 0.18% and moved to around 367.84 points. The UK FTSE 100 Index is up 0.11%. The German DAX Index jumped 0.17%. France's CAC 40 Index increased by 0.29%. Italy's FTSE MIB Index climbed 0.26%. But the Spanish IBEX 35 index was the only one that showed albeit insignificant, but negative dynamics: its fall was 0.05%. The material has been provided by InstaForex Company - www.instaforex.com |
| USDCAD follows our plan and trading strategy. Posted: 19 Aug 2020 06:23 AM PDT On August 10th we noted a bearish setup in USDCAD and we confirmed that we prefer to be sellers on any bounce as price was expected to get rejected and move towards 1.32. At that point in time USDCAD was trading at 1.3335.
Red lines - bearish channel Blue lines -bearish short-term channel Yellow rectangle - key resistance USDCAD is now trading near 1.3135 almost 200 pips lower from our post about the bearish setup. Trend is clearly still bearish and as long as price is below 1.3350 we remain medium-term bearish. A bounce towards 1.32-1.3230 is possible so bears should not get overconfident. Our target of 1.30 remains valid. The material has been provided by InstaForex Company - www.instaforex.com |
| Short-term Ichimoku cloud indicator analysis of EURUSD for August 19, 2020 Posted: 19 Aug 2020 06:17 AM PDT EURUSD remains in a bullish trend. We use the Ichimoku cloud indicator to point at important support levels and targets if price breaks below certain support levels. The indicator confirms that short-term trend in the 4 hour chart remains bullish.
|
| Short-term trading plan for Gold Posted: 19 Aug 2020 06:13 AM PDT In our last analysis when Gold price was trading at $1,994 we mentioned that aggressive traders could take advantage of a possible bearish setup. We saw signs of a possible short-term top at $2,015.
Green line -support Blue rectangle- support Green rectangle - target if support fails to hold Gold price has pulled back from $2,015 to $1,982. Price has stopped the decline right at support. A possible short-term top at $2,015 will be confirmed if price breaks below short-term support at $1,980-82. Breaking below this level will most probably push Gold price towards the green rectangle target area. As long as price is above the green trend line support our bearish setup is in danger of getting canceled. Closing short position and reopening them if price breaks support is the preferred strategy now. The material has been provided by InstaForex Company - www.instaforex.com |
| Posted: 19 Aug 2020 06:12 AM PDT Yesterday, the wave structure of the uptrend, which was formed on March 20 and took the shape of a triple zigzag, was subject to some adjustments. A successful attempt to break through the previous high resulted in complication of the internal Z wave structure. Now, within this wave structure, we can still observe the a-b-c waves. Yet, the c wave is transforming into a more complex five-wave structure. If this is true, then the quotes will keep rising for some time within the framework of wave 5 in c in Z. At the same time, the construction of an uptrend is about to complete soon. A closer look at the current wave pattern shows that the markets made a successful attempt to break through the 161.8% Fibonacci level, as well as through the two local highs. Thus, the price resumed its growth and may now head for the targets located near the 200.0% Fibonacci level. The expected wave 5 in c in Z can complete its formation at any moment. It will depend on how long the markets will ignore the American currency. There was no important news for the pound/dollar pair on Tuesday. In Brussels, the UK and the EU entered another round of negotiations on trade agreement that will take place when Brexit is completed. However, there are no positive changes so far. The parties said they will "continue to fill the gaps." It is not clear yet whether Michel Barnier and David Frost will be able to cope with this task. There at least four important issues that the parties cannot agree upon. Notably, the agreement must be signed by the end of October so that it could be ratified it by the end of December. Otherwise, from January 1, 2021, London and Brussels will trade with each other on less favorable terms than now. The two parties will need to follow the WTO rules, which imply quotas, tariffs, and other restrictions. Thus, in this case, the economies of the EU and Britain will suffer again due to a decrease in trading volumes. Today, the UK released the data on the consumer price index for July. Inflation accelerated in July to 1% y/y and to 0.4% m/m. The core consumer price index was also up by 1.8% y/y. So this was good news for the British pound. Later in the day, the US Fed's minutes will be released. They are supposed to give the markets additional information which was not stated during the press conference after the meeting. Conclusion and recommendations: The pound/dollar pair has resumed the formation of the upward wave Z. Thus, I would recommend buying the pair now. At the same time, I believe that the entire uptrend is about to complete soon. If this is true, then buying the pair maybe is too risky now. Nevertheless, the instrument may continue to rise with the targets near the 1.3368 mark which corresponds to 200.0% Fibonacci. The material has been provided by InstaForex Company - www.instaforex.com |
| Posted: 19 Aug 2020 06:10 AM PDT In the most global sense, the wave counting of the EUR/USD instrument has undergone certain changes. If earlier, I hoped that the upward trend section would not become more complicated, then a successful attempt to break through the previous high led to the fact that the wave counting required adjustments. Thus, the assumed wave 4 took a pronounced three-wave form, and the instrument moved to the construction of a 5 in 5 in 3 or S wave. The entire section of the trend, which begins on March 20, takes on an even more complex and extended form. A wave counting on a smaller scale refines the data obtained from a higher scale. Since the attempt to break through the peak of the supposed wave 3 turned out to be successful, the entire wave counting took a longer form. Thus, the rise in the instrument quotes can now continue with targets located near the 323.6% Fibonacci level. Considering the fact that the demand for the euro currency remains quite high, it is possible that the markets will try to bring the instrument to the 423.6% Fibonacci level. On Tuesday, August 18th, there was not much news in Europe and America. Nevertheless, the markets still found grounds for new purchases of the euro/dollar instrument. And these reasons are ambiguous. First, US Treasury Secretary Steven Mnuchin made it clear yesterday that Republicans and Democrats are still far from each other and cannot yet agree on a financial assistance package for the American economy. Mnuchin did not disclose any details of the talks, but he stated earlier that "the package will be agreed within a few days." It was a couple of weeks ago. Now, it is obvious that nothing will be agreed in the near future, therefore, the US economy will not receive new cash infusions in the near future. In addition, the tensions between China and America continue to escalate. Let me remind you that these countries exchanged the closure of several consulates of each other not so long ago, Washington continues to blame Beijing for deliberately releasing the pandemic, and the trade confrontation between these countries continues. So, there is no positive news from this channel. The parties are not holding new negotiations on a trade deal, and Donald Trump has completely focused his attention on the upcoming presidential elections. Naturally, all this does not increase the demand for the US currency and Donald Trump completely focused his attention on the upcoming presidential elections. On Wednesday, the European Union released a report on inflation for July and I must say that this report turned out to be quite weak. While inflation in Britain accelerated significantly, the consumer price index in the EU remained unchanged at 0.4% y / y. The situation is slightly better with core inflation, which amounted to 1.2% y / y. As we can see, markets' expectations were in line with actual values. General conclusions and recommendations: The euro/dollar pair has resumed the construction of the assumed global wave 3 or C. Thus, at this time, I recommend new purchases of the instrument with targets located near the calculated level of 1.2089, which corresponds to 323.6% Fibonacci. At the same time, wave 5 in 5 in 3 or C can literally end at any moment and start building a correctional wave 4 or a new downward trend section. The material has been provided by InstaForex Company - www.instaforex.com |
| GBP/USD: plan for the American session on August 19 Posted: 19 Aug 2020 05:46 AM PDT To open long positions on GBPUSD, you need: In the first half of the day, several signals were formed to sell the British pound, which brought a fairly good profit of about 50 points of movement within the day. Closing long positions on the pound occurred after the lack of reaction from major players to good data on the growth of inflation in the UK. If you look at the 5-minute chart, you will see how the bears form a false breakout in the resistance area of 1.3269 and start pushing the pair into the support area of 1.3212. But even if you did not manage to enter on this signal, an additional entry point was formed in short positions after the pair returned to this range again. At the moment, the bulls are trying to protect the level of 1.3212, but only the formation of a false breakout on it and a return to this range with its top-down test in the second half of the day will be a signal to open long positions. The goal will be to return to the maximum of 1.3260, as it is unlikely to break above this level. In the scenario of a further decline in the pound, it is best to postpone long positions until the update of the minimum of 1.3173, the test of which may take place after the publication of the Federal Reserve minutes.
To open short positions on GBPUSD, you need: The bears did a great job in the morning and are now trying to gain a foothold below the level of 1.3212. While trading will be conducted below this range, most likely the pressure on the pound will continue, and an unsuccessful attempt to return to this range followed by another decline in the GBP/USD at 1.3212 in the second half of the day will be an excellent signal to build up short positions in the expectation of returning the pound to the area of the minimum of 1.3173, where I recommend fixing the profits. Too good protocols of the Federal Reserve System may lead to further decline of the pair to the support area of 1.3126. In the scenario of buyers returning support to 1.3212 in the second half of the day, and this option seems more realistic, it is best to sell the pound again on a rebound from the resistance of 1.3260 in the calculation of a correction of 20-30 points within the day.
Signals of indicators: Moving averages Trading is conducted above the 30 and 50 daily averages, which indicates the development of a bull market. Note: The period and prices of moving averages are considered by the author on the hourly chart H1 and differ from the general definition of the classic daily moving averages on the daily chart D1. Bollinger Bands If the pound rises in the second half of the day, the upper limit of the indicator around 1.3260 will act as a resistance. Description of indicators
|
| Fed minutes may not support the dollar, correction may be expected Posted: 19 Aug 2020 05:44 AM PDT
The US dollar continues to trade at multi-month lows against a basket of major competitors. The pressure on the greenback comes from falling Treasury yields. Nervousness is added by the expected publication of the minutes of the meeting of the Federal Reserve. It is possible that the Fed's "minutes" will not reflect any important changes in the regulator's rhetoric. However, the comments should help market players predict the dynamics of the monetary policy rate in the near future. In addition, officials may announce their willingness to be patient with higher inflation rates. This means that today's publication of the protocols will not support the dollar, on the contrary, in this scenario, the pressure on it may increase.
However, the greenback remains extremely weak even without additional factors. Clouds continue to gather over the new bill on the fiscal stimulus package. This is no longer just a dead-end situation, but something more. The day before, US President Donald Trump made it clear that he is not going to make concessions to the Democrats and will continue to insist on his version of the aid package. The pre-election race adds volatility to the market. The biggest risk for the dollar, according to most currency strategists, is the fact that power in Congress and the White House will pass into the hands of Democrats. They, in turn, may cancel the tax cut approved in 2017, which will negatively affect the growth of profits in the corporate sector. In addition, the US stock market rose to all-time highs. This supports risky assets and is one of the main reasons for the fall of the greenback. On Tuesday, the stock market finally saw an update of the historic highs for the S&P 500. The next targets have shifted to the 3425 - 3445 p. The region from where stronger movements may come. Meanwhile, Morgan Stanley chooses the US dollar as the best currency of the turbulent 2020, separating it from the "three" of defensive assets, which also includes the Japanese yen and the Swiss franc. "We expect the US dollar to become the best safe haven currency, especially now that low interest rates in the US make it a more attractive funding currency for carry trades," the bank said in a research note. However, banking strategists are now maintaining a bearish bias in the US dollar. In their opinion, the positive attitude towards risky assets will remain for the time being. The impasse with economic stimulation, political uncertainty, as well as weak macroeconomic data is damaging the US dollar. The longer this situation continues, the greater the risk that the dollar sell-off will turn into a real debacle. As for the Swiss franc, Morgan Stanley added that the upside potential is limited by currency interventions by the country's regulator. However, at the moment the USD / CHF pair requires close attention. Its rate is actively declining on Wednesday. This week alone, the dollar lost 0.6% to the franc, hitting a 5-year low of 0.90. Given the continued flight from the dollar, the aggressive sell-off in USD / CHF may continue.
|
| EUR/USD: plan for the American session on August 19 Posted: 19 Aug 2020 05:44 AM PDT To open long positions on EURUSD, you need: In the first half of the day, buyers of the European currency managed to protect the support level of 1.1920, however, the data on inflation in the Eurozone failed, resulting in the pair hovering in a side channel. Also, a new resistance was formed in the area of 1.1952, which will be emphasized in the second half of the day. Only a break and consolidation above this level will serve as a signal to open long positions in the expectation of continuing the bullish trend to the maximum area of 1.1994. A more distant goal will be the area of 1.2022, where I recommend fixing the profits. Demand for the euro may also grow after the publication of the Federal Reserve minutes, so even if the correction to the support of 1.1920 and an attempt to break it, which the bulls will try to prevent, you should not expect a major fall in the pair. Most likely, buyers will show themselves after updating the minimum of 1.1884, where the lower border of the current ascending channel passes and where you can open long positions immediately for a rebound in the expectation of a correction of 25-30 points within the day.
To open short positions on EURUSD, you need: Sellers need to hold the resistance of 1.1952, which was formed today in the first half of the day, as there are no other options for them yet. Only the formation of a false breakout there will bring down the aggressive upward potential of the European currency, and the first goal of the bears will be support for 1.1920, where the average moving averages that play on the side of euro buyers are held. The longer-term goal will be the area of 1.1884, where I recommend fixing the profits. In case of further growth of EUR/USD on the trend, and most likely the pressure on the US dollar will return after the publication of the Federal Reserve minutes, it is best to open short positions on a rebound from the resistance of 1.1994 in the calculation of a correction of 30-40 points within the day or sell the pair from the maximum of 1.2022.
Signals of indicators: Moving averages Trading is conducted above the 30 and 50 daily moving averages, which indicates the continuation of the bull market. Note: The period and prices of moving averages are considered by the author on the hourly chart H1 and differ from the general definition of the classic daily moving averages on the daily chart D1. Bollinger Bands Volatility has decreased significantly and the breakdown of the lower border of the indicator in the area of 1.1925 may increase pressure on the euro. Breaking the upper limit at 1.1945 will lead to a new wave of euro growth. Description of indicators
|
| Comprehensive analysis of movement options for EUR/USD & GBP/USD (H1) on August 19-21, 2020 Posted: 19 Aug 2020 04:29 AM PDT Minuette operational scale (H1) Reports from the forex-front and operational review of options for the movement of EUR/USD & GBP/USD in the H1 time frame from August 19-21, 2020. ____________________ Euro vs US dollar The development of the movement of the single European currency EUR/USD on August 19-20, 2020 will depend on the development and direction of the breakdown of the borders of the 1/2 Median Line channel (1.1960 - 1.1946 - 1.1935) of the Micro operational scale forks - the movement markings within this channel are shown in the animated chart. A breakdown of the support level of 1.1935 at the lower border of the 1/2 medium Line Micro channel will direct the movement of EUR/USD to the borders of the equilibrium zone (1.1905 - 1.1885 - 1.1865) of the Micro operational scale forks and 1/2 medium Line channel (1.1855 - 1.1830 - 1.1805) of the Minuette operational scale fork. The breakdown of the resistance level of 1.1960 at the upper border of the 1/2 Median Line Micro channel will determine the development of the movement of the single European currency within the equilibrium zone (1.1960 - 1.2000 - 1.2040) of the Minuette operational scale. We look at the EUR/USD movement options on August 19-21, 2020 on the animated chart.
____________________ Great Britain pound vs US dollar The development of the movement of Her Majesty's currency GBP/USD on August 19-21, 2020 will also be determined by the development and direction of the breakdown of the boundaries of the 1/2 Median Line channel (1.3245 - 1.3230 - 1.3215) of the Micro operational scale forks - the movement markings within this channel are shown in the animated chart. In case of breakdown of the lower border of the 1/2 Median Line Micro channel - support level of 1.3215 - the downward movement of GBP/USD can be continued to the boundaries of the equilibrium zone (1.3205 - 1.3190 - 1.3170) of the Micro operational scale, and in case of breakdown of ISL61.8 Micro (1.3170), it will become possible for the price of the instrument to reach the equilibrium zone (1.3145 - 1.3110 - 1.3075) of the Minuette operational scale fork. If the resistance level of 1.3245 breaks at the upper border of the channel 1/2 Median Line Micro, it will be possible to continue the development of the upward movement of GBP/USD to the goals:
Details of the development of the GBP/USD movement on August 19-21, 2020 are shown on the animated chart.
____________________ The review is compiled without taking into account the news background, the opening of trading sessions of the main financial centers and is not a guide to action (placing "sell" or "buy" orders). Formula for calculating the dollar index: USDX = 50.14348112 * USDEUR0.576 * USDJPY0.136 * USDGBP0.119 * USDCAD0.091 * USDSEK0.042 * USDCHF0.036. Where the power coefficients correspond to the weights of currencies in the basket: Euro - 57.6 %; Yen - 13.6 %; Pound - 11.9 %; Canadian dollar - 9.1 %; Swedish Krona - 4.2 %; Swiss franc - 3.6 %. The first coefficient in the formula brings the index value to 100 on the starting date - March 1973, when the main currencies began to be freely quoted relative to each other. The material has been provided by InstaForex Company - www.instaforex.com |
| Gold loses momentum for growth Posted: 19 Aug 2020 04:27 AM PDT Looking at the weakening US dollar and the first capital inflows in ETFs over the past 8 days, gold is trying to return above the psychologically important $ 2000 per ounce mark, but so far the "bulls" are not able to do this. Ahead of the publication of the minutes of the July FOMC meeting, investors prefer not to force events. It is expected that the Fed will announce its desire to tolerate high inflation for as long as necessary, which could be bad news for the US currency and good for the precious metal, but much will depend on the fate of the latter COVID-19. The impressive almost 30% rally in XAU/USD since the beginning of the year was made possible by a combination of several factors: a weak dollar, low US Treasury bond yields, and a more than 30% increase in stocks of gold-focused specialized exchange-traded funds since the beginning of January. However, rumors about the vaccine and the belief in an early victory over the coronavirus make fans of the precious metal hold their horses. Gold is sensitive to the yield of US Treasury bonds and it is sensitive to the pandemic. This is clearly seen in the dynamics of the ratio of shares in the technology sector and shares in pharmaceutical companies that develop vaccines. Treasury bond response to the pandemic
Success in fighting the virus is crucial for both the US economy and the US dollar. It is currently losing out to the euro due to divergence in the rate of GDP recovery, however, the situation may change due to the second wave of COVID-19 in Europe or due to other factors. I do not think that the resumption of the trade war will help the "American", as it was in 2018-2019. Donald Trump canceled talks between Washington and Beijing on August 15, saying that he did not want to talk to China, which could prevent the spread of the pandemic. In my opinion, the escalation of the conflict will increase the risks of sales of the dollar in the process of diversification of reserves by central banks in favor of the euro and other G10 currencies. Gold can benefit from this, but the White House is unlikely to want to revive the story of import duties ahead of the elections. As for inflation and the weakening of the world's main monetary units due to the colossal monetary stimulus, financial markets have already passed this in 2009-2011, which led first to the growth of the precious metal to record highs of $ 1921 per ounce, and then to the formation of a "bear" market. I don't rule out a repeat of history. Yes, consumer prices are gradually recovering their lost positions, however, it is not a fact that they will significantly exceed the Fed's 2% target. In the end, high inflation in a weak economy is very rare for developed countries. Thus, the more positive news about COVID-19, the higher the chances of growth in US Treasury bond yields and gold correction. In my opinion, the precious metal is ready to enter the medium-term consolidation in the range of $ 1850-2050, while the rebound from the resistance at $ 2015 and $ 2050, as well as the fall below the support at $ 1970 and $ 1945 per ounce makes sense to use for sales. Gold, the daily chart
|
| Oil prices: to rise or to fall? Posted: 19 Aug 2020 04:22 AM PDT
Oil prices are falling again due to uncertainty about a new economic stimulus package in the US. Moreover, relations between China and the United States are deteriorating every day. On Monday, it became known that new measures would restrict access of the Chinese telecommunications company Huawei Technologies Co. to the key components for its work. Moreover, in some countries restrictive measures were reintroduced due to the coronavirus infection. Wood Mackenzie analysts believe that this is a serious threat to the recovery in oil demand. Dulles Vaughn of Wood Mackenzie is sure that the second major lockdown will deepen the recession and possibly delay the GDP recovery until 2022. It will simply crush the oil and gas sectors. The company expects Brent crude to rise to $86 per barrel by 2030. But in the case of a second wave of coronavirus and its consequences, analysts expect an increase to $70 per barrel. The execution level of the OPEC deal was 95% in July while countries outside the OPEC group complied with their obligations by 96%. Thus, OPEC countries reduced production less than they should have done under the terms of the deal. Those countries that did not fulfill the terms of the deal will be obliged to compensate the shortfall in August and September. October's futures for Brent crude dropped by 0.40% to $45.19 per barrel, while September's futures for WTI decreased by 1% to trade at $42.46 per barrel. In April, Brent crude oil prices fell below $15.9 due to global lockdowns imposed to prevent the spread of the coronavirus. Experts believe that in the near future, the situation with the balance of supply and demand in the oil market may worsen, since the volume of oil reserves is still large. Oil prices are quite justified today, as analysts from Bank of America said. Firstly, demand is recovering slowly, secondly, the OPEC + countries strictly comply with the terms of the deal, and, finally, oil production in countries outside the OPEC + group is falling. These three factors keep quotes on the current level. On August 1, the new terms of the OPEC + deal came into force. Oil production will be reduced to 7.7 million barrels per day. These conditions are expected to continue through December 31st. The leaders of the group said confidently that they did not intend to soften quotas amid rising oil prices. Most likely, they will change plans for countries that do not fully comply with the agreement, such as Iraq and Nigeria. Nevertheless, today, the second wave of COVID-19 and the return of quarantines remain the main threat. The situation with the demand for oil products is the main driver of oil prices. The pandemic factor does not allow the economy to recover as fast as possible, as well as the removal of restrictions on businesses and the movement of people. However, some experts believe that the coronavirus will no longer have a critical impact on quotes. Governments of the largest countries will not agree to block their economies again. One of the main factors that influenced oil prices is the situation in the American shale sector. It was hit hardest by the collapse in oil prices. Capital expenditures fell by 30-40%, the number of active drilling rigs in the United States fell to the lowest level over the last 15 years to 172 units. Most companies are on the verge of bankruptcy. Some of them also filed for bankruptcy, for example, the largest American shale oil producer Chesapeake Energy. Experts believe that at the moment it is impossible to talk about an early recovery in the industry. First of all, oil prices should stabilize at higher levels. Will prices be able to return to the pre-crisis levels? Experts believe it will take at least a year to reach $60 per barrel only if there is no second wave of coronavirus. Sustainable growth can be expected only after a full recovery in demand, which will take a long time. However, experts warn of a possible price correction against the backdrop of the US presidential election and a worsening economic situation. In this case, oil prices will not rise above $40-45 per barrel even in 2021. The material has been provided by InstaForex Company - www.instaforex.com |
| Posted: 19 Aug 2020 04:22 AM PDT Further Development
Analyzing the current trading chart of BTC, I found that there is potential completion of the downside correction ABC and continuation of the uptrend. Key Levels: Key pivot support level is set: $11,600 Resistance levels: $12,085 and $12,180 The material has been provided by InstaForex Company - www.instaforex.com |
| Posted: 19 Aug 2020 04:17 AM PDT But just take note that with all things OPEC+ related, there's a likelihood it could be delayed for a few minutes or hours and what not. So, it will happen when it happens. That said, the meeting today is likely just to reaffirm the bloc's commitment to production cuts and to assess the compliance over the past two months. The July compliance is slated to be at around 95% to 97% - down from 107% in June - but it shouldn't be much of a problem all things considered, especially since oil prices are holding at more favorable levels (at least from the bloc's perception).
The Gold is in the downside correction in my opinion and it is near the middle Bollinger band. The zone at $1,978-$1,966 seems like solid support pivot and you should watch carefully for the price action around it. Further Development
Analyzing the current trading chart of Gold, I found that there is potential completion of the downside correction and continuation of the uptrend. 1-Day relative strength performance Finviz
Based on the graph above I found that on the top of the list we got VIX and Orange Juice today and on the bottom Lean Hogs and Gasoline RBOB. Gold is in the bottom of the list, which is sign that sellers are in control today. Key Levels: Key pivot support level is set: $1,978 Resistance level: $20,15 The material has been provided by InstaForex Company - www.instaforex.com |
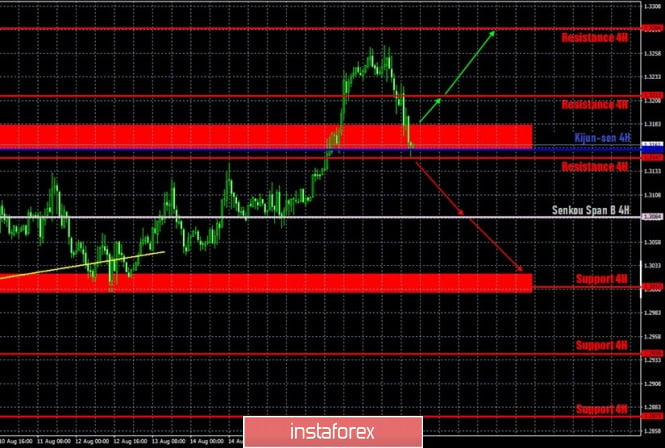
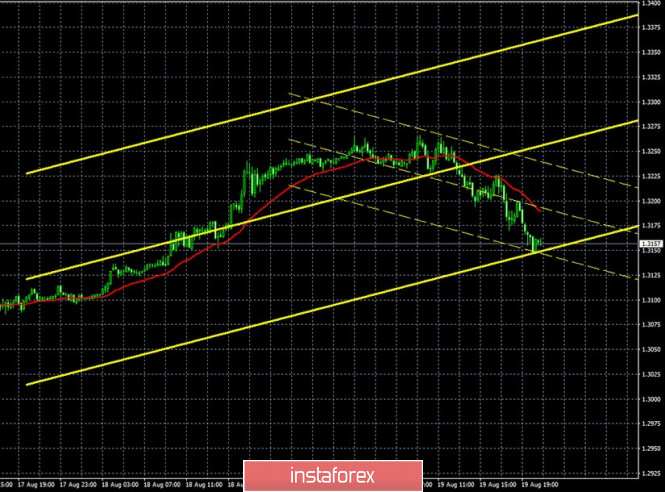
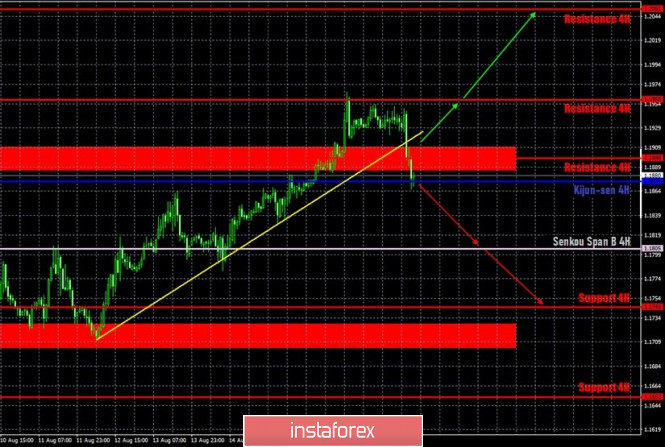
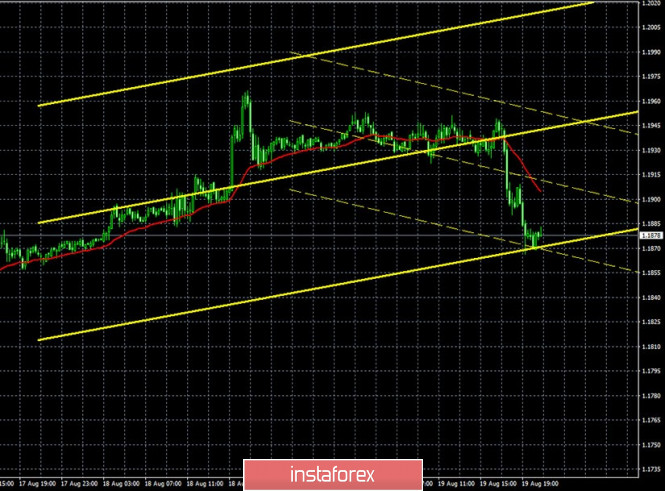
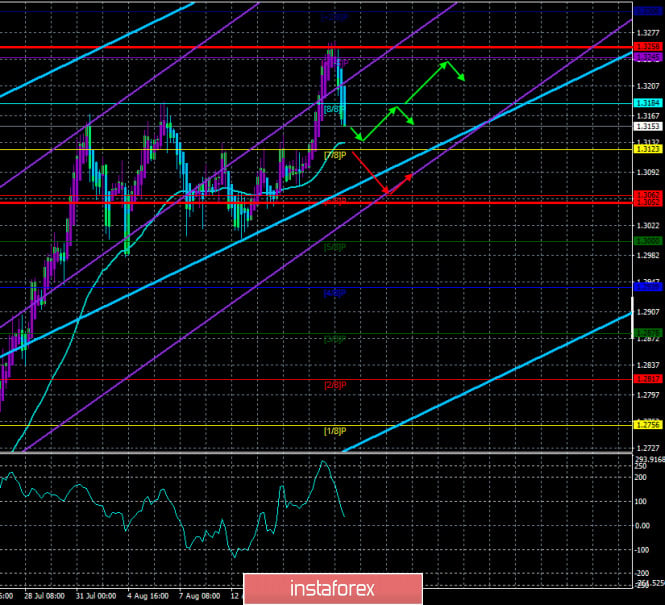
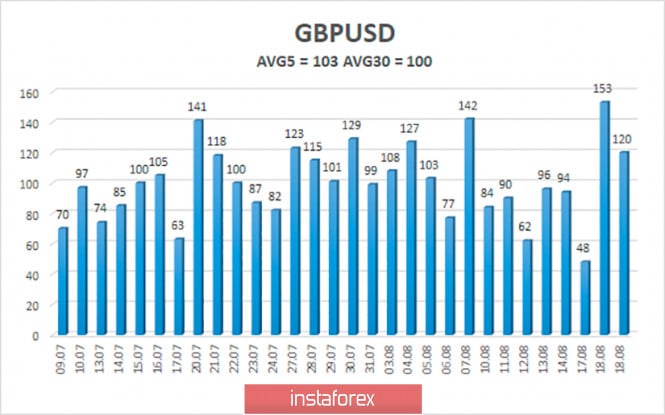
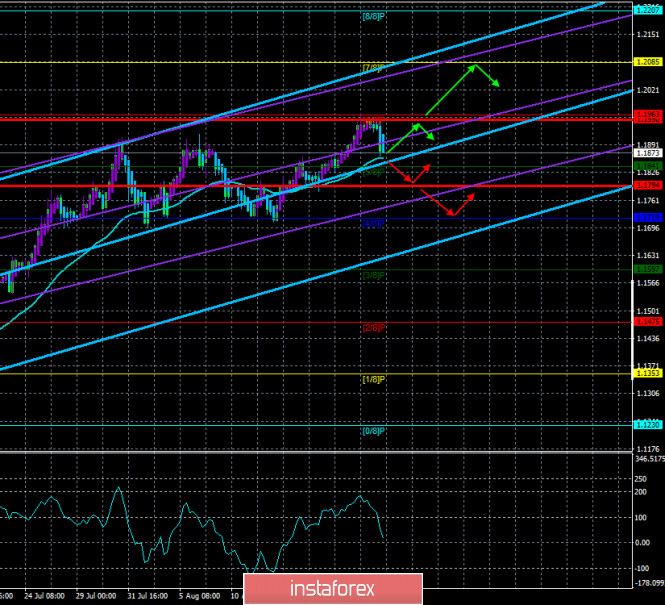
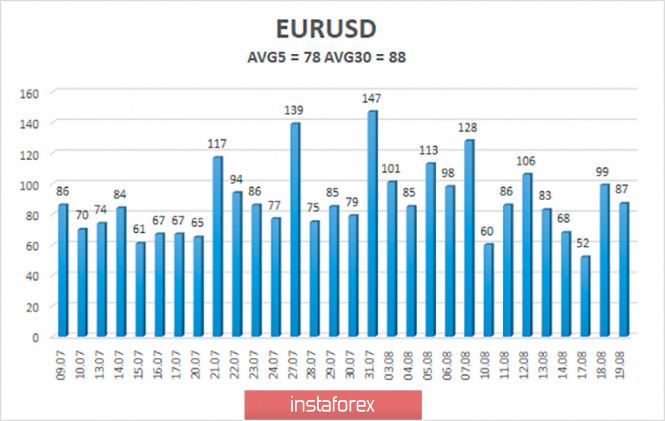
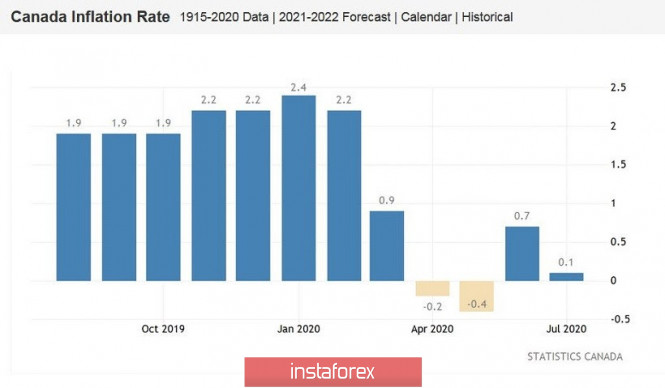
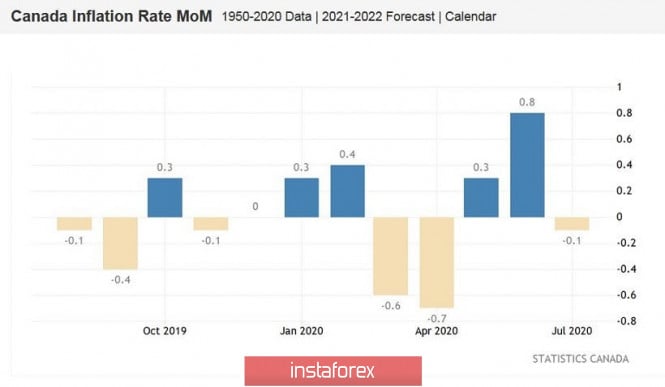
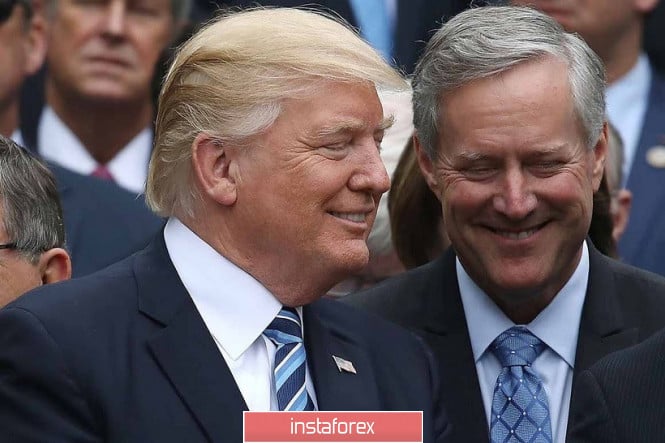
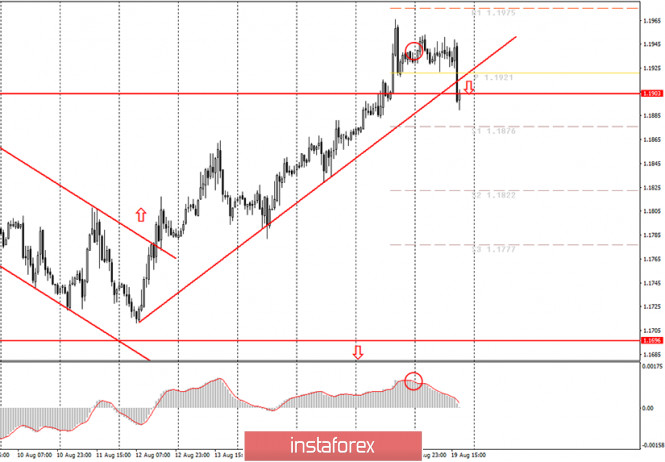
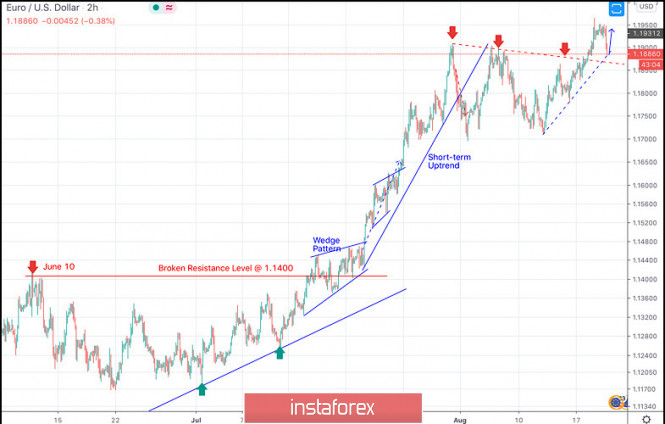
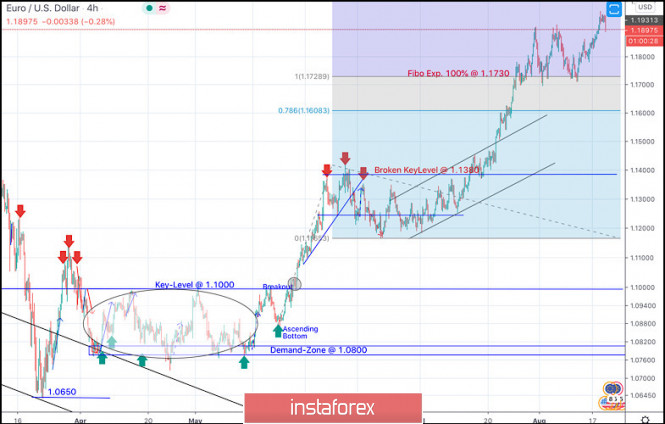
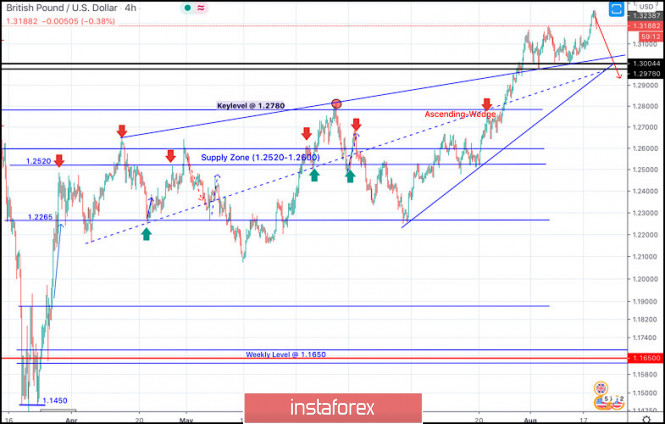

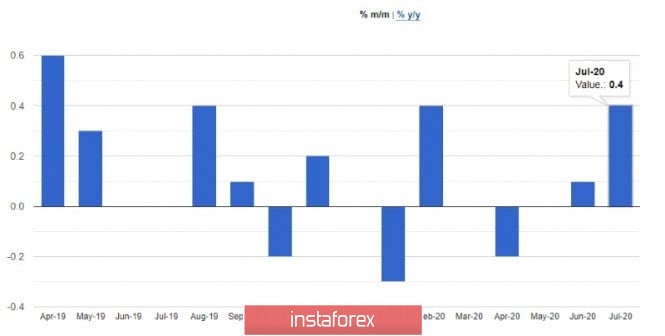
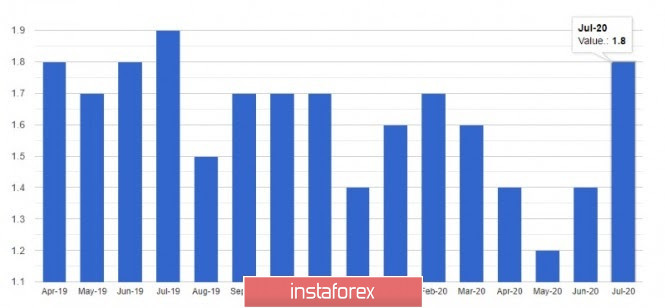
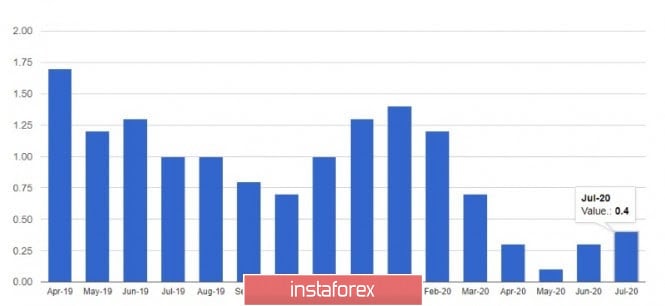
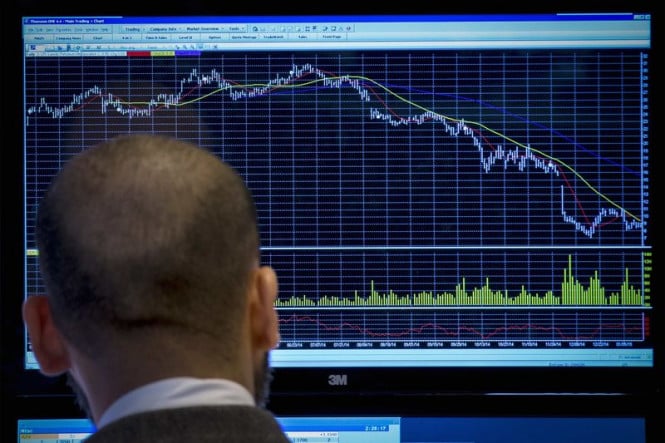
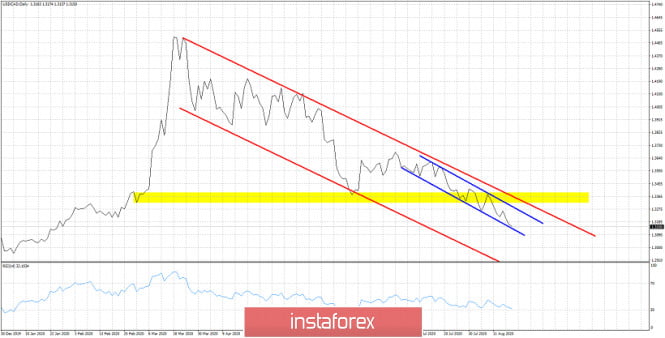
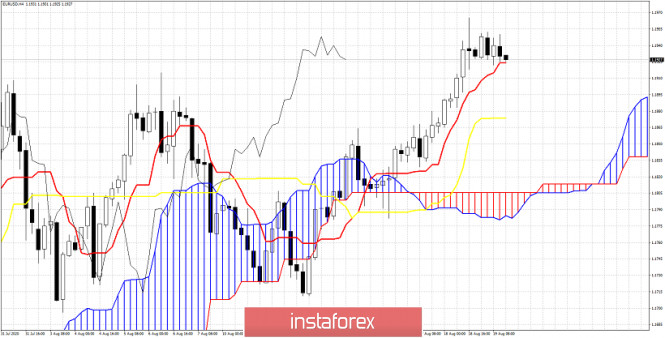
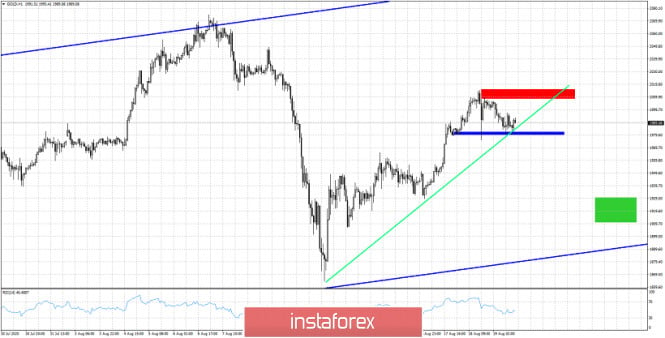
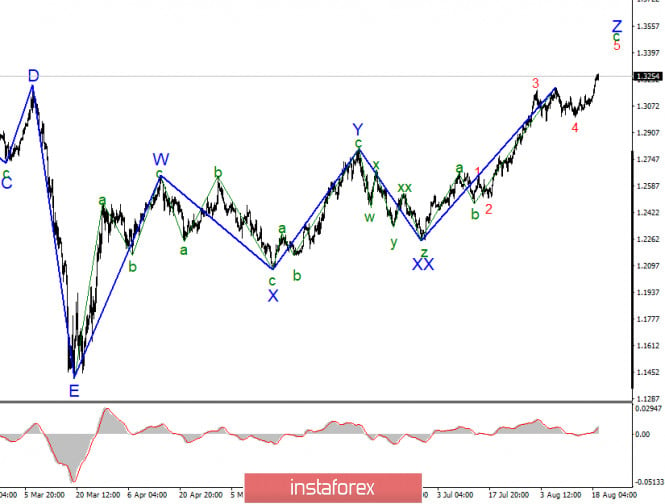
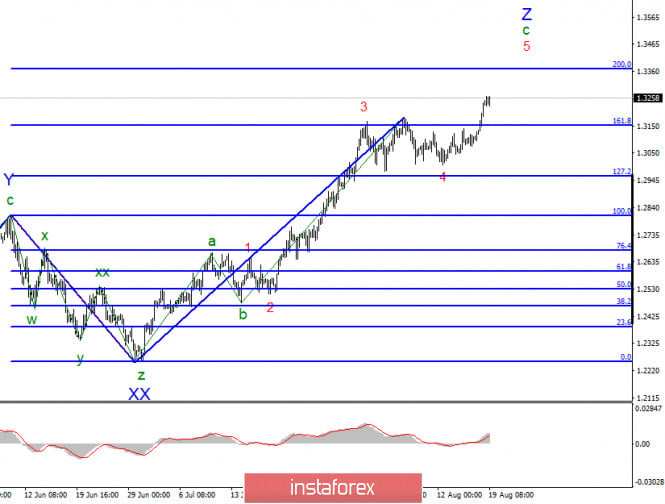
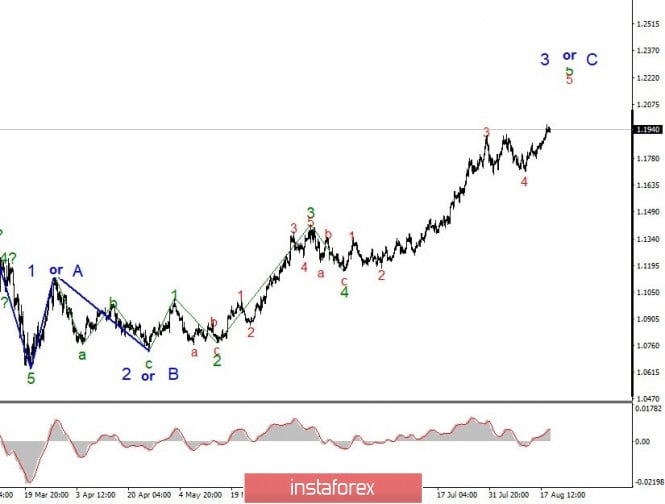
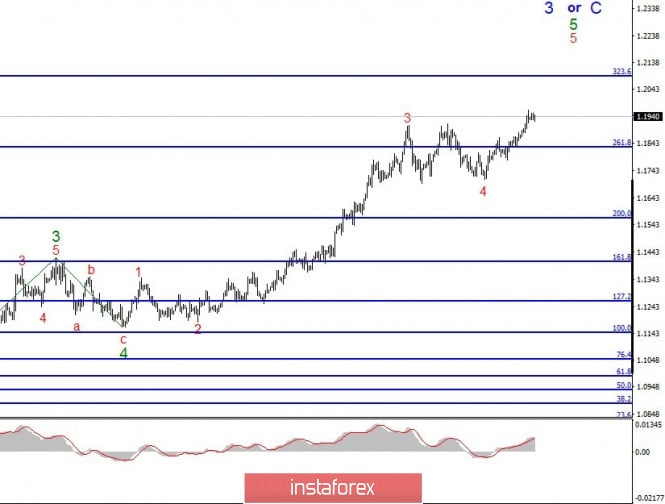

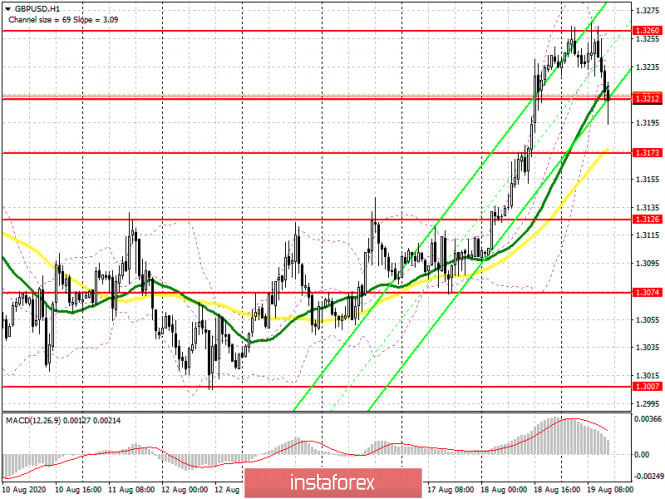
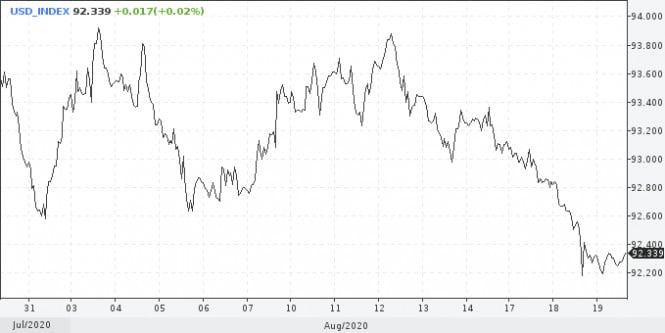
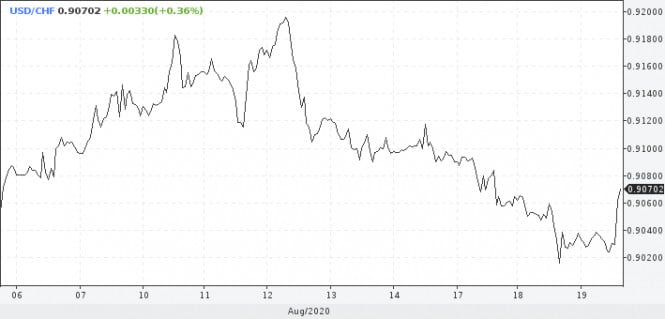
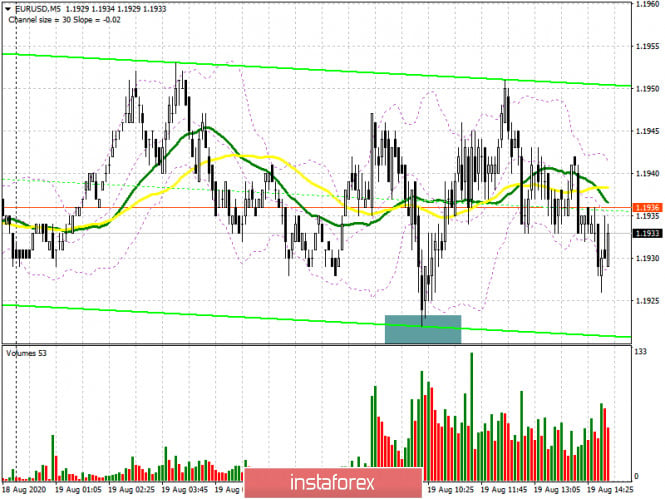
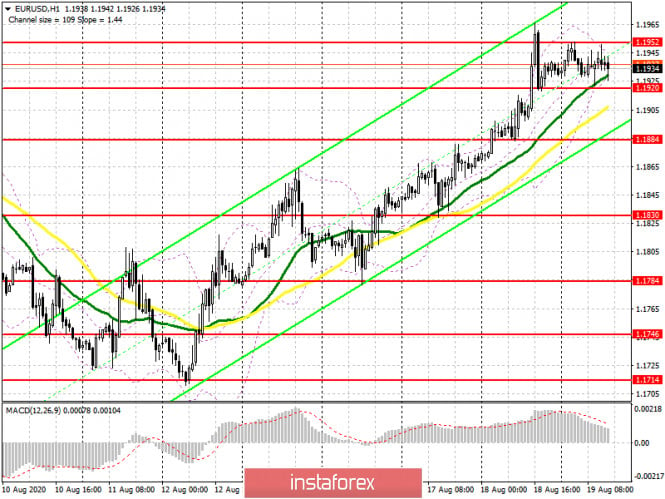
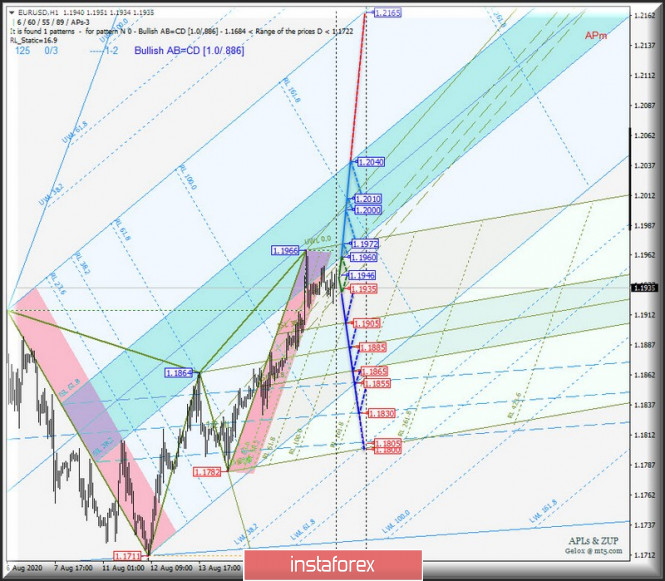
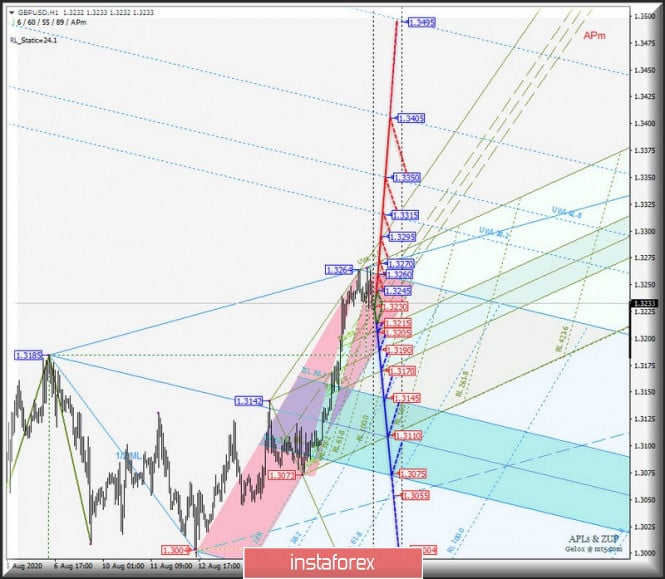
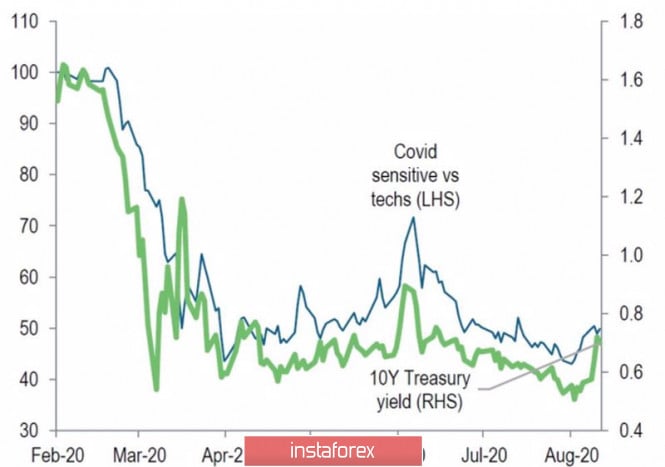
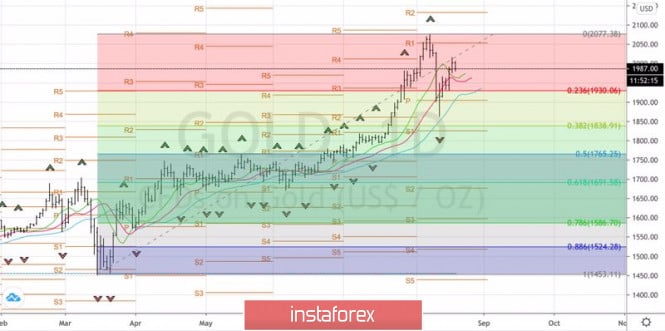


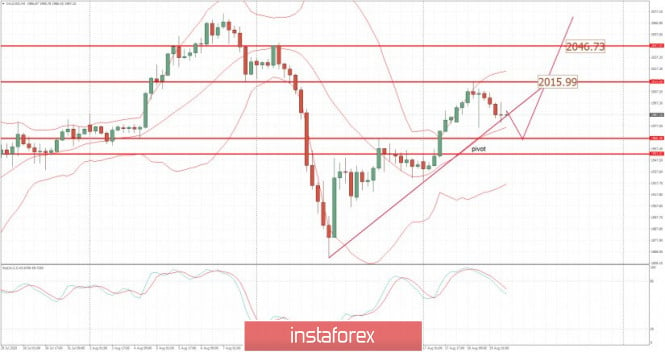
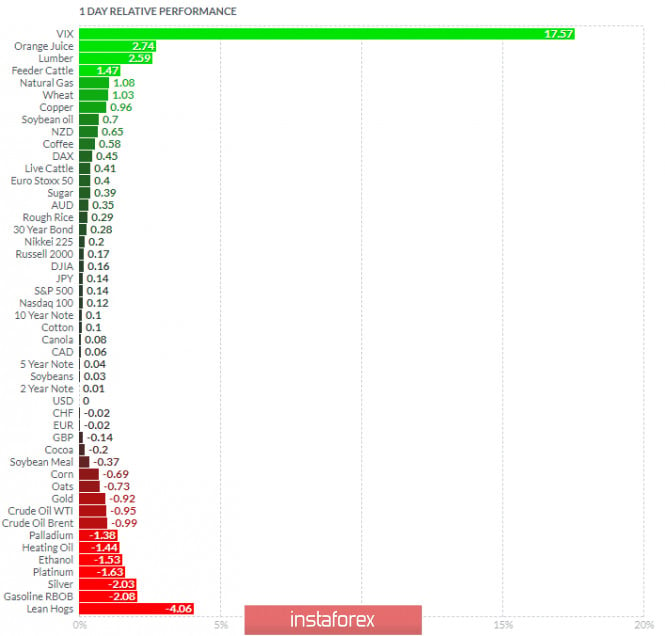
| You are subscribed to email updates from Forex analysis review. To stop receiving these emails, you may unsubscribe now. | Email delivery powered by Google |
| Google, 1600 Amphitheatre Parkway, Mountain View, CA 94043, United States | |
No comments:
Post a Comment