
Forex analysis review |
- Forecast for EUR/USD on September 11, 2020
- Forecast for GBP/USD on September 11, 2020
- Forecast for AUD/USD on September 11, 2020
- Forecast for USD/JPY on September 11, 2020
- Hot forecast and trading signals for GBP/USD on September 11. COT report. Pound lost another 200 points due to Boris Johnson's
- Hot forecast and trading signals for EUR/USD on September 11. COT report. Euro prepares to fall, as bulls pass 1.1886-1.1910
- Overview of the GBP/USD pair. September 11. In the UK, the second "wave" of the pandemic begins.
- Overview of the EUR/USD pair. September 11. The ECB did not tell the markets anything optimistic.
- Analytics and trading signals for beginners. How to trade EUR/USD on September 11. Analysis of Thursday deals. Getting ready
- Ichimoku cloud indicator Daily analysis of Gold for September 10, 2020
- EURUSD bounces off channel support
- USDCAD back tests break out area
- Comprehensive analysis of the main currency pairs EUR/GBP & EUR/JPY & GBP/JPY (Daily) on September 11, 2020
- September 10, 2020 : EUR/USD daily technical review and trade recommendations.
- September 10, 2020 : EUR/USD Intraday technical analysis and trade recommendations.
- September 10, 2020 : GBP/USD Intraday technical analysis and trade recommendations.
- Stock indices of US and Asia rise whereas in Europe, pressure becomes stronger
- EURUSD: Euro spiked upon ECB meeting results, prospects rebound to the 20th figure
- BTC analysis for September 10,.2020 -Breakout of the rising trendline in the background. Watch for breakout of the most recent
- Euro rises while European stock market collapses ahead of ECB meeting
- GBP/USD: plan for the American session on September 10
- EUR/USD: plan for the American session on September 10
- Euro rises after ECB meeting
- Technical analysis of AUD/USD for September 10, 2020
- Trading recommendations for GBP/USD on September 10
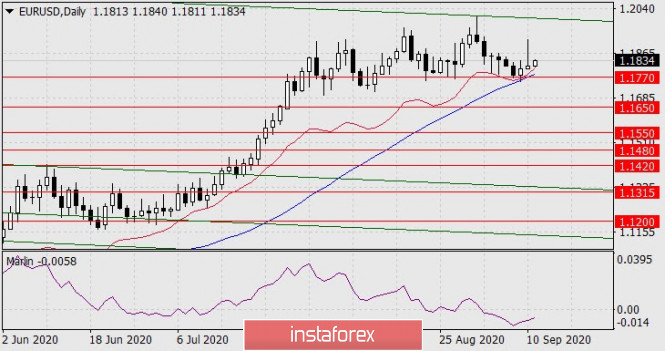
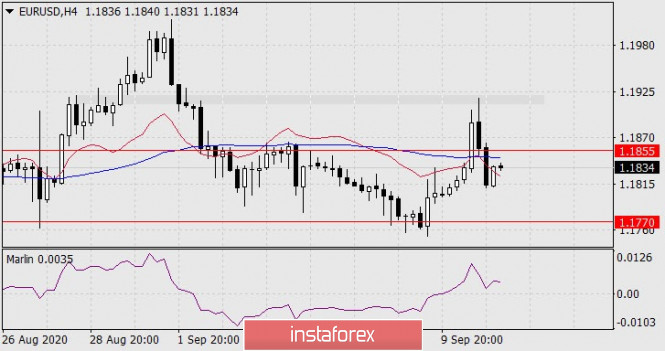
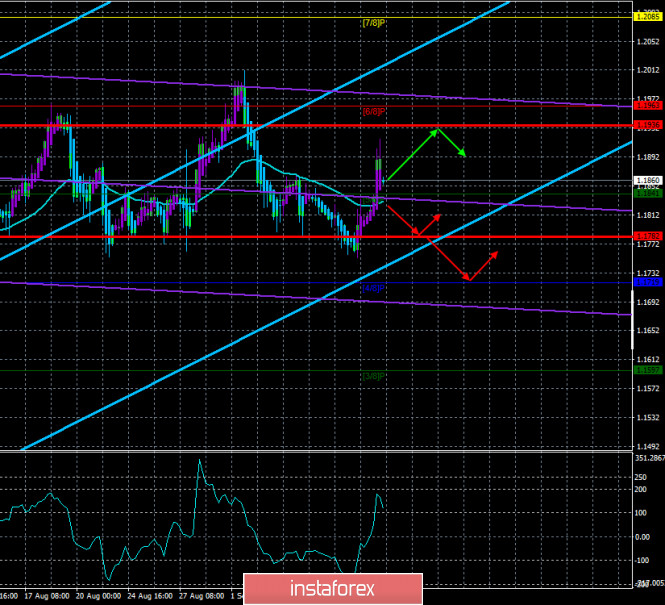
| Forecast for EUR/USD on September 11, 2020 Posted: 10 Sep 2020 08:22 PM PDT EUR/USD Yesterday's ECB meeting, as we expected, did not provide any surprises. The European Central Bank did not shock the public with a desire to control the euro exchange rate, refuse any targets, and only discussed the impact of the euro's current rate on the economy. The changes only affected the ECB's own forecast for GDP for the current year, which improved from -8.7% to -8.0%. There was no strong volatility in the market. The euro jumped by 110 points, but there was no significant reversal; the euro grew by 12 points by the end of the day. The MACD line has slightly increased on the four-hour chart, now the price needs to settle below the 1.1770 level in order to move towards 1.1650 and lower target levels. The price reached the second expected volatility level of 1.1920 on the four-hour chart, afterwards it fell and settled under the MACD line. The signal line of the Marlin oscillator is in the zone of positive values, therefore, preparing to fall further will take about two bars, that is, by tonight. Perhaps even longer. The 1.1770 level is strong enough. If there was no such attempt yesterday, the big players are unlikely to attack it today. So, we expect a sideways trend today, in preparation for an attack on 1.1770 next week. The material has been provided by InstaForex Company - www.instaforex.com |
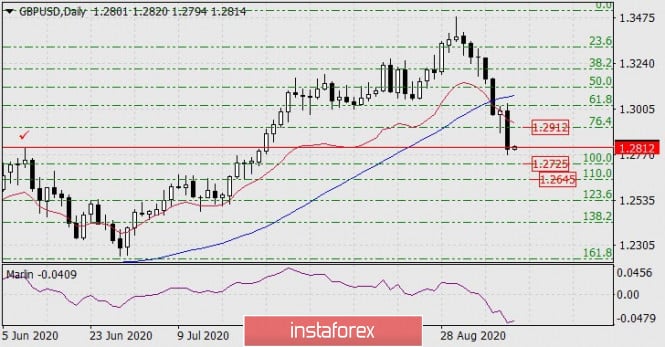
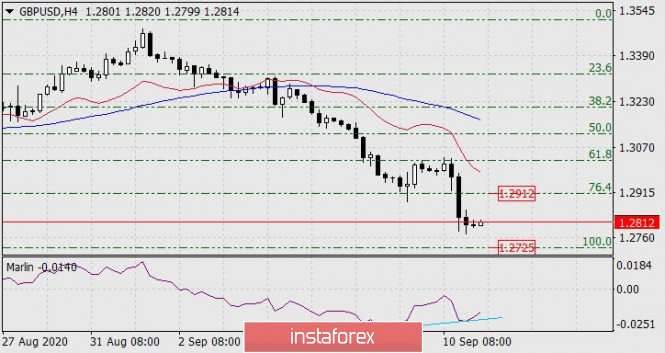
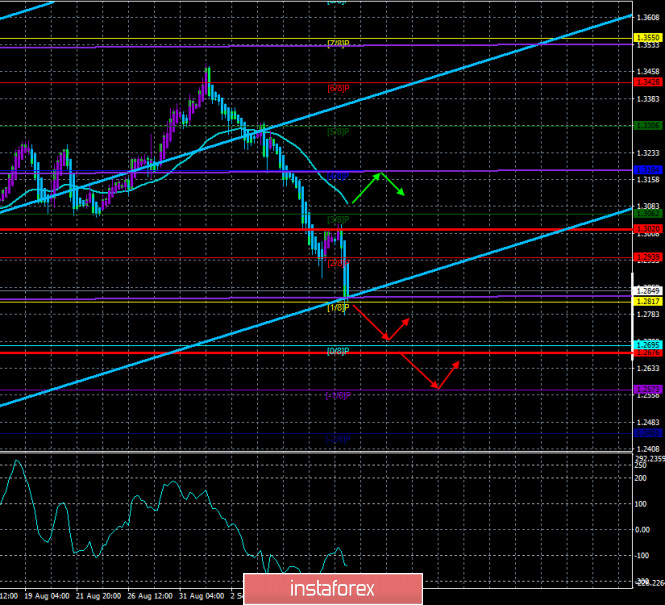
| Forecast for GBP/USD on September 11, 2020 Posted: 10 Sep 2020 08:22 PM PDT GBP/USD The British pound lost195 points yesterday on fears of a UK exit from the EU without a deal. We reached our June 10 high target at 1.2812. After setting the price below yesterday's low, we expect it to fall to 1.2725, 1.2645. The targets are determined at the Fibonacci levels of 100.0% and 110.0%. The price has converged with the Marlin oscillator on the four-hour timeframe. This is a prerequisite for correctional growth before the British pound falls to new targets. A correction is possible to the Fibonacci level of 76.4% at the price of 1.2912. |
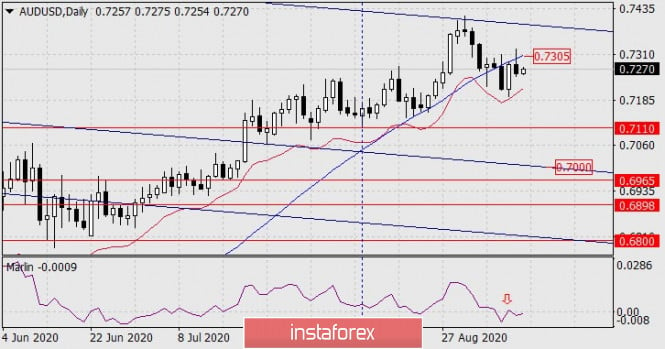
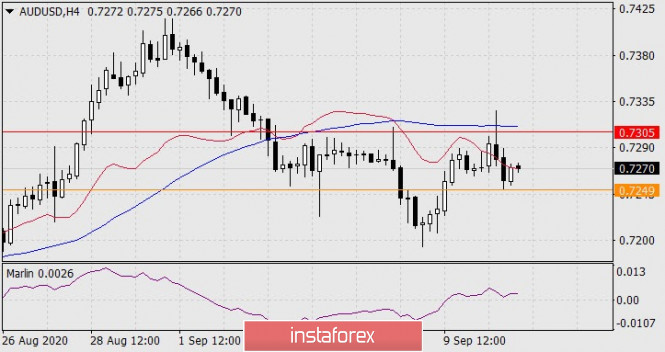
| Forecast for AUD/USD on September 11, 2020 Posted: 10 Sep 2020 08:22 PM PDT AUD/USD The Australian dollar decided to take advantage of the US currency's temporary weakness on Thursday amid increased volatility at the ECB meeting, but the euro's growth was soon reversed and the aussie could only pierce the resistance of the MACD line on the daily chart. The aussie lost 25 points at the end of the day. The price moved down when the signal line of the Marlin oscillator reached the limit of the growth area, from which it reversed to the downside. The price also pierced the MACD line on the four-hour chart, afterwards it tried to go under the balance indicator line. The Marlin oscillator is in the growing trend zone, we are waiting for it to return to the negative zone around the time when the price settles below yesterday's low of 0.7249. As this happens, the scenario makes it possible for the price to fall to an August 12 low of 0.7110. |
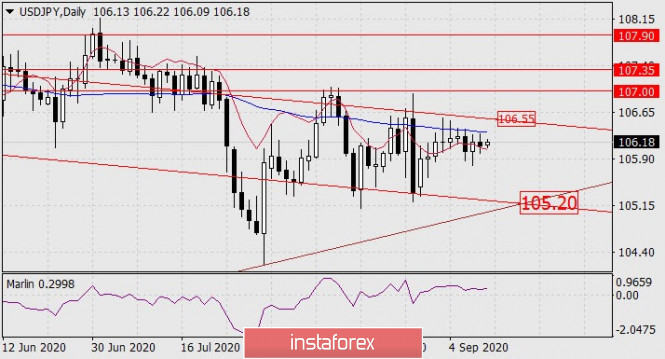
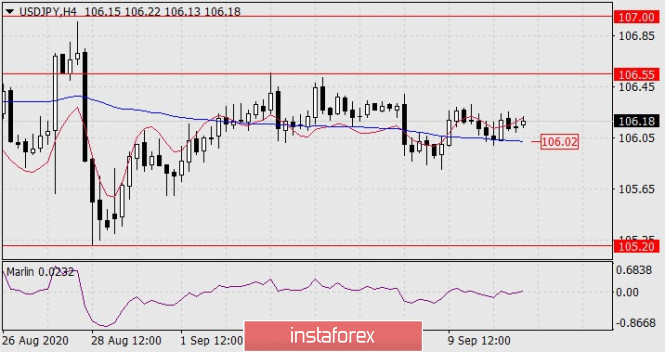
| Forecast for USD/JPY on September 11, 2020 Posted: 10 Sep 2020 08:22 PM PDT USD/JPY The correction continues in the US stock market. The S&P 500 fell 1.76% yesterday, which kept the yen from growing towards the long-planned goal of 106.55. The price slightly dropped, staying above the balance indicator line (daily chart), as it continues to go for an upward mood despite the rapid changes in external markets. The Marlin oscillator is in the growth zone, the 106.55 target is relevant, after the price breaks through the area above it, the quote will likely climb to 107.00. The MACD indicator line served as good support for the price on the four-hour chart. We see moderate growth in today's Asian session, while the Marlin oscillator has penetrated the growth zone. To some extent, the Japanese stock market helps the USD/JPY pair grow. Despite yesterday's collapse in the US market, the main Asia Pacific region indices are showing growth today. The material has been provided by InstaForex Company - www.instaforex.com |
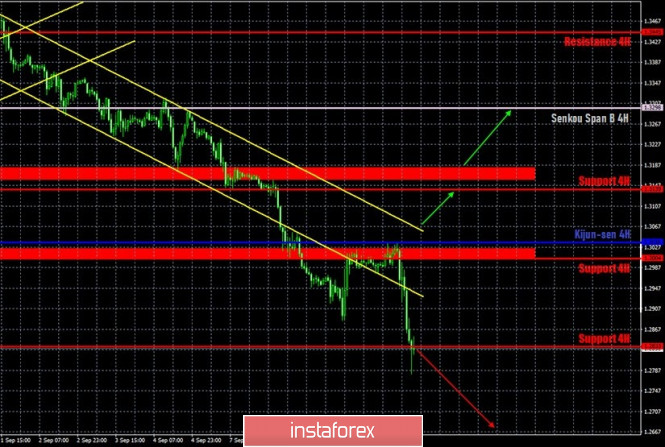
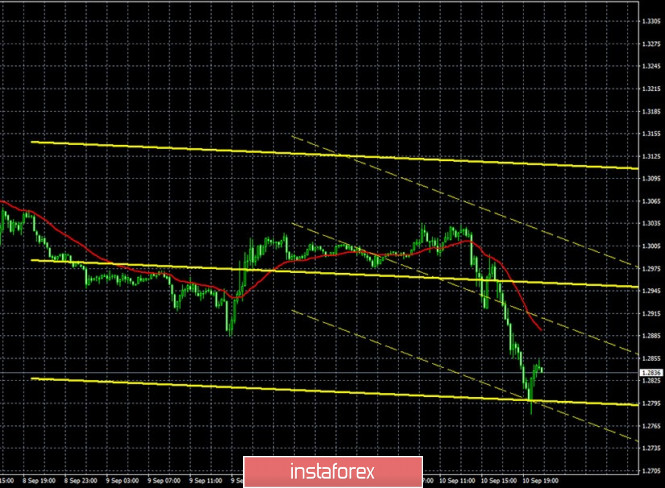
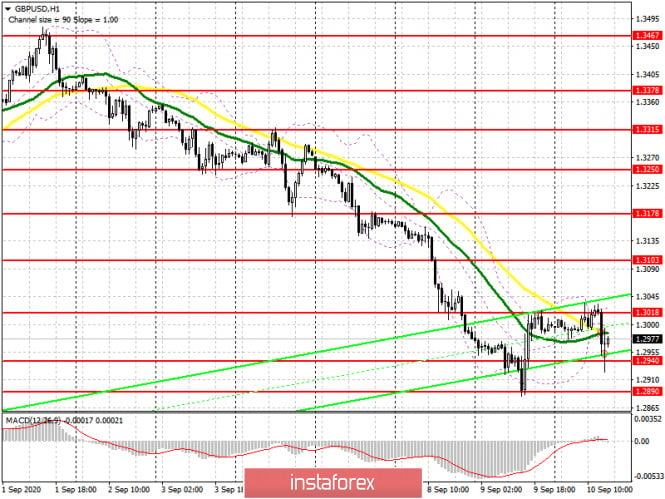
| Posted: 10 Sep 2020 06:58 PM PDT GBP/USD 1H The GBP/USD pair, in contrast to EUR/USD, continued to sharply fall on September 10. In principle, you can clearly see that the downward trend is going to extend, and the price has managed to go far below the downward channel. Yesterday, the pair failed to settle above the resistance area of 1.3004-1.3024 within the minimum upward correction, afterwards, it rebounded and collapsed again. Therefore, a clear signal for new sell positions appeared. At the moment, the quotes have reached the final, third support level for this week at 1.2833 and may begin to correct. Although everything depends on the fundamental background from the UK, which market participants ignored for a long time, and on the mood of the bears. GBP/USD 1H Both linear regression channels are directed downward on the 15-minute frame, thus, we can conclude that the downtrend will continue. The latest Commitments of Traders (COT) report on the British pound was more unexpected than the euro currency report. If non-commercial traders were already shorting the euro, the same category of traders continued to place longs. In total, professional traders opened 5,500 new Buy-contracts (longs) and 3,000 new Sell-contracts (shorts) during the reporting week (August 26 - September 1), thus, their net position even increased by 2,500, according to the new COT report. In principle, such data perfectly describes what is happening in the foreign exchange market, since the pound grew during all five trading days included in the report. The pound has been depreciating from September 1 to this day, but there is no hint that professional traders have stopped buying the pound in the latest COT report. But the new COT report, which will be released today, may show a sharp decrease in the net position for the non-commercial category. The fundamental background does not raise any questions at this time. No macroeconomic data published in either the UK or America. However, in any case, some traders consider data as irrelevant right now as they massively sell the British pound due to the actions of the British government and the complete uncertainty of the future. The last week and a half have become "black" for the pound and it can only thank British Prime Minister Boris Johnson for this, who continues to pretend to be US President Donald Trump or the ruler of earth and believes that the European Union should conclude such a trade deal as he wants. And if not, Johnson will bluff, blackmail and show his readiness to violate the principles of international law. London's actions are condemned not only by the EU, but also by the US and the countries that are part of the United Kingdom - Wales, Scotland and Northern Ireland. As for the uncertainty, there was plenty of it even before the events of September, and after them it is generally not clear what the British economy should expect in 2020-2021. It is entirely possible that Washington will refuse to discuss the trade deal at all, and Brussels will impose sanctions against Great Britain. Such is the price of Boris Johnson's actions, who, apart from Brexit, has nothing to boast of at the helm of a once great power. We have two trading ideas for September 11: 1) Buyers are still out of the market, bears are now ruling the show. Thus, you are recommended to consider buying the pound when the price settles above the downward channel and aim for 1.3139 and the Senkou Span B line (1.3298). Take Profit in this case will be from 60 to 220 points. 2) Sellers continue to pull down the pair, so short positions remain relevant. However, all of this week's targets have already been overcome, so setting the quotes below the 1.2833 level will allow you to trade short without targets or at the personal discretion of traders. Take Profit in this case can be almost anything. However, for safety in this case, we recommend placing a Stop Loss order. Explanations for illustrations: Support and Resistance Levels are the levels that serve as targets when buying or selling the pair. You can place Take Profit near these levels. Kijun-sen and Senkou Span B lines are lines of the Ichimoku indicator transferred to the hourly timeframe from the 4-hour one. Support and resistance areas are areas from which the price has repeatedly rebounded off. Yellow lines are trend lines, trend channels and any other technical patterns. The material has been provided by InstaForex Company - www.instaforex.com |
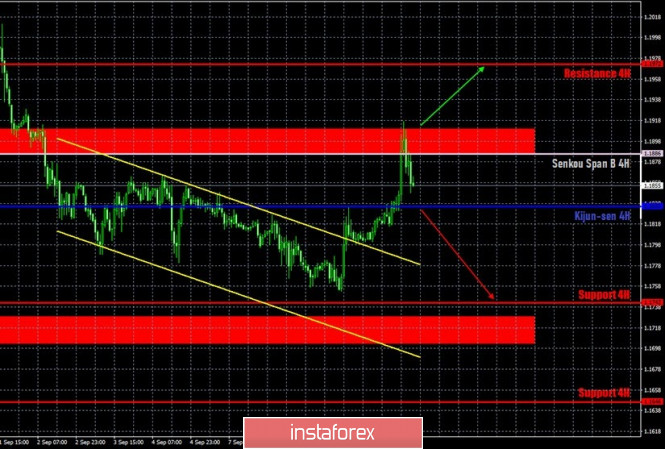
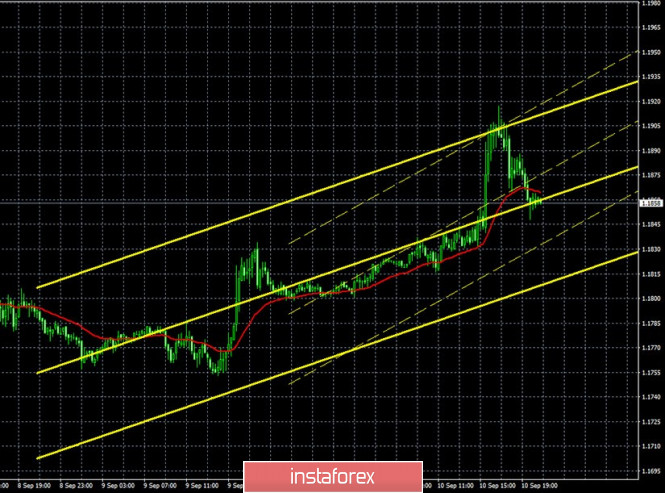
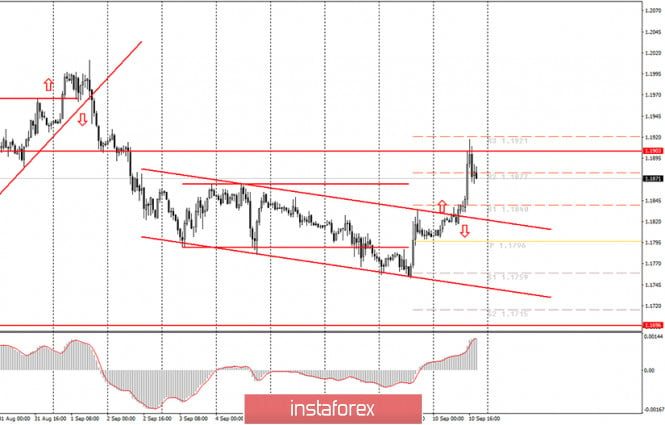
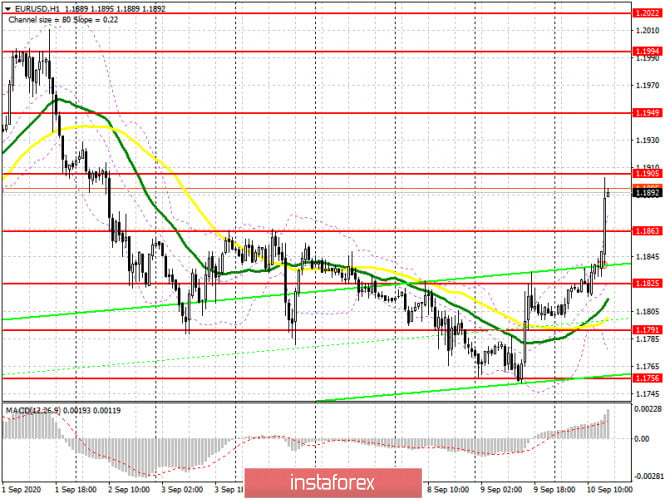
| Posted: 10 Sep 2020 06:56 PM PDT EUR/USD 1H The euro/dollar pair was almost growing all day on the hourly timeframe on September 10, and was in the resistance area of 1.1884-1.1910 by the end of the day. The price previously rebounded off this area at least four times. Actually, we have repeatedly said that the pair has been trading mainly in the sideways channel of 1.17-1.19 in the last month and a half and only occasionally makes attempts to leave it. In addition, the price likes to rebound off previous local lows and highs, of which a fairly large number has accumulated over the past month and a half. Thus, we can state the following based on Thursday's results: the pair remained inside the side channel and may pursue the lower line of this channel at 1.1700 in the coming days; quotes have left the downward channel, so we do not have a clear trend at this time, according to which you could trade. EUR/USD 1H Both linear regression channels turned upward on the 15-minute timeframe, but channels may start to go down on Friday. The latest Commitment of Traders (COT) report, which, let me remind you, comes out with a three-day delay so it only covers the dates from August 26 to September 1, unexpectedly showed that the "non-commercial" category of traders decreased their net position. Non-commercial traders are the most important category of traders who enter the foreign exchange market in order to make a profit. So, non-commercial traders reduced Buy-positions (longs) and opened Sell-contracts (shorts) during the reporting week. The number of Buy-contracts decreased by almost 11,000, while the number of Sell-contracts increased by 3,000. Thus, the net position immediately decreased by 14,000. We would like to take note that the euro did not fall in price during the reporting week, which is covered by the latest COT report. The euro strengthened during all five trading days, and only started to fall on September 1, which, in fact, did not last long. The downward movement continued from September 2 to September 8, however, quotes failed to get out of the range of 1.17-1.19, after which it began to grow. However, this growth will not be included in the next COT report, which will be released today. Therefore, we can see only small changes in the new report, since the technical picture for the euro has not significantly changed. The European Union summed up the results of the ECB meeting on September 10, which we talked about in detail in the fundamental review for the euro. Let's just say that, from our point of view, the euro's growth was completely unfounded and, given that it rebounded from the resistance area of 1.1884-1.1910, we believe that a new round of downward movement within the side channel will begin today. We highlight the US inflation report from today's macroeconomic reports. It is regaining a high degree of importance as the EU and US economies begin to recover and central banks are re-orienting themselves to inflation. If in the EU inflation collapsed to -0.2% in August, then it may remain at a very decent level of 1.0-1.2% y/y in the United States. And if we talk about core inflation, then it is 1.6% y/y. Thus, the US dollar can receive support today. We have two trading ideas for September 11: 1) Bulls made a fairly strong jump yesterday, but failed to gain a foothold above the 1.1884-1.1910 area. Therefore, we recommend that you only consider new long positions if this area is overcome with the target on the resistance level of 1.1972. Take Profit in this case will be about 50 points. 2) Bears got a new opportunity to pull down the EUR/USD pair to the lower area of the side channel of 1.17-1.19, since the 1.1884-1.1910 area was not overcome, a rebound was also made from the Senkou Span B line. And so we recommend that you wait until you get to settle below the Kijun-sen line (1.1835) and start trading down while aiming for 1.1742. The potential Take Profit in this case is about 80 points. Explanations for illustrations: Support and Resistance Levels are the levels that serve as targets when buying or selling the pair. You can place Take Profit near these levels. Kijun-sen and Senkou Span B lines are lines of the Ichimoku indicator transferred to the hourly timeframe from the 4-hour one. Support and resistance areas are areas from which the price has repeatedly rebounded off. Yellow lines are trend lines, trend channels and any other technical patterns. The material has been provided by InstaForex Company - www.instaforex.com |
| Overview of the GBP/USD pair. September 11. In the UK, the second "wave" of the pandemic begins. Posted: 10 Sep 2020 05:11 PM PDT 4-hour timeframe
Technical details: Higher linear regression channel: direction - upward. Lower linear regression channel: direction - sideways. Moving average (20; smoothed) - downward. CCI: -139.2198 The British pound, after a slight correction, resumed its downward movement within the downward trend that began a week and a half ago. The bears, who until September could not start a downward movement on the pound/dollar pair, finally cheered up and began to attack. Of course, the news from the UK helped them in this. Over the past week, all the publications have been writing about another failure of negotiations between London and Brussels, as well as about possible illegal actions of London in relation to the European Union, with which there is an agreement on the Northern Ireland border. In general, the pound is very sensitive to everything that is happening now in the UK and even "forgot" about the problems of the United States, which have not gone away. However, we have repeatedly written that traders have forgotten about the problems of Britain, so now, from our point of view, everything is logical. The British pound began to fall, which was suggested for a long time, since there were no special reasons for the growth of this currency in recent months. Meanwhile, Prime Minister Boris Johnson finally made an official statement and tried to explain what the new law is and what goals it pursues, putting it to a vote in parliament. Johnson stated: "My task is not only to preserve the integrity of the United Kingdom, but also to protect the peace on the island of Ireland and the Belfast Agreement. And to do this, we need an insurance tool — to protect our country from a radical or reckless reading of the protocol, which could lead to a border in the Irish sea and harm the interests of the Belfast Agreement." Thus, Johnson explained only what interested many political scientists and other experts from the very beginning of the "divorce" with the European Union. How will the border between Northern Ireland and Ireland be secured if the former leaves the EU with the Kingdom? Now the answer to this question has arrived: Boris Johnson and, perhaps, the entire British Parliament will simply violate previously reached agreements with Brussels and abandon some of the points of the agreement that most strictly regulate trade and customs on the border of the island of Ireland. Interestingly, Scotland, Northern Ireland and Wales immediately criticized this bill, saying that it violates the rule of law. It violates international law. Boris Johnson and his friends put themselves above the law. "I am extremely concerned about the British government's statements about plans to violate the EU withdrawal agreement. This would violate international law and undermine trust," Ursula von der Leyen, head of the European Commission, said in a statement. The US also criticized the bill, saying that it would be difficult for Britain and America to reach a free trade agreement if London so easily and simply violates international law and treaties with other countries (although it was in the context of the US Democratic Party, Joe Biden is a native of Belfast and honors the Belfast Agreement and peace on the island of Ireland). In general, thanks to the efforts of Boris Johnson and his followers, the UK can be severely damaged reputationally. And this is at a time when the country needs to negotiate with other countries on free trade. At a time when the country's economy has already suffered several serious blows. At a time when the country is experiencing some signs of the beginning of the second "wave" of the "coronavirus" epidemic. It is also important to note that some members of the Conservative Party also do not support such actions in London. "Britain may lose the moral superiority of a country that defends international law," said Tobias Ellwood, a Government Minister at the Ministry of Defence. "Our entire economy is built on the idea of Britain as a country that adheres to the rule of law," said Tom Tugendhat, Chairman of the Parliamentary Foreign Affairs Committee. However, many experts believe that the opposition of the British Parliament will not go under any circumstances to approve this law. Thus, the question will be only in the conservatives themselves. Last year, Boris Johnson was actively expelled from the party and was forced to withdraw those politicians who refused to blindly obey his word. Now is the time to find out how many conservatives are ready to support a completely absurd bill that will only show that no agreements need to be signed with the UK? Some conservatives are already speaking out against this bill, so it may remain a bill. There is also an option in which everything that happens is just another bluff from Boris Johnson. During the year of his rule, we have become accustomed to the fact that Johnson is a smaller copy of Donald Trump, who tries to act without obeying the rules. Trump does not always succeed, and even more so for Johnson. Last year, we wrote about Johnson's "five significant defeats as Prime Minister". So since then, no new victory has been achieved, however, the British government's liability can also be recorded in the fight against the "coronavirus", which was lost outright. Thus, it is absolutely possible that the bill will not be adopted, and all London's actions are aimed at showing Brussels its "character". Perhaps Johnson is trying to achieve additional concessions in negotiations with Michel Barnier in such a bizarre way. It is not yet clear. It will be known for sure next week when the vote on this bill will take place. Meanwhile, the second wave of the "coronavirus" epidemic seems to be beginning in the Foggy Albion. In recent weeks, the number of new cases has tripled, from about one thousand a day to three. This time, Johnson did not wait for the epidemic to cover the entire country and immediately imposed quarantine restrictions. It is expected that there will be a ban on gatherings of more than 6 people, and the work of public catering establishments will be prohibited from 22 hours to 5 am. There will also be new awareness-raising activities about the use of soap and masks by the population and new fines for non-compliance with certain regulations. "We must act immediately to stop the spread of the virus. Therefore, we simplify and strengthen the rules of social contacts, making them more understandable and accessible to the police," the British Prime Minister said. Well, the pound reacts extremely painfully to all this news, which is not surprising. The only question now is, how long will the sell-off of the pound continue by market participants? It is difficult to call the movement of the last 7-8 working days anything other than a landslide.
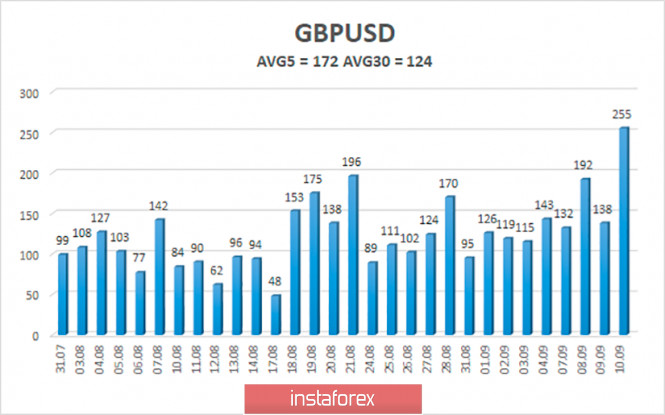
The average volatility of the GBP/USD pair is currently 172 points per day. For the pound/dollar pair, this value is "high". On Friday, September 11, therefore, we expect movement inside the channel, limited by the levels of 1.2676 and 1.3020. A reversal of the Heiken Ashi indicator to the top signals a new round of upward correction within the downward trend. Nearest support levels: S1 – 1.2817 S2 – 1.2695 S3 – 1.2573 Nearest resistance levels: R1 – 1.2939 R2 – 1.3062 R3 – 1.3184 Trading recommendations: The GBP/USD pair continues its downward slide on the 4-hour timeframe. Thus, today it is recommended to continue to stay in shorts with targets of 1.2695 and 1.2573 until the Heiken Ashi indicator turns upward. It is recommended to trade the pair for an increase with the first target of 1.3184 if the price returns to the area above the moving average line, which is not expected in the near future. The material has been provided by InstaForex Company - www.instaforex.com |
| Overview of the EUR/USD pair. September 11. The ECB did not tell the markets anything optimistic. Posted: 10 Sep 2020 05:11 PM PDT 4-hour timeframe
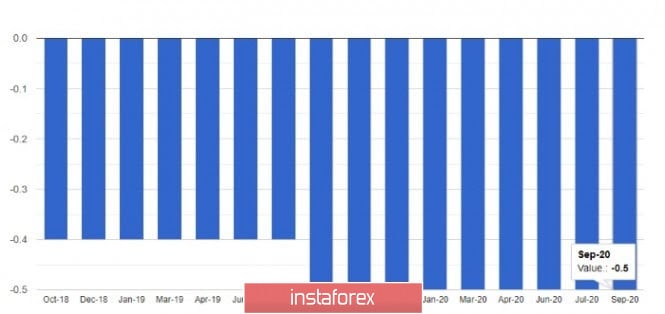
Technical details: Higher linear regression channel: direction - upward. Lower linear regression channel: direction - sideways. Moving average (20; smoothed) - sideways. CCI: 117.4017 On September 10, the European currency paired with the US dollar responded with rapid growth after the results of the ECB meeting became known. In the meantime, we would like to note that the pair's quotes continue to trade inside the side channel of 1.17-1.19. That is, the pair has been trading in a narrow price range for a month and a half with a slight upward bias. At the same time, the bears do not find any reason to put more pressure on the pair and update at least the previous local lows. We remind you that the price does not manage to overcome the previous lows. Thus, at this time, the pair may well make a breakthrough to the upper border of the side channel 1.19 or even higher, to the previous local maximum - 1.2011, however, this will not change the essence of what is happening. There is nothing special to talk about the ECB meeting. The European Central Bank left the key rate unchanged at 0.0%, and deposits at -0.5%. The PEPP (Pandemic Emergency Purchase program) also remained unchanged at 1.35 trillion euros. The ECB's final communique said that rates will remain at their ultra-low levels until inflation returns to the target level of 2% or slightly lower. Given the fact that the latest inflation report showed deflation of -0.2%, it will take a long time to wait for a rate increase in the European Union. However, these data did not upset market participants too much and a new wave of purchases of the euro currency began. The problem is that no really optimistic information was received from the ECB by traders. What did the Eurozone central bank and Christine Lagarde really say? The ECB slightly improved the GDP forecast for 2020 (to -8%) and left unchanged the inflation forecast for 2020 – 0.3%. The head of the ECB said that monetary policy will remain ultra-soft for a long time until the economy fully recovers. Christine Lagarde, like her colleagues from the Fed, also noted the high degree of influence of the "coronavirus" on the EU economy and noted that the worse things are with the epidemic, the more difficult it will be for the economy to recover. Thus, from our point of view, nothing optimistic was said during the press conference. Even the improvement in GDP forecasts does not look like anything special. In a month, if the situation with the "coronavirus" worsens, the same forecast may be lowered again. And the recent GDP report, which showed a real improvement by several tenths of a point, was ignored by the markets. It turns out that official reports are ignored by traders, and forecasts from the ECB are fulfilled? It doesn't happen that way. We believe that the reaction of traders in the form of purchases of the European currency is absolutely illogical. Today or tomorrow, we can expect a new round of downward movement. We also remind you that the pair continues to trade in the side channel and has worked out local highs from July 31 and August 6 today. Recently, the price does not like to overcome various highs and bounces off them with pleasure. Meanwhile, in the US, Donald Trump continues to amuse the public. Unfortunately, there is really nothing funny in his speeches, however, the way the US president quickly "changes records" really makes you smile. This time, Trump said that he knew about the severity of the disease from the very beginning, about the high mortality rate of COVID-2019. However, he did not want to create panic among people. This is the new version of Trump. However, no one knew about this virus at all until 2020, thus, how could Trump know about the high mortality rate and contagiousness of the virus? Moreover, what kind of panic are we talking about? No country in the world seems to have recorded any panic due to the "coronavirus". Thus, most likely, the US president decided to once again try to whiten himself before the election, which is why he made such a statement. In addition, Trump continues to repeat that the country is waiting for rapid economic growth if he wins the election. "If we win, we will have the greatest economy in the history of our country. You will see numbers that you have never seen," Trump said. What can we say about the results of September 10? The overall fundamental background for the euro/dollar pair has not changed at all. In the United States, the situation is still quite difficult, however, it is slightly improving, if we talk specifically about the "coronavirus"epidemic. Mass rallies and protests related to two racist scandals related to the American police have also subsided. Thus, there are still some improvements. However, as we can see, traders and investors are not in a hurry to buy the US dollar, as there are a lot of other factors that do not contribute to this. First, the economy, which continues to be knocked out. Second, there is uncertainty about the future. No one knows for sure who will win the election. Moreover, we venture to suggest that many fear a new victory for Donald Trump because the whole world has seen the results of his first term as president. Maybe Trump is not personally to blame for absolutely all of America's troubles in 2020, however, he is also to blame for this. Thus, we believe that until the presidential elections on November 3, it will be extremely difficult for the dollar to show growth in pair with the euro. The pound is a different matter. The pound has again fallen under the issue on "Brexit. But in the Eurozone, despite almost no improvement in the economy, everything looks more stable and less dangerous. Thus, in the next two months, most likely, it is the euro currency that will remain in the lead. Only technical factors speak against it now, since the pair did not correct normally after rising by more than 12 cents.
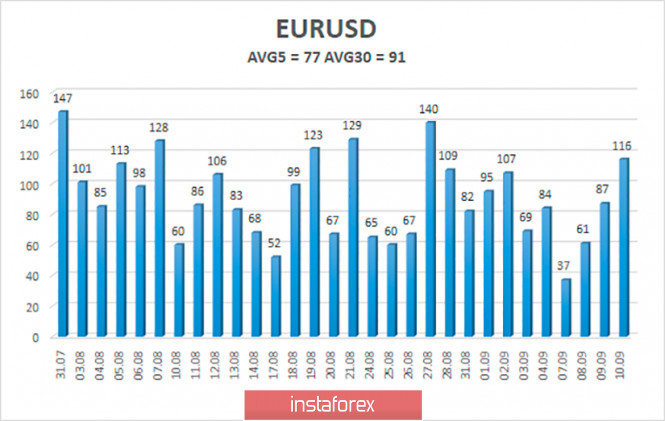
The volatility of the euro/dollar currency pair as of September 11 is 77 points and is characterized as "average". Thus, we expect the pair to move today between the levels of 1.1782 and 1.1936. A reversal of the Heiken Ashi indicator back downward signals a possible new round of downward movement in the remaining side channel. Nearest support levels: S1 – 1.1841 S2 – 1.1719 S3 – 1.1597 Nearest resistance levels: R1 – 1.1963 R2 – 1.2085 R3 – 1.2207 Trading recommendations: The EUR/USD pair has fixed above the moving average line and retains the chances of growth to 1.1936-1.1963. Thus, as long as the Heiken Ashi indicator is directed upwards, it is recommended to stay in long positions with these goals. It is recommended to consider again options for opening short positions if the pair is fixed below the moving average, with targets of 1.1782-1.1719. The material has been provided by InstaForex Company - www.instaforex.com |
| Posted: 10 Sep 2020 09:42 AM PDT EUR/USD hourly chart
On Thursday, September 10, EUR/USD broke below the descending channel right after our morning publication. We recommended buying the euro with the targets at 1.1877 and 1.1903. Both targets were tested during the day, so novice traders could have earned from 40 to 65 pips. Congratulations! At the moment, the price has tested the upper boundary of the flat channel and rebounded from it. Therefore, we expect the pair to resume the downtrend. The sideways channel of 1.17 - 1.19 is still in place, and the quotes have been stuck there for month and a half. Thus, we now expect a downward movement. Unfortunately, it is not possible to see the formation of new trend lines or channels at this time. Therefore, you will have to trade for some time, watching closely for buy and sell signals. The fundamental background was quite important today. However, the reaction of the market was unexpectedly opposite to the decisions taken by the ECB. In fact, the European Central Bank made no decisions at all. The rates remained unchanged, the QE and PEPP programs, which stimulate the economy, implying buybacks from the open market and flooding the economy with cash, also did not change. Moreover, there was not even a hint that something will change in the future. Even so, this would be a bearish factor for the pair. Besides, there was nothing optimistic about Christine Lagarde's speech. The ECB President said that monetary policy will remain "soft" for a long time, as inflation is now at a very low level, and it is still very far from a full economic recovery. The only positive thing was an improved outlook for GDP for 2020 which is seen at -8%. However, these estimates can be hardly called optimistic. Thus, according to the fundamental background, there were simply no reasons for buying the euro today. But such situations sometimes happen in the foreign exchange market. That is why we believe that later on Thursday and on Friday morning we will witness a downward movement simply because the euro was overrated. On Friday, Germany and the United States will publish Consumer Price Index for August. While the data from Germany is not so important for us, the data on the US inflation rate may affect the euro/dollar trajectory. A better-than-expected reading will push the US dollar higher. If the report turns out to be worse than forecasted, then the euro may advance on the last trading day of the week. Possible scenarios for September 11 1) Beginners are not recommended to open buy deals at this time, as the price hit the upper boundary of the channel at 1.1903, but failed to break above it. Therefore, further uptrend is very unlikely. Also, there is currently no pattern supporting the bullish trend. 2) Sell positions look more relevant at the moment, despite the fact that the pair went considerably higher during the day. However, the rebound from the level of 1.1903 signals a new round of the downward movement to the lower boundary of the 1.17-1.19 flat channel. We would recommend placing short positions amid the fall in price. Yet, you should have entered the market a little earlier at the time of the rebound from 1.1903. Therefore, it might be better to wait until the morning and make a new assessment of the current market situation. On the chart: Support and Resistance Levels are the Levels that serve as targets when buying or selling the pair. You can place Take Profit near these levels. Red lines are the channels or trend lines that display the current trend and show in which direction it is better to trade now. Up/down arrows show where you should sell or buy after reaching or breaking through particular levels. The MACD indicator consists of a histogram and a signal line. When they cross, this is a signal to enter the market. It is recommended to use this indicator in combination with trend lines (channels and trend lines). Important announcements and economic reports that you can always find in the economic calendar can seriously influence the trajectory of a currency pair. Therefore, at the time of their release, we recommend trading as carefully as possible or exit the market in order to avoid sharp price fluctuations. Beginners on Forex should remember that not every single trade has to be profitable. The development of a clear strategy and money management are the key to success in trading over a long period of time. The material has been provided by InstaForex Company - www.instaforex.com |
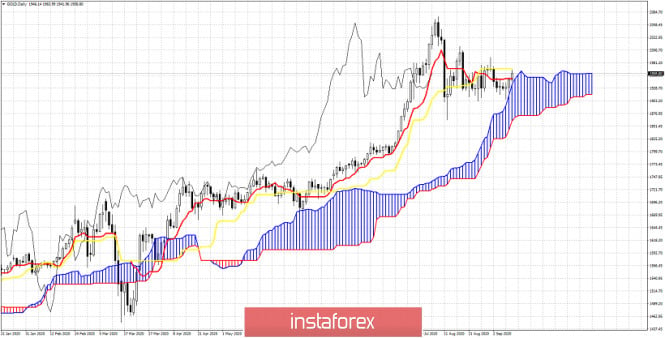
| Ichimoku cloud indicator Daily analysis of Gold for September 10, 2020 Posted: 10 Sep 2020 09:25 AM PDT Gold price continues to bounce off the key cloud support at $1,900. Price has now reached $1,960 and is challenging key resistance. Gold price has moved above the tenkan-sen indicator and is challenging the kijun-sen.
|
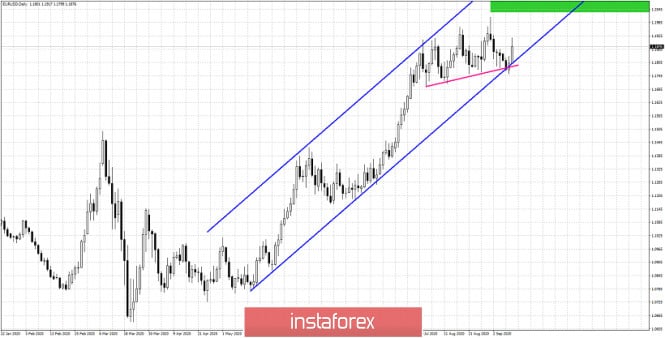
| EURUSD bounces off channel support Posted: 10 Sep 2020 09:18 AM PDT EURUSD has held above 1.1750 support. Price is still inside the bullish channel. Price is bouncing off the key support we mentioned in previous analysis and our bullish trade plan is so far working nicely.
Pink line - support trend line Green rectangle- target as long as price is inside channel EURUSD is bouncing strongly towards 1.19. Today's low at 1.1799 is important as bulls do not want to see price break below it. Trend remains bullish and so do we as price is still inside the channel. Our stop is raised from 1.1750 to 1.1790. Resistance is at 1.1920 and bulls want to see price recapture that level. This will give boost towards 1.20 and higher. The material has been provided by InstaForex Company - www.instaforex.com |
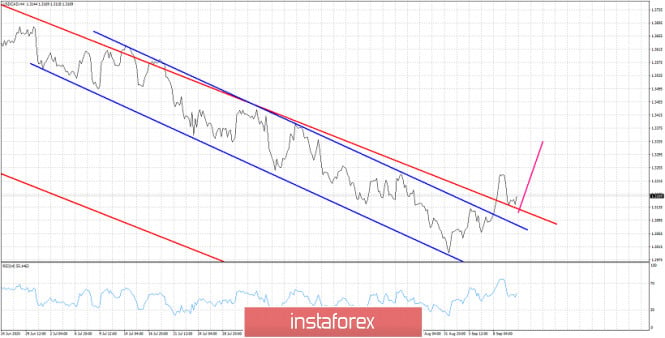
| USDCAD back tests break out area Posted: 10 Sep 2020 09:09 AM PDT USDCAD as expected is back testing the break out area at 1.3150. Price is expected to bounce from current levels towards 1.3350-1.34. Bulls need to hold above the broken bearish channels in order for this upward move to continue higher.
Blue lines - bearish short-term channel Red lines - bearish medium-term channel Pink line - expected move USDCAD is most probably forming another higher low in the new sequence that started at 1.30. Price has broken above the bearish channels and this is big news for bulls. Continuing the move of higher highs and higher lows is important for our target of 1.3350-1.34. Support is at 1.3130. Our trading plan remains the same. We are bullish as long as price is above 1.31. The material has been provided by InstaForex Company - www.instaforex.com |
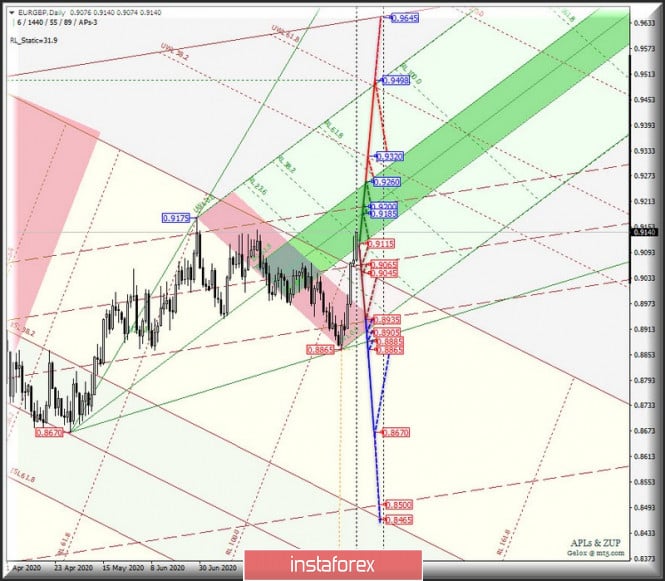
| Posted: 10 Sep 2020 08:57 AM PDT Minor operational scale (Daily) How will the main currency pairs interact with each other? Options for the development of the movement of EUR/JPY & GBP/JPY (H4) on September 11, 2020. ____________________ Euro vs Great Britain pound The movement of the "main" cross-instrument EUR/GBP from September 11, 2020 will occur depending on the development and direction of the breakdown of the boundaries of the equilibrium zone (0.9115 - 0.9185 - 0.9260) of the Minute operational scale fork - details of working out the specified levels of the equilibrium zone are shown on the animated chart. A breakdown of the resistance level of 0.9260 at the upper border of the ISL61.8 balance zone of the Minute operational scale forks will make it relevant to continue the development of the EUR/GBP movement to the warning line UWL61.8 (0.9320) of the Minor operational scale forks and it will be possible to update the local maximum of 0.9498 if it breaks through. If the lower boundary of ISL38.2 is broken through the equilibrium zone of the Minute operational scale fork - support level of 0.9115 - a downward movement of the "main" cross-instrument may develop towards the targets:
Details of the EUR/GBP movement since September 11, 2020 are shown on the animated chart.
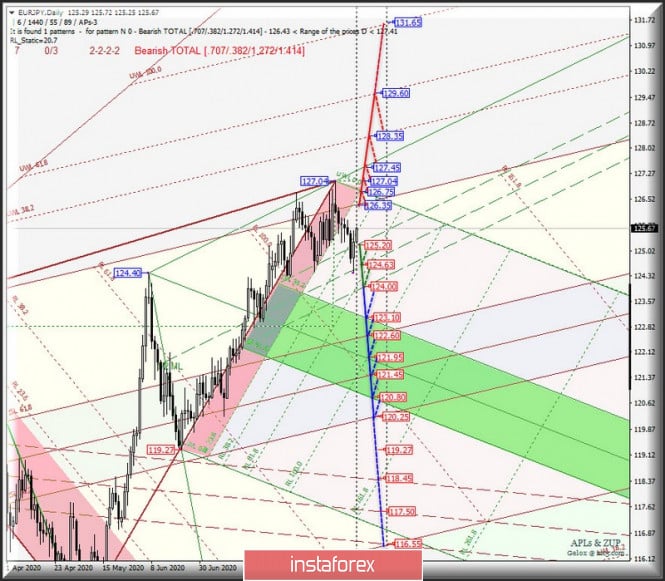
___________________ Euro vs Japanese yen The development of the movement of the EUR/JPY cross-instrument from September 11, 2020 will proceed taking into account the development and direction of the breakdown of a fairly wide range:
In case of breakdown of the resistance level 126.35 on the final FSL line of the Minor operational scale fork, the movement of EUR/JPY will be directed to the levels:
The breakdown of the support level of 125.20 will determine the development of the movement of this cross-instrument in the 1/2 Median Line channel (125.20 - 124.63 - 124.00) of the Minute operational scale fork, and in case of a breakdown of the lower boundary (124.00) of this channel, the downward movement can be continued to the boundaries of the equilibrium zones of the operational scales - Minute (123.10 - 121.95 - 120.80) and Minor (122.60 - 121.45 - 120.25). We look at the EUR/JPY movement options from September 11, 2020 on an animated chart.
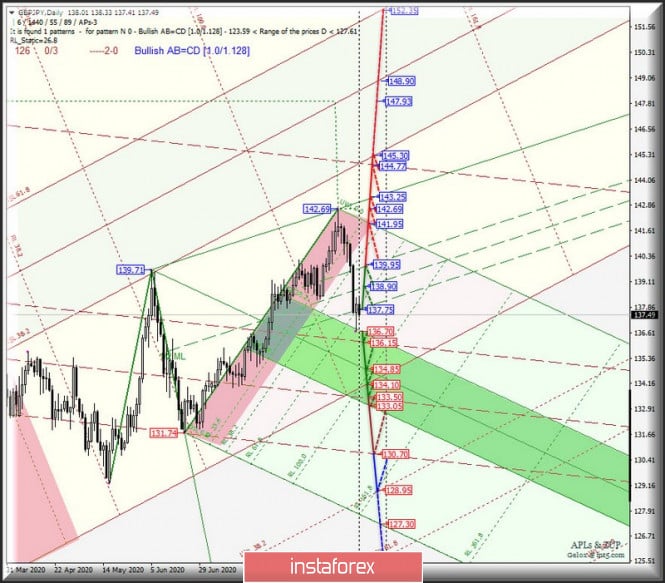
____________________ Great Britain pound vs Japanese yen From September 11, 2020, the movement of the GBP/JPY cross-instrument will also develop depending on the development and direction of the range breakdown:
In case of a breakdown of the resistance level of 137.75, the movement of GBP/JPY will continue in the 1/2 Median Line channel (137.75 - 138.90 - 139.95) of the Minute operational scale fork, the breakdown of the upper border (139.95) of this channel will make the continuation of the upward movement of this cross-instrument to the targets:
The breakdown of ISL38.2 Minute - support level of 136.70 - followed by breakdown of level 136.15 - a variant of the development of the GBP/JPY movement within the equilibrium zone (136.70 - 134.85 - 133.05) of the Minute operational scale fork and the 1/2 Median Line channel (136.15 - 133.50 - 130.70 ) of the Minor operational scale fork with the prospect of reaching the warning line LWL38.2 Minor (128.95). For details of the development of the GBP/JPY movement from September 11, 2020, see the animated chart.
____________________ The review is compiled without taking into account the news background, the opening of trading sessions of the main financial centers and is not a guide to action (placing "sell" or "buy" orders). The material has been provided by InstaForex Company - www.instaforex.com |
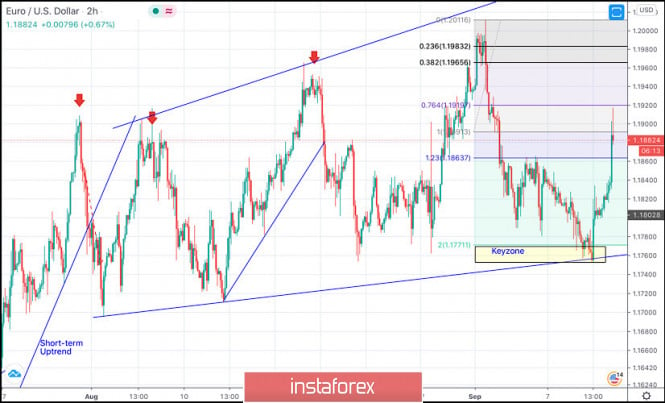
| September 10, 2020 : EUR/USD daily technical review and trade recommendations. Posted: 10 Sep 2020 08:37 AM PDT
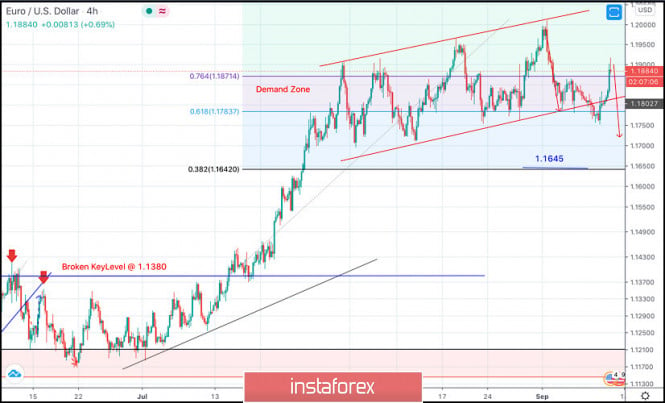
The EUR/USD pair has been moving sideways within the depicted expanding channel since August 3. Previously, a temporary resistance level was formed around 1.1900 which prevented further upside movement for and forced the pair to have a downside pause for sometime. On August 31, the EURUSD pair achieved another breakout above the previously mentioned resistance zone. Significant SELLING pressure was applied around 1.2000 where the upper limit of the movement pattern came to meet the pair. Recently, the EUR/USD pair has demonstrated a quick bearish decline towards 1.1800. More downside movement was expected towards the lower limit of the movement pattern around 1.1770-1.1750 where a valid BUYING opportunity was suggested. As expected, a valid BUYING position was offered. Significant movement to the upside was demonstrated. Initial target would be located around 1.1900 where price action should be watched. A breakout above 1.1920 (76.4% Fibonacci Level) will probably enable further upside movement towards the price zone of 1.1960-1.1980. The material has been provided by InstaForex Company - www.instaforex.com |
| September 10, 2020 : EUR/USD Intraday technical analysis and trade recommendations. Posted: 10 Sep 2020 08:08 AM PDT
Instead, bullish breakout above 1.1380-1.1400 has lead to a quick bullish spike directly towards 1.1700 which failed to offer sufficient bearish pressure. Bullish persistence above 1.1700-1.1760 favored further bullish advancement towards 1.1975 where some considerable bearish rejection has been demonstrated. The price zone around 1.1975-1.2000 ( upper limit of the technical channel ) remains a strong SUPPLY-Zone to be watched for bearish reversal. However, Conservative traders should be waiting for bearish closure below 1.1700 - 1.1750. As this indicates lack of bullish momentum and enhances further bearish decline initially towards 1.1645 and 1.1600. Trade recommendations : Conservative traders should wait for the current bullish movement to get back below 1.1750 as an indicator for lack of bearish momentum for a valid SELL Entry.T/P levels to be located around 1.1645, 1.1600 and 1.1500 while S/L to be placed above 1.1860 to minimize the associated risk. The material has been provided by InstaForex Company - www.instaforex.com |
| September 10, 2020 : GBP/USD Intraday technical analysis and trade recommendations. Posted: 10 Sep 2020 08:03 AM PDT
Intermediate-term technical outlook for the GBP/USD pair has remained bullish since bullish persistence was maintained above 1.2780 (Depicted KeyLevel) on the H4 Charts. On the other hand, the GBPUSD pair looked overbought after such a quick bullish movement while approaching the price level of 1.3475. That's why, short-term bearish reversal was expected especially after bearish persistence was achieved below the key-level level of 1.3300. A quick bearish decline towards 1.2900 where significant bullish recovery was recently expressed. The price zone of 1.3130-1.3150 (the backside of the broken trend) remains an Intraday Key-Zone to offer bearish pressure if retested again soon. However, the GBPUSD pair is showing lack of sufficient bullish momentum to pursue above the price level of 1.3000. That's why, bearish persistence below 1.3000 will probably enable further bearish decline initially towards 1.2800 where price action should be watched again Trade recommendations : Conservative traders are advised to wait for bullish pullback towards 1.3130-1.3150 (the backside of the broken trend) as a valid SELL Entry. Initial T/p level is to be located around 1.3050 and 1.2900 if sufficient bearish pressure is maintained. On the other hand, bullish persistence above 1.3200 invalidates this trading scenario. The material has been provided by InstaForex Company - www.instaforex.com |
| Stock indices of US and Asia rise whereas in Europe, pressure becomes stronger Posted: 10 Sep 2020 07:02 AM PDT On the stock markets of the United States, trading on Wednesday ended in a positive mood. The main stock market indicators rose against the background of an increase of securities of companies in the technology sector. At the same time, technology companies registered almost the highest daily jump in the last four months. This allowed them to neutralize almost all previous losses. Notably, yesterday, the indices showed a slump. The Nasdaq Composite, for example, sank by 4% during the tech sector's stock sell-off. Its total losses for three days were around 10%, despite the fact that earlier it stood on its maximum record levels. The S&P500 has generally become the leader of losses in recent days: its reading sank to the lowest levels recorded in June. According to most analysts, the sharp collapse in technology stocks was triggered by the fact that investors began to fear that the previous rapid growth would lead to an extremely unstable position, which can collapse at any moment. No one waited for the slump, which led to a sharp sell-off. However, yesterday the tech sector began to recoup its losses: it advanced by 3.4%, which was the biggest increase for the day. There was a jump that experts warned about. At the same time, their forecasts for further upward movement are quite restrained. There are big doubts that growth will continue as it is expected to be very limited by several factors. However, the climb in the main stock indices has already slowed down on the background of news that China's company ByteDance and the authorities of the United States have begun negotiations on ways to sell the TikTok platform to the American side. The Dow Jones Industrial Average was 1.6% higher, or 439.58 points, at the close of the trading session, which allowed it to rise to 27,940.47 points. The Standard & Poor's 500 index gained 2.01%, or 67.12 points. Its value at the close of trading was 3,398.96 points. The Nasdaq Composite index was the leader of the rise: its gain was 2.71%, or 293.87 points. It stopped at 11,141. 56 points. The stock markets of the Asia-Pacific region also noted an increase in the main indices. The positive news from America also encouraged Asian investors. Analysts believe that the recovery in markets is a good sign that hints that investors continue to believe in the sustainability and prospects for economic growth in the region. Market participants are even more hopeful about the possible rapid release of a vaccine against the coronavirus infection. Even some of the problems noted during the clinical trials of the new drug could not put too much pressure. However, there are some worrying points. First of all, it is today's meeting of the ECB, the main regulator of the European region. Investors expect that the European Central Bank will not ratify the next batch of stimulus measures, but it may begin to create conditions for the introduction of a more lenient monetary policy, which it intends to switch to by the end of this year. Moreover, there is a high probability that the euro may lose in value. At the moment, it is trading at its two-year high of $1.2. Japan's Nikkei 225 index was up 0.8% this morning. China's Shanghai Composite index gained 0.4%. Hong Kong's Hang Seng index followed the positive trend and rose by 0.2%. South Korea's Kospi index jumped by1.1%. Australia's S&P/ASX 200 index inched up by 0.3%. European stock markets are in the negative territory this morning. The reduction was logged in almost all areas. The reason for this is the expectation of the results of the ECB meeting, which is quite nervous for market participants. Of course, the regulator's rejection of new stimulus measures may create some problems in the region, but further easing of monetary policy will help strengthen the economy. Meanwhile, the single currency may be extremely sensitive to any decisions of the regulator, which will force it to fall. Another serious problem is the unresolved issue of the Brexit agreement between the UK and the EU. The general index of large enterprises in the European region Stoxx Europe 600 fell by 0.31% in the morning and was at the level of 368.5 points. The index of the UK FTSE 100 slipped by 0.61%. The German DAX index registered a slight drop of 0.05%. France's CAC 40 index went down by 0.41%. Italy's FTSE MIB lost 0.16%. Spain's IBEX 35 index inched down by 0.44%. The material has been provided by InstaForex Company - www.instaforex.com |
| EURUSD: Euro spiked upon ECB meeting results, prospects rebound to the 20th figure Posted: 10 Sep 2020 06:54 AM PDT The main focus on Thursday was the monetary policy of the European Central Bank, or rather, its prospects for changes in the future. And although at the end of the meeting the rates remained unchanged, the expected pressure on the euro did not happen, as traders did not wait for hints that the bond purchase program would undergo changes at the end of this year. The European Central Bank decided to leave the refinancing rate at zero, and the rate on deposits at -0.5%. The ECB reiterated its intention to keep monetary policy unchanged until inflation approaches the target level. The regulator also kept the volume of the PEPP program unchanged, at 1.35 trillion euros, and also kept the APP asset purchase program in the amount of 20 billion euros per month. Additional acquisitions of assets under the temporary program in the amount of 120 billion euros will also remain until the end of the year. As for the duration of the main program PEPP, they have not been revised. This suggests that purchases will continue until at least June 2021. The speech of the President of the European Central Bank, as well as the forecasts of economists, became noteworthy which led to such a sharp rise of the euro during the press conference. The ECB President Christine Lagarde stressed that recent data showed strong growth, in line with expectations, but the strength of the economic recovery is shrouded in significant uncertainty, so monetary policy should remain soft for quite some time. Lagarde attributed the recent increase in the number of coronavirus infections among the main risks for the EU, which will continue to impede its economic recovery. For example, on Wednesday, it became known that the UK has introduced new restrictions on public events, following many European countries in this direction. This was done amid a sharp increase in the number of new cases of Covid-19 infection. Economists from the European Central Bank initially estimated a slightly less significant economic contraction in 2020 than before. As a result of the recent reports, the eurozone economy is projected to contract by 8.0% in 2020 against the June forecast of a contraction of 8.7%. In 2021, the economy is expected to grow by about 5.0%. Although Lagarde focused on the euro on her speech, she said that she would continue to carefully evaluate the incoming information, including news about the exchange rate. According to her, inflation will remain in negative territory only in the coming months, and the high euro exchange rate may further put pressure on the indicator. Meanwhile, economists of the European Central Bank estimated that inflation in 2020 will be 0.3%. And expects it to grow to 1% by 2021 and to 1.3% in 2022. At the end of her speech, Lagarde noted that fiscal measures should be targeted and temporary, and drew attention to the recent changes in inflation targeting by the Fed, adding that so far there is no need for similar measures by the ECB since the ECB's economic forecasts do not include deflation risk. Summing up, it must be said that although the European regulator did not make changes in monetary policy and did not prepare the markets for the likelihood of such changes in the future, we did not hear any hysteria in the words of the ECB President that the euro exchange rate would seriously affect inflation and the prospects for economic recovery in the region. Against this background, all those who wanted to buy the euro at more attractive prices, after a downward correction, began to return to the market, since in the near future, you can forget about verbal interventions. As for the technical picture of the EURUSD pair, a breakdown and consolidation of the resistance level of 1.1865 will be a burden on the sellers of the euro, leaving the market under the control of buyers. Only after that, one can expect a powerful wave of growth in risky assets to the area of the maximum of the 19th figure, as well as a rebound to the 20th figure, a breakdown of which will become the cherry on the cake in early autumn 2020. The material has been provided by InstaForex Company - www.instaforex.com |
| Posted: 10 Sep 2020 06:44 AM PDT Further Development
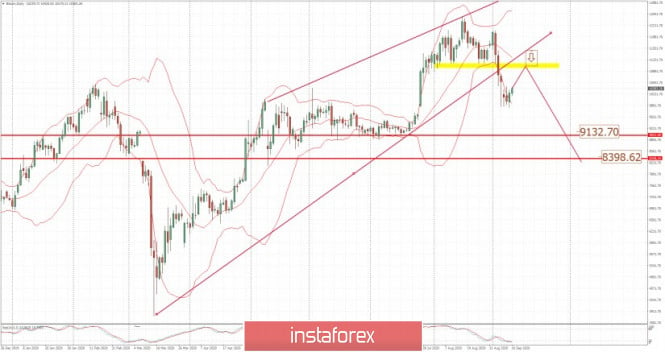
Analyzing the current trading chart of BTC, I found that there is the breakout of the rising trendline on the Daily time-frame and potentia lfor the more downside. My advice is to watch for selling opportunities on the rallies with the targets at $9,140 and $8,400 Good area of resistance is set at the price of $11,000 BTC is still trading in the defined balanced regime, so watching for the stronger breakout is preferable under current condiiton. The material has been provided by InstaForex Company - www.instaforex.com |
| Euro rises while European stock market collapses ahead of ECB meeting Posted: 10 Sep 2020 06:37 AM PDT
The euro continues to rise, but the course can change dramatically. ECB President Christine Lagarde may change the euro's trajectory after the ECB meeting because the euro growth affects the outlook for inflation and economic growth. The European currency was trading at $1.1821. It rose by 0.3% from the previous session. The pound sterling was slightly up to $1.2993. However, the pound may lose its position, as the UK and the EU still have not reached a trade agreement. At the same time, GBP/EUR fell to 90.98, reaching a six-week low. The US dollar is stable against the safe Swiss franc and trades at 0.9116. USD/JPY is trading at 106.11 yen. The euro is rising amid news that ECB leaders are increasingly confident in the bloc's economic prospects. However, not everyone cheers the fact that the EUR/USD rate went up by 6% from the June low. The global stocks are also the main issue for traders, as the rebound in US tech stocks after a sharp sell-off pushed Asian stocks higher, signaling an improved risk appetite. The ICE US dollar index, which measures the US dollar against a basket of six major currencies, remained stable at 93.172. The Australian dollar lost value amid worsening diplomatic relations with China. Moreover, investors are worried about a new coronavirus outbreak which was registered in the state of Victoria. The New Zealand dollar fell slightly to $0.6681. The meeting of the European Central Bank on monetary policy may affect the European stock indices as well. Unlike the euro, they decreased in value. Germany's DAX fell by 0.1%, France's CAC 40 lost 0.3%, while the UK's FTSE dropped by 0.6%. At the ECB meeting, leaders will make new economic forecasts. But the main question remains whether the bank will be able to depreciate the euro, given how important exports are for the region. Saga suffered heavy losses from its cruise and other tourism operations. To recover, the company announced a £150 million capital increase. As a result, Saga's shares fell by 5.5%. Also, WM Morrison Supermarkets reported losses from the coronavirus pandemic as well. However, despite the growth in sales in the first half of the fiscal year, its shares crashed by 4.5%. Nevertheless, the NASDAQ index showed growth. During the day, it added 2.7%. This is the fastest increase in more than four months. The Dow Jones index rose by 1.6%, and the S&P 500 increased by 2%. At the same time, oil prices are falling, as the growth of US oil inventories has exceeded all expectations. Moreover, oil demand remains low. Futures for WTI crude fell by 1.4% to settle at $37.53 per barrel, while the Brent crude decreased by 1.1% to trade at $40.34. Gold also fell in price by 0.1% to $1,952.35 per ounce. The material has been provided by InstaForex Company - www.instaforex.com |
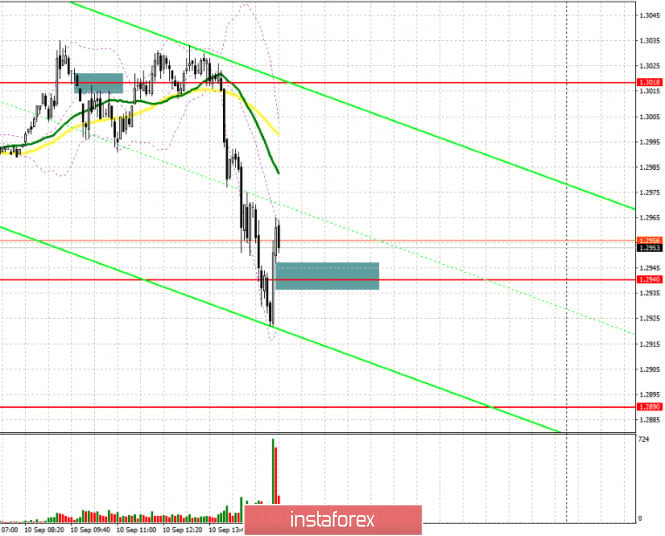
| GBP/USD: plan for the American session on September 10 Posted: 10 Sep 2020 06:14 AM PDT To open long positions on GBPUSD, you need: In my morning forecast, I recommend opening short positions after the formation of a false breakout at the level of 1.3018, which is what happened. On the 5-minute chart, the bears quickly returned the pair to the level of 1.3018, which led to a major sell-off of the pound to the support area of 1.2940. Now the bulls need to protect this range and return to it. Another top-down test of this level after forming a false breakout forms a good entry point into long positions in the expectation of a repeated return of the pair to the highs of the day in the area of 1.3018, where I recommend fixing the profits. Holding the level of 1.2940 will also allow you to form the lower border of a new upward correction channel. An equally important task will be to break through and consolidate above the resistance of 1.3018, which will form another entry point for long positions in the expectation of updating the maximum of 1.3103. If the bulls are inactive during the repeated test of the support of 1.2940, it is best to abandon long positions until the minimum of 1.2890 is updated or buy GBP/USD even lower – immediately on the rebound from the new support of 1.2840 in the expectation of correction of 30-40 points within the day.
To open short positions on GBPUSD, you need: The bears have coped with their tasks and the goal in the afternoon is to break through and consolidate below the support of 1.2940. This will destroy buyers' plans to restore the pound and lead to a decline in GBP/USD to the area of the weekly low of 1.2890, which will not be so difficult to break. If not from the second, then from the third time, the area of 1.2890 will still be passed, which forms an additional entry point for short positions. This will allow you to count on updating the next lows in the area of 1.2840 and 1.2725, where I recommend fixing the profits. In the scenario of the pair's growth in the afternoon, the next formation of a false breakout at the level of 1.3018 will be a signal to open short positions. You can sell GBP/USD immediately for a rebound from the maximum of 1.3103, based on a correction of 30-40 points within the day.
Signals of indicators: Moving averages Trading is conducted in the area of 30 and 50 daily averages, which indicates an active confrontation between buyers and sellers. Note: The period and prices of moving averages are considered by the author on the hourly chart H1 and differ from the general definition of classic daily moving averages on the daily chart D1. Bollinger Bands A break of the lower limit of the indicator in the area of 1.2940 should lead to a larger sell-off of the pound. Description of indicators
|
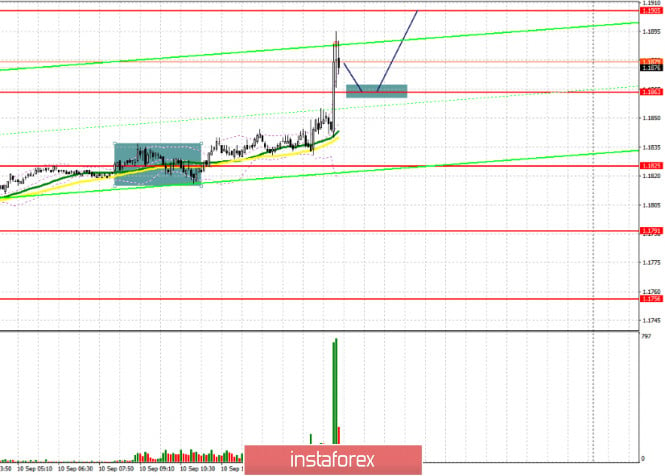
| EUR/USD: plan for the American session on September 10 Posted: 10 Sep 2020 06:05 AM PDT To open long positions on EURUSD, you need: The complete absence of changes in the monetary policy of the European Central Bank, which was feared by euro buyers, led to the formation of a new bull market and now only one thing is required – to consolidate above the maximum of 1.1863. A test of this level from top to bottom forms a good entry point for the continued growth of the European currency. This is marked on the 5-minute chart. The nearest target for buyers of the euro is the resistance of 1.1905, the breakout of which will provide a direct road to the area of the maximum of 1.1949, where I recommend fixing the profits. In the scenario of the pair's decline, and the absence of active purchases in the support area of 1.1863, you can safely open long positions for a rebound from the area of 1.1825, where the moving averages are gradually being pulled up. However, I would not expect a movement of more than 20-30 points from this level.
To open short positions on EURUSD, you need: After today's meeting of the European Central Bank, sellers will think 10 more times about whether it makes sense to return to short positions at current levels. Most likely, the first attempts to probe the market will be in the resistance area of 1.1905, where the first test of this area may lead to a downward correction of EUR/USD by 15-20 points. If there is no active downward movement from this area, it is best to postpone short positions until the high of 1.1949 is updated and sell the euro from there in the expectation of correction of 30-40 points within the day. An equally important task for the bears will be to close the day below the level of 1.1863, which they missed during the press conference of the President of the European Central Bank, Christine Lagarde. Fixing below 1.1863 may lead to an instant sell-off of the euro to the support area of 1.1825, where I recommend fixing the profits.
Signals of indicators: Moving averages Trading is above the 30 and 50 daily moving averages, which indicates the resumption of the bull market for the euro. Note: The period and prices of moving averages are considered by the author on the hourly chart H1 and differ from the general definition of classic daily moving averages on the daily chart D1. Bollinger Bands If the pair declines in the afternoon, the average border of the indicator will act as support in the area of 1.1825, from where you can buy euros immediately for a rebound. Description of indicators
|
| Posted: 10 Sep 2020 05:56 AM PDT
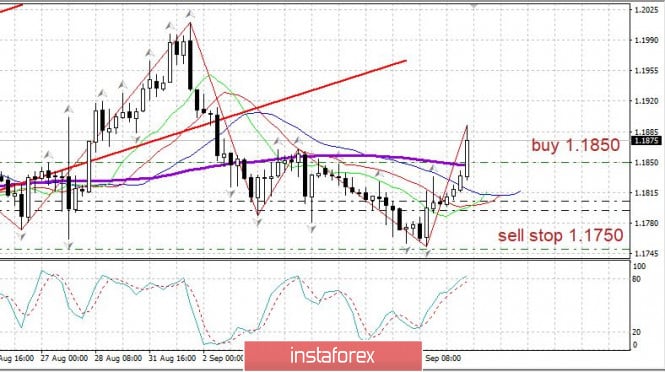
The ECB decided to keep all its stimulus measures on its meeting held on Thursday, September 10, 2020. Meanwhile, a weak recovery in some parts of Europe is observed and signs of a potential second wave of the pandemic particularly arise in both Spain and France. After the ECB meeting, the euro began to rally and is now in a critical situation. Thus, the question arises whether the euro will manage to break the level of 1.1900 and gain a foothold above. You may consider buying from 1.1850 with a stop at 1.1805. It is also possible to move the stop to 1.1825. In case of a complete downward reversal, you may consider selling from 1.1750. The material has been provided by InstaForex Company - www.instaforex.com |
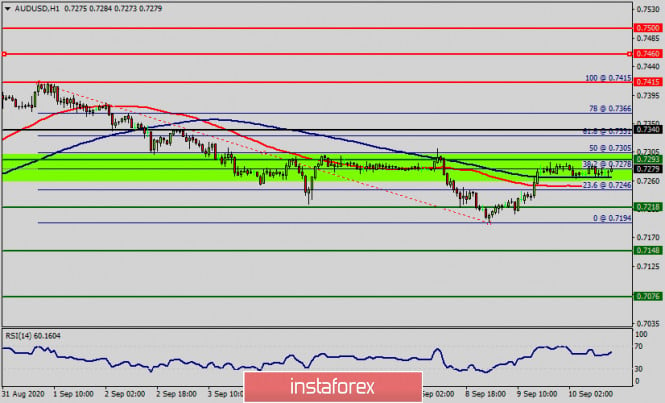
| Technical analysis of AUD/USD for September 10, 2020 Posted: 10 Sep 2020 05:30 AM PDT The currently price is set at 0.7219. The daily pivot point had already placed at the point of 0.7340. The AUD/USD pair will continue to rise from the level of 0.7340 in the long term. It should be noted that the support is established at the level of 0.7340 which represents the 61.8% Fibonacci retracement level on the H1 chart. The price is likely to form a double bottom in the same time frame. Accordingly, the AUD/USD pair is showing signs of strength following a breakout of the highest level of 0.7340. So, buy above the level of 0.7340 with the first target at 0.7415 in order to test the daily resistance 1 and further to 0.7460. Also, it might be noted that the level of 0.7460 is a good place to take profit because it will form a new double top. This suggests the pair will probably go up in coming hours. Additionally, the price is in a bullish channel now. Amid the previous events, the pair is still in an uptrend. From this point, the AUD/USD pair is continuing in a bullish trend from the new resistance of 0.7415. However, in case a reversal takes place and the AUD/USD pair breaks through the support level of 0.7340/0.7293, a further decline to 0.7218 can occur which would indicate a bearish market. The material has been provided by InstaForex Company - www.instaforex.com |
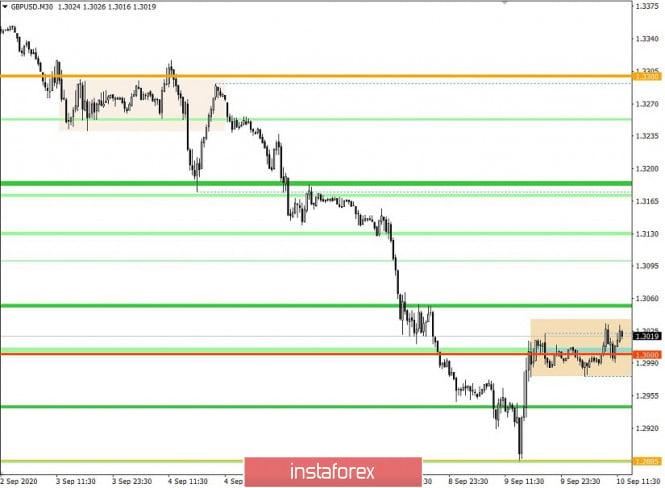
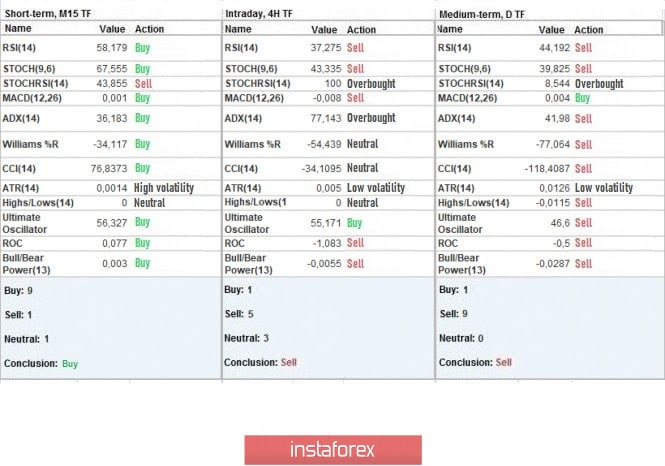
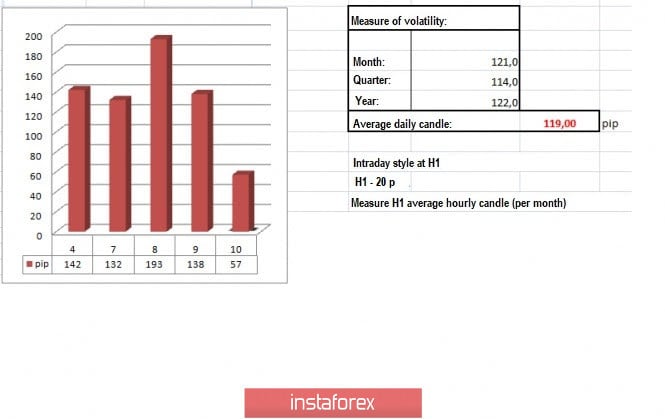
| Trading recommendations for GBP/USD on September 10 Posted: 10 Sep 2020 05:01 AM PDT The sharp surge of short positions brought GBP / USD down to 1.2885, but then the quote stopped and turned back towards 1.3000. Nevertheless, market sentiment is still bearish, so we should continue trading short positions, especially if there is an opportunity to sell. For example, in the M15 chart, we can see that short positions arose and pushed the quote to 1.2885. However, a reversal occurred immediately after, which returned GBP / USD back to 1.3000. Such indicates that speculation is currently high in the market, and it is responsible for the large movements in GBP / USD. In addition, having high volatility also supported this idea, as yesterday, the average indicator is at 137 points. JOLTS data for July also supported this initial decline in the pair, as the number of open vacancies in the US labor market came out better than the forecasts. The previous indicators were revised from 5,889 to 6,001, and the current data was several times ahead of the forecast: 6,000 ----> 6,618. Issues regarding Brexit also contributed to high speculation, as yesterday, a bill was released that was aimed to ensure integrity of the UK home market after Brexit, as well as addresses the extremely difficult border issue between Northern Ireland and the Republic of Ireland. The government agrees that this bill would violate international law and undermine confidence in the country, which could lead to even greater problems and, as a result, the absence of any trade agreement with the EU, except for the WTO with general rules. Thus, finding a consensus with regards to a deal seems to be getting farther and farther each day. If the two sides ultimately fail to get an agreement, Brexit will be tough, which will directly affect demand for the pound in the market. In the meantime, weekly report on claims for unemployment benefits in the US will be published today, the forecast for which is another decline in volume. Initial applications may drop from 881,000 to 846,000, while repeated applications may decrease from 13,254,000 to 12,925,000. The upcoming ECB meeting may also affect GBP / USD rates in the market. Further development As we can see on the trading chart, GBP / USD traded within 1.2990 / 1.3035, but around it activity has lessened, and this can provoke another round of speculation in the market. The best trading approach is to break the quote out of the current price range, which could be done if we trade local operations. Thus, consider the following trading recommendations: - Set short positions from 1.2990 to 1.2950 - 1.2885. - Set long positions from 1.3040 to 1.3065 - 1.3100. Indicator analysis Looking at the different time frames (TF), we can see that the indicators on hourly and daily periods signal sell due to the overall bearish sentiment. Meanwhile, the minute period has a variety of signals since the quote still has not broken out of the price range. Weekly volatility / Volatility measurement: Month; Quarter; Year Volatility is measured relative to the average daily fluctuations, which are calculated every Month / Quarter / Year. (The dynamics for today is calculated, all while taking into account the time this article is published) Volatility is at 57 points, which is 52% below the average value. It will only accelerate if the quote breaks out of the current price range. Key levels Resistance zones: 1.3200; 1.3300 **; 1.3600; 1.3850; 1.4000 ***; 1.4350 **. Support Zones: 1.3000 ***; 1.2885 *; 1.2770 **; 1.2620; 1.2500; 1.2350 **; 1.2250; 1.2150 **; 1.2000 *** (1.1957); 1.1850; 1.1660; 1.1450 (1.1411). * Periodic level ** Range level *** Psychological level Also check trading recommendations for the EUR/USD pair here, or brief trading recommendations for the EUR/USD and GBP/USD pairs here. The material has been provided by InstaForex Company - www.instaforex.com |
 The EURUSD pair has failed to maintain enough bearish momentum below 1.1150 (consolidation range lower zone) to enhance further bearish decline.
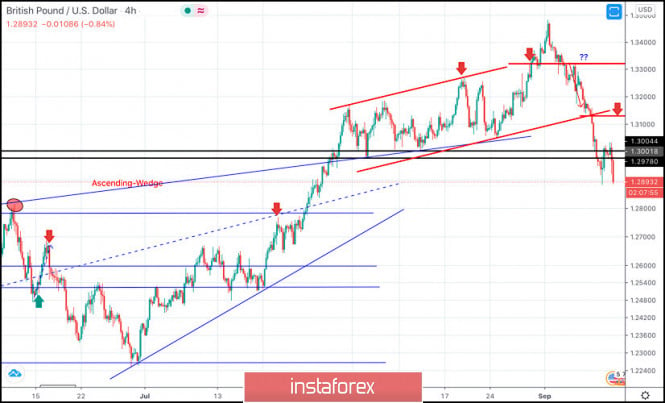


| You are subscribed to email updates from Forex analysis review. To stop receiving these emails, you may unsubscribe now. | Email delivery powered by Google |
| Google, 1600 Amphitheatre Parkway, Mountain View, CA 94043, United States | |
No comments:
Post a Comment