
Forex analysis review |
- Forecast for USD/JPY on September 14, 2020
- Likelihood of GBPUSD growth increases this week
- EURUSD longs in the second half of September
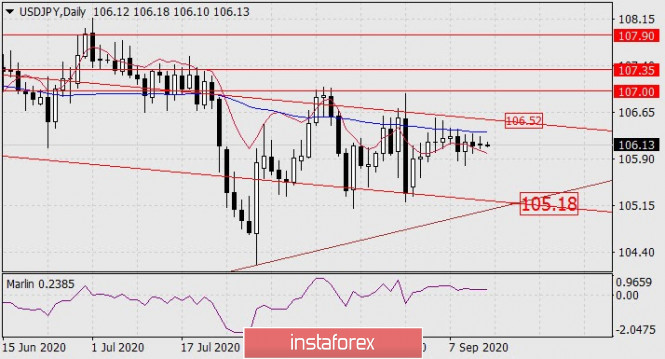
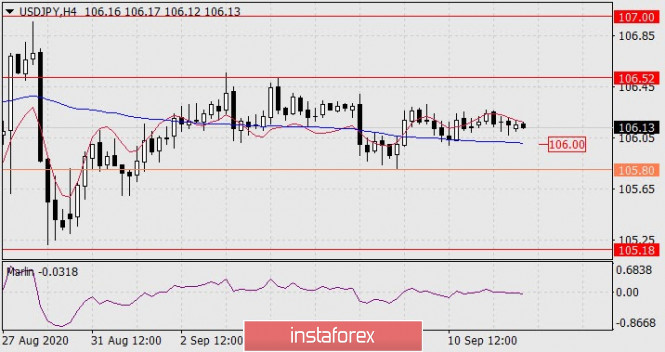
| Forecast for USD/JPY on September 14, 2020 Posted: 13 Sep 2020 08:04 PM PDT USD/JPY The situation on the US stock market is beginning to improve. Friday's close was already mixed: Nasdaq -0.60%, S&P 500 0.05%, Dow Jones 0.48%. This situation makes it possible for the yen's rate to stay in a narrow consolidation for the third day. The price is located between the balance and MACD indicator lines on the daily chart, while the Marlin oscillator is in the growth area. We are waiting for the price to go over the MACD line and reach the first bullish target of 106.52 - a test of the embedded line of the price channel of the monthly timeframe. The price is above the MACD line on the four-hour chart, and it is settling above this line, which is a positive sign for growth. But the price is below the balance indicator lines (red) while the Marlin oscillator is moving to the right, still in the negative trend zone, this makes it possible to break through the support of the MACD line (106.00), and if the price falls below the September 9 low (105.80), then the price could go to the area where two trend lines intersect (105.18). Waiting for developments. The material has been provided by InstaForex Company - www.instaforex.com |
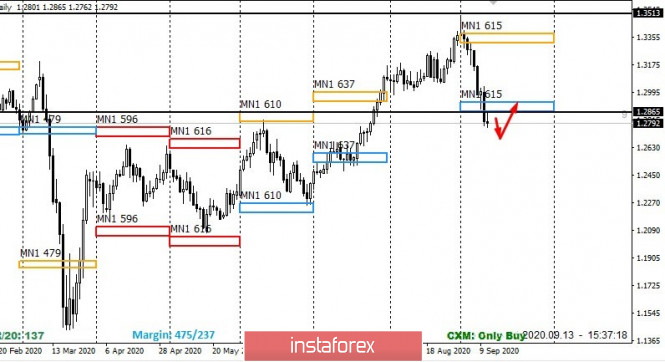
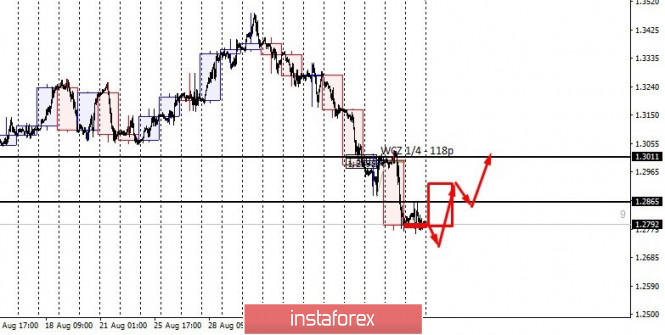
| Likelihood of GBPUSD growth increases this week Posted: 13 Sep 2020 02:14 PM PDT The pair's sharp fall in the first half of September made it possible for a downward reversal pattern to appear. The pair ended last week below the monthly CZ of September. This indicates an increased likelihood of returning to the specified area. The target is 1.2865. The probability of testing this level is 75%. Trading plans should consider that the pair is going beyond the average monthly move. Increased volatility may lead to changes in the margin requirements for futures. This, in turn, will increase the range of control zones. An important component in making the decision to buy is forming a false breakout pattern of last week's low. This pattern is required in order to implement large limit orders that might be below the June high. It is important not to rush with buy positions until one of the days closes higher than the previous one. |
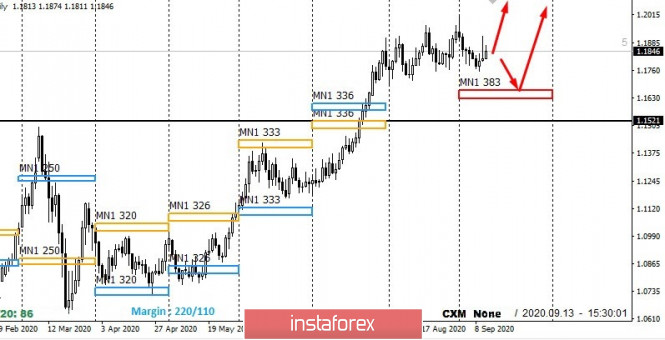
| EURUSD longs in the second half of September Posted: 13 Sep 2020 02:14 PM PDT The upward long-term momentum stopped in August, which made it possible for an accumulation zone to appear. Buyers dictated the end of last week. This led to forming a reversal pattern in order to continue growth. It is important to understand that strengthening the euro is still the mid-term trend. Moving down should be seen as an opportunity to buy an instrument at better prices. Based on last month's movement, we can see that a strong support zone is being created. It acts as a springboard for the pair's growth. You can get very favorable prices for longs in case of a deeper corrective movement before the monthly CZ for September. This pattern has a lower likelihood, but is necessary as a back-up plan. The September high is still the main growth target, so some of the buy positions must be consolidated when it is updated. The material has been provided by InstaForex Company - www.instaforex.com |
| You are subscribed to email updates from Forex analysis review. To stop receiving these emails, you may unsubscribe now. | Email delivery powered by Google |
| Google, 1600 Amphitheatre Parkway, Mountain View, CA 94043, United States | |
No comments:
Post a Comment