
Forex analysis review |
- October 16, 2020 : EUR/USD daily technical review and trade recommendations.
- October 16, 2020 : GBP/USD Intraday technical analysis and trade recommendations.
- October 16, 2020 : EUR/USD Intraday technical analysis and trade recommendations.
- Analysis GBP/USD on 16/10/2020: The EU summit was a waste; parties failed to come to an agreement and Brexit will continue
- Analysis of EUR/USD for October 16. Second COVID-19 wave raging across Europe, but EUR rapidly regains footing
- Technical analysis recommendations for EUR/USD and GBP/USD on October 16, 2020
- EUR/USD and GBP/USD dynamics amid worsening pandemic. Pound may sink to $1.23
- Daimler is profitable again
- OPEC + discusses oil market situation
- Dollar climbs new highs, euro remains tormented by pandemic, while pound suffers amid Brexit
- Technical analysis of EURUSD
- NZDUSD head and shoulders pattern still active but action should come next week
- Gold bulls try to break resistance
- Trading recommendations for the GBP/USD pair on October 16
- GBPUSD: Why did the pound fall so sharply and what did Boris Johnson say to the EU today
- Three reasons to buy a dollar
- BTC analysis for October 16,.2020 -Contraction on the BTC. Watch for the breakout the 4 day balance to confirm further direction
- Evening review on October 16, 2020
- Analysis of Gold for October 16,.2020 - Potential for further rally towards the level at $1.931
- EUR/USD analysis for October 16, 2020 - Potential for the further rise and continuation of the upside trend
- GBP/USD: plan for the American session on October 16 (analysis of morning deals)
- EUR/USD: plan for the American session on October 16 (analysis of morning deals)
- GBP/USD Down Again?
- USD/JPY Upside Thrust?
- Trading idea for the NZD/USD pair
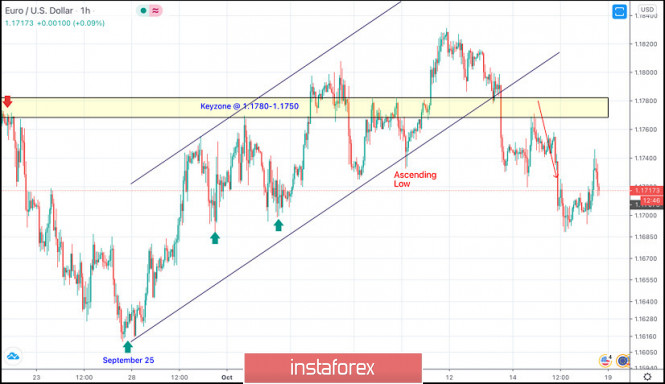
| October 16, 2020 : EUR/USD daily technical review and trade recommendations. Posted: 16 Oct 2020 08:51 AM PDT
On September 25, The EURUSD pair has failed to maintain enough bearish momentum to enhance further bearish decline. Instead, recent ascending movement has been established within the depicted movement channel leading to bullish advancement towards 1.1750-1.1780 which failed to offer sufficient bearish pressure in the first attempt. Earlier this week, temporary breakout above 1.1750 was demonstrated as an indicator for a possible bullish continuation towards 1.1880 where the upper limit of the movement channel comes to meet the pair. However, immediate bearish decline brought the pair back below 1.1750. Hence, the price zone around 1.1750-1.1780 remains a Prominent Resistance-Zone as long as bearish persistence is maintained below it. Any upside pullback towards the depicted zone (1.1750-1.1780) should be considered for another valid SELLING Opportunity. Lower Projection Target levels are located around 1.1720, 1.1685 and 1.1600. Current SELLER should lower their Exit level (Stop Loss) to 1.1750 to secure some profits. The material has been provided by InstaForex Company - www.instaforex.com |
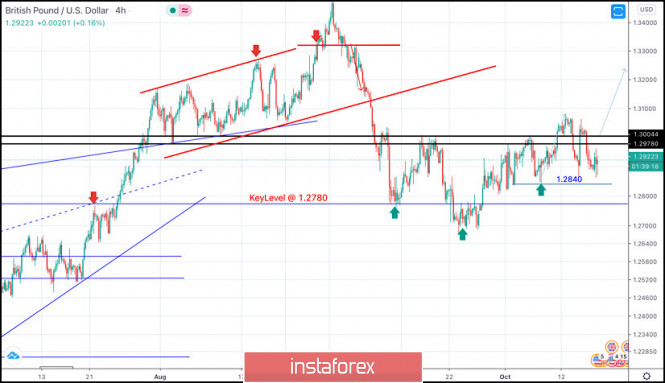
| October 16, 2020 : GBP/USD Intraday technical analysis and trade recommendations. Posted: 16 Oct 2020 08:46 AM PDT
Intermediate-term technical outlook for the GBP/USD pair has remained bullish since bullish persistence was achieved above 1.2780 (Depicted Key-Level) on the H4 Charts. On the other hand, the GBPUSD pair looked overbought after such a quick bullish movement while approaching the price level of 1.3475. That's why, short-term bearish reversal was expected especially after bearish persistence was achieved below the newly-established key-level of 1.3300. A quick bearish decline took place towards 1.2900 then 1.2780 where considerable bullish rejection has been expressed during the past few weeks. The price zone of 1.3130-1.3150 (the backside of the broken-trend) remains an Intraday Key-Zone to offer bearish pressure if retested again. Bullish Persistence above the depicted price zone of 1.2975 -1.3000 is needed to allow bullish pullback to pursue towards higher price levels. However, the GBPUSD pair has been showing lack of sufficient bullish momentum to pursue above the price level of 1.3000 upon the last few bullish trials. Hence, another bearish pullback towards the price level of 1.2780 can be expected to gather enough bullish momentum. Otherwise, the GBP/USD remains trapped around the current price zone of 1.3000 untilfurther bullish advancement is achieved towards 1.3100 and 1.3150. The material has been provided by InstaForex Company - www.instaforex.com |
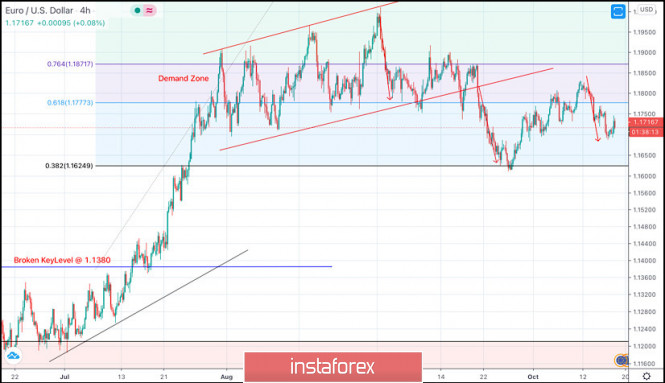
| October 16, 2020 : EUR/USD Intraday technical analysis and trade recommendations. Posted: 16 Oct 2020 08:43 AM PDT
In July, the EURUSD pair has failed to maintain bearish momentum strong enough to move below 1.1150 (consolidation range lower zone). Instead, bullish breakout above 1.1380-1.1400 has lead to a quick bullish spike directly towards 1.1750 which failed to offer sufficient bearish pressure. Bullish persistence above 1.1700-1.1760 favored further bullish advancement towards 1.1975 where some considerable bearish rejection has been demonstrated. The price zone around 1.1975-1.2000 ( upper limit of the technical channel ) constituted a SOLID SUPPLY-Zone which offered bearish pressure. Moreover, Intraday traders should have noticed the recent bearish closure below 1.1700 - 1.1750 as an indicator for a possible bearish reversal. As expected in previous articles, the price zone of 1.1850 - 1.1870 has been standing as a solid SUPPLY Zone providing considerable bearish pressure as well as a valid SELL Entry if any bullish pullback recurs soon. Further bearish decline should be expected towards the next Fibonacci Level at 1.1625 where price action should be watched for possible bearish continuation below it. The material has been provided by InstaForex Company - www.instaforex.com |
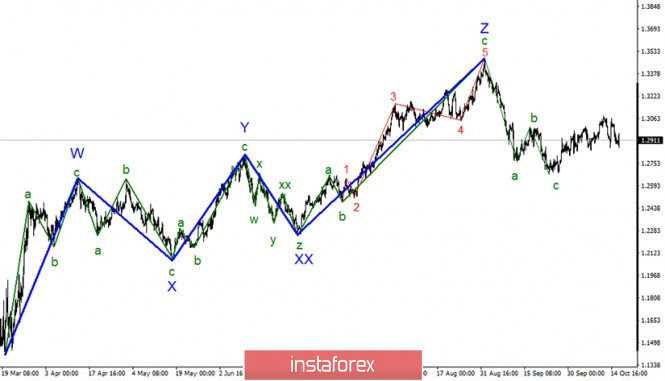
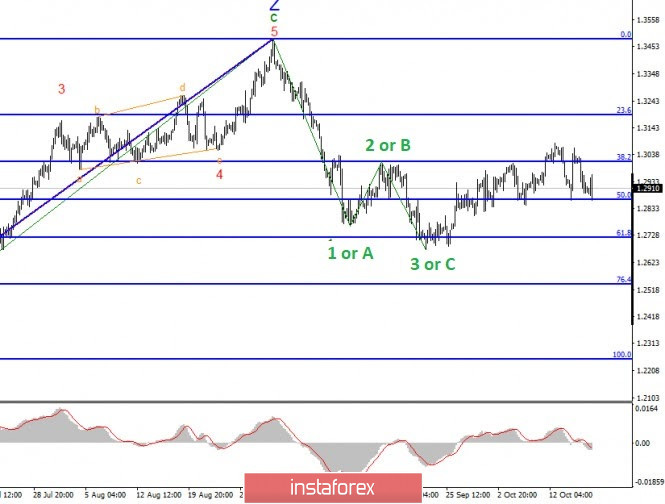
| Posted: 16 Oct 2020 08:02 AM PDT The construction of a new downward trend section is expected to continue. Confidence increases daily that everything will end with abc waves. If this is true, then the price increase will continue from the current levels with targets located near the peak of the z wave. A successful attempt to break through the maximum of wave b also indirectly indicates the readiness of the markets for new purchases of the instrument. However, as in the case of the EUR/USD instrument, the internal wave structure of the upward wave originating on September 23 looks very unusual. A closer look shows that the wave marking of the section between September 1 and September 23 took a three-wave form and at the same time looks quite convincing. An unsuccessful attempt to break the 61.8% Fibonacci level assures that the descending set of waves is complete. Three unsuccessful attempts to break the 50.0% Fibonacci level also speak in favor of resuming the increase in quotations. Thus, above the 50.0% Fibonacci level, the probability of building an upward wave remains. The last few trading days were extremely important for the Pound; at least it seemed like it. The closer the summit itself got, the clearer it became that no decisions would be made during it. Just days before the European Council meeting, many officials said it was unlikely a deal would be reached at all. At the summit itself, it became known that Ursula von der Leyen may have contracted the Coronavirus and subsequently left hastily. After this news, it became clear that no important decisions will be made for sure. Officials in the UK and the European Union continue to simply passing the blame, accusing the opposite side of unwillingness to concede or provide better terms of the deal. Boris Johnson today lashed out at the EU, accusing the Europeans of not wanting to give Britain the same agreement as Canada or Australia. According to the British Prime Minister, his country, after 45 years in the bloc, has earned the right to get a "good deal". The Pound has been jumping up and down during these days but overall, I can't say that he was too upset about the lack of progress in the negotiations. The fact is that over the past few months, almost every week the markets are witnessing batches of new information about the lack of progress in negotiations. Therefore, these information no longer reflect in the charts. Economic reports are not exciting for the markets at this time. Today, the figures for retail trade in the United States for September came out. The main indicator rose by 1.9% m/m, although markets expected a weaker increase. Excluding car sales, sales rose 1.5%. It also rose above forecasts. However, the instrument's quotes still failed to fall below the 50.0% Fibonacci level. General conclusions and recommendations: the Pound-Dollar Instrument has presumably completed the construction of a downtrend section. A successful attempt to break through the 38.2% level allows us to recommend buying a tool with targets located near the 1.3191 and 1.3480 marks (which corresponds to 23.6% and 0.0% Fibonacci) for each new MACD signal up. However, the current news background can lead to a strong complication of the current wave markup. As long as the quotes of the instrument are held above the level of 50.0%, the option with the construction of an upward wave remains as the main option. The material has been provided by InstaForex Company - www.instaforex.com |
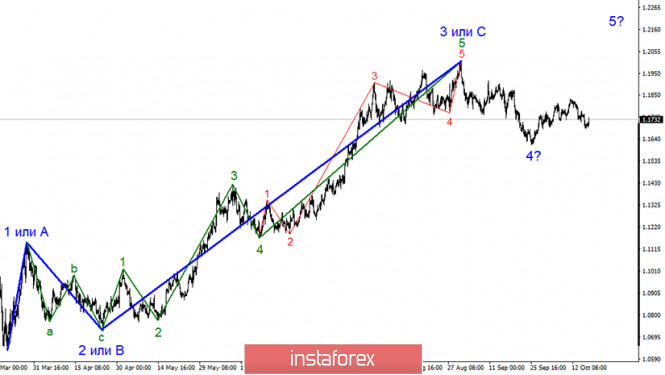
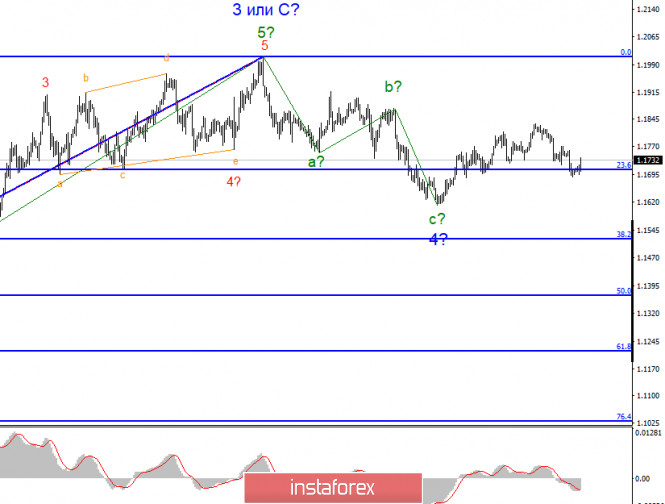
| Posted: 16 Oct 2020 08:00 AM PDT The wave structure of EUR/USD still provides the convincing bullish outlook. Wave 4 looks complete. Thus, the basic scenario is a further climb from the current levels while wave 5 is in progress. Targets are above the high of the suggested wave 3 or C. In other words, the trading instrument is expected to rise at least until 1.2 or even higher. The complications in the wave 4 structure are out of the question now. Interestingly, wave 5 is looking strange because its inner structure doesn't look like a standard momentum wave. The whole wave could develop a lengthy look. The wave structure on smaller timeframes still indicates that the suggested wave 4 consists of three shorter waves. Perhaps wave 4 has been complete. If it is true, the currency pair will resume its climb inside wave 5. However, in the recent days there are doubts that the ongoing rise is actually development of wave 5. What is actually going on is that wave 4 could be getting more complicated looking like a-b-c-d. The argument for this scenario is that the pair has not made a successful attempt yet of breaking the high of wave b inside 4. This option remains valid until 23.6% fibo is successfully broken. In the US, market participants are mulling over the presidential elections in 2020. So much has already been said on this topic that at this time it remains only to wait for the elections outcome. By the way, the elections have already begun, since in America there is such a thing as "early elections." That is, voters who have already decided on their candidate can vote in advance. This is exactly what about 15 million Americans have already done. Of course, there is no point in counting votes at this stage. Joe Biden is taking the lead in all pre-election polls. And nothing more can be said on this topic. Investors have to wait for the election results. In Europe, the full-blown COVID-2019 wave has begun. In many countries, rampant coronavirus rates pose a grave threat, so the situation is very serious. Above all, this applies to France and Spain, however, in many other European countries very high levels of new cases are recorded. Remarkably, "high" now and "high" in spring are very different concepts. Almost every EU country now reports two or three times higher infection rates than in the spring. For several days, the European currency has been declining. Today, having failed to make a successful attempt to break through the 23.6% level, it is developing a steady rise. Hence, it is too early to say that the COVID-19 resurgence in Europe has put pressure on the euro. So, the main scenario is a further upward wave. Conclusions and trading tips Supposedly, EUR/USD has completed correctional wave 4. Nevertheless, as the high of wave b inside wave 4 has not been broken yet, this prompts a conclusion about complications of the whole wave 4. Thus, I still recommend long positions on EUR/USD with the target at near 1.2012 that corresponds to 0.0% Fibonacci for every MACD signal upwards, bearing in mind further global wave 5. However, in case 23.6% is broken successfully, the alternative scenario comes in play with complications of wave 4. The material has been provided by InstaForex Company - www.instaforex.com |
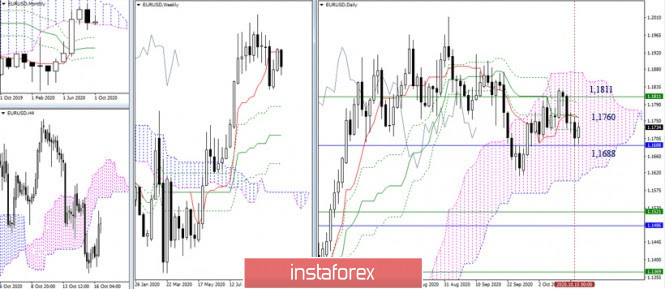
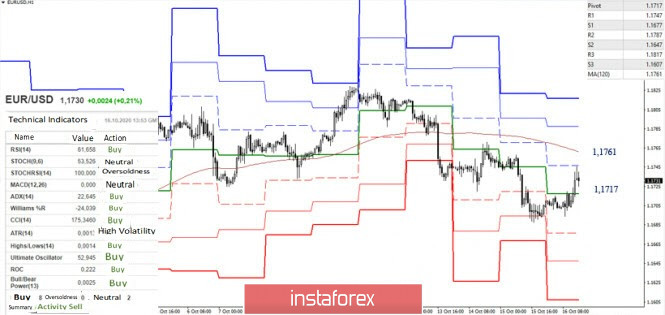
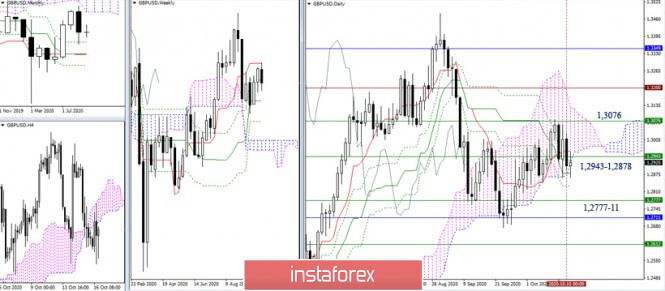
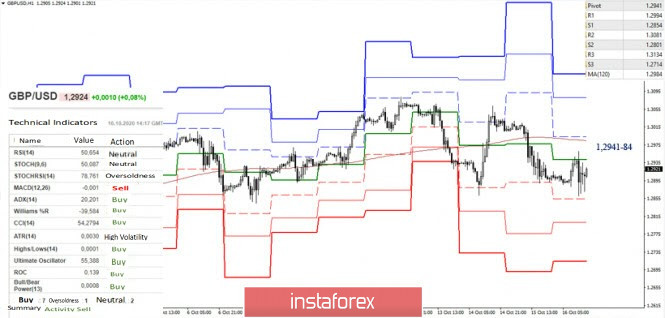
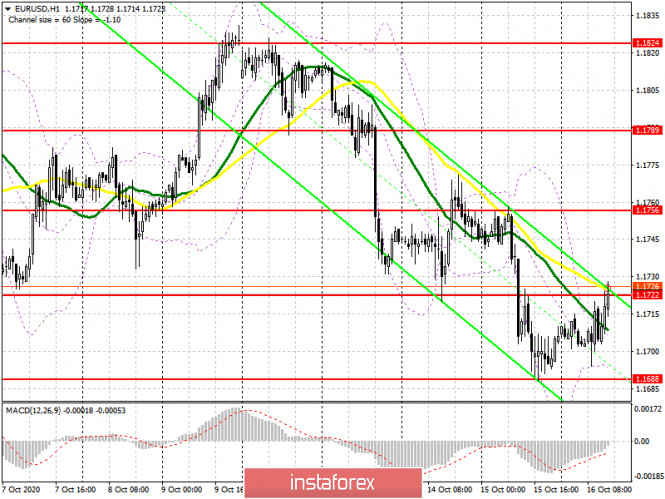
| Technical analysis recommendations for EUR/USD and GBP/USD on October 16, 2020 Posted: 16 Oct 2020 07:45 AM PDT EUR/USD The end of the week approaches. The pair spent the current week within the previously indicated limits, remaining within the limits of 1.1811 (weekly Tenkan) and 1.1688 (monthly Senkou span A). The center of gravity remains the daily cross of 1.1760 (Tenkan + Kijun). At the moment, another test of 1.1688 has again triggered a slowdown. In the remaining time before closing, the question of the length of the lower shadow of the weekly candle is decided. A small shadow or lack of it can inspire players to go down to overcome the support of 1.1688. A long shadow and a return to the center of gravity of 1.1760 will add uncertainty and keep thoughts in the range of 1.1811 – 1.1688. An upward correction is currently developing on the lower timeframes. The bulls during the day managed to capture the Central Pivot level (1.1717), and as a result, the next important benchmark is 1.1761 (weekly long-term trend), the intermediate resistance is 1.1747 (R1). The analyzed technical indicators support the strengthening of bullish sentiment. The result of this correction and its consequences can be assessed as early as next week. GBP/USD The fight continues. The bearish traders on the downside again returned the situation to the important supports of this section 1.2943 – 1.2878 (daily cloud + daily cross + weekly Fibo Kijun), continuing to insist on leaving the daily cloud in the bearish zone and eliminating the daily golden cross. Successful closing of the week – the formation of a pronounced rebound from the weekly short – term trend will direct bearish expectations to test the next important milestone of 1.2777-1.2711 (weekly Kijun + monthly Fibo Kijun). The lack of success and the closing of the current week in the daily cloud (above 1.2943) will most likely lead to continued uncertainty and prepare the ground for a new test of 1.3076 (weekly short-term trend). On H1, we observe the development of a corrective movement. The key levels of the Central Pivot (1.2941) and the weekly long-term trend (1.2984) form the current resstance zone and maintain the main advantage on H1 on the side of players on the downside. Supports within the day are the classic Pivot levels 1,2854 – 1,2801 – 1,2714. Fixing above 1.2941-84 will change the preponderance of forces in the lower halves, as well as affect the weekly result. Ichimoku Kinko Hyo (9.26.52), Pivot Points (classic), Moving Average (120) The material has been provided by InstaForex Company - www.instaforex.com |
| EUR/USD and GBP/USD dynamics amid worsening pandemic. Pound may sink to $1.23 Posted: 16 Oct 2020 07:25 AM PDT
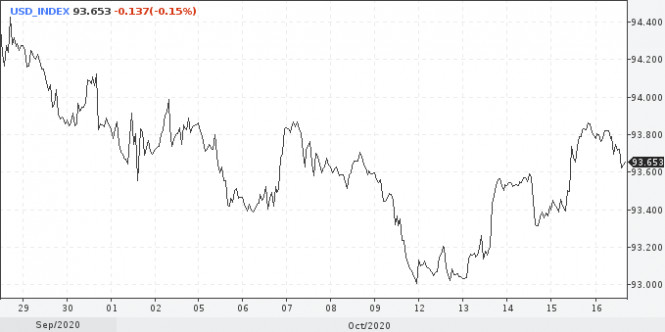
The demand for defensive assets, particularly the dollar, increased amid the worsening coronavirus crisis in Europe and the U.S., as well as due to the stupor with the stimulation of the American economy. The pressure on the U.S. stock markets continues on Friday. Meanwhile, the dollar index is declining again. Before the start of the U.S. session, it was trading around 93.60, which is more than 20 points below the local intra-week high. On Friday, the greenback declined against the yen, euro, and pound, whose share in the index is about 14%, 57%, and 12%, respectively.
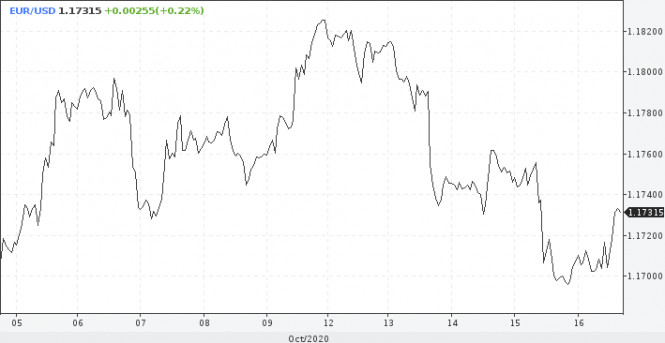
Traders are analyzing US macroeconomic data that can give new impetus to stock markets and the dollar. Retail sales in September were up 1.9% over August. Analysts predicted less significant growth of the indicator by 0.7% in monthly terms. Despite the rebound on Friday, the EUR / USD pair remains under pressure due to the increase in the coronavirus cases in Europe. Several countries in the eurozone may continue to introduce quarantine measures, which will negatively affect the economic activity of the region. Meanwhile, the adoption of a program to support the European economy in the form of a €1.8 trillion spending package at the end of July gives a positive impetus to the euro. With the resumption of the fall in stock indicators, the US dollar is likely to grow, which will force euro buyers to move away from the recent local lows at the support level of 1.1610.
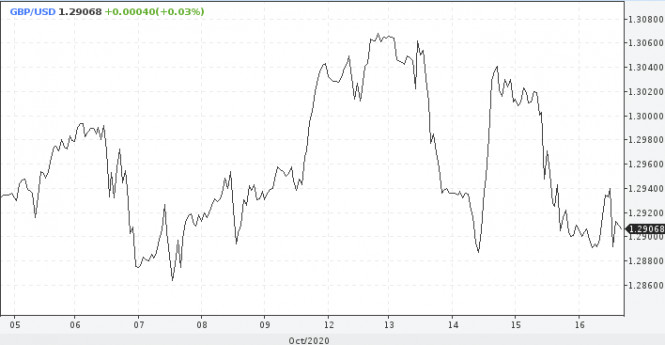
If we look at the technical side of the movement of the EUR/USD pair, we can say with confidence that now the euro continues to develop a downward trend. Quotes form a correction on Friday before another decline. The target, as indicated above, is the area of the next support level 1.1610. The development of the situation with the aim of returning to the levels above 1.18 should not be excluded either. Judging by the muted dynamics of the pound, traders are not paying attention to the risk of no trade deal with the EU, and perhaps for nothing. The British Prime Minister lashed out at the EU with another criticism. Boris Johnson claims that Europe is trying to maintain control over the UK's trade, and this is unacceptable for an independent state. Following the statements on Thursday, the EU may not plan to extend the transition period, which expires on January 1 next year. Nothing changes, and there is no point in continuing to argue and trample in one place. Thus, there are 10 weeks left for everything, and the chances of concluding a trade agreement tend to zero. If Britain decides to leave the EU without a deal, the pound risks falling to the dollar by 1.7–4.7%. This means that sterling, which is trading just above 1.29 on Friday, may sink to 1.23.
The rejection of the deal will be a real shock to the British economy, which is already weakened due to the pandemic. Investors have long considered a no-deal exit as a real scenario, but they still have a glimmer of hope for an agreement. This means the markets' reaction to a no-deal Brexit could be disastrous. The medal has a reverse side, which also should not be forgotten. In this case, we are talking about concluding a deal that will cause the pound to grow both against the dollar and against the euro. However, sterling is already trading at a premium to fair value, which means the rally may be limited. The material has been provided by InstaForex Company - www.instaforex.com |
| Posted: 16 Oct 2020 06:49 AM PDT
The company began to sell more of its products and cut costs, receiving more than 5.1 billion euros in profit, while analysts predicted only 3 billion euros. It is important to note that all of the passenger car, vans and truck divisions have shown good earnings before interest and taxes. In addition, the company received a huge € 1.2 billion dividend from its operations in China. The company also said it expects positive dynamics to continue in the fourth quarter after a particularly strong September. There are speculations that there will be new statements about higher profits for other automakers. The company's results are released on the day that car registrations in Europe rose for the first time in 2020 over the same period last year. This probably means that the worst part of the pandemic is really over. The STOXX 600 Autos & Parts Index rose 2.1% in response. The absence of new restrictive measures in Europe also confirms the company's statement of continued profit growth in the fourth quarter. There is also reason to believe that there are some shortcomings in Daimler's sales structure: the company's announcement earlier this month to accelerate the move to electric vehicles only acknowledges that the company is still lagging behind in this regard. The material has been provided by InstaForex Company - www.instaforex.com |
| OPEC + discusses oil market situation Posted: 16 Oct 2020 05:58 AM PDT
On Thursday, oil prices corrected slightly after the previous two-day gains. Brent oil futures for December lost 0.37% to trade at $43.16, while WTI November futures fell by 0.36% to settle at $40.96. The spread between the Brent and WTI contracts is about $2.2. Due to Hurricane Delta in the Gulf of Mexico, which forced the evacuation of personnel and stopped operation, oil production fell by 0.5 million barrels per day to 10.5 million barrels per day. Net oil imports rose slightly to 3.15 million barrels per day, refinery utilization decreased from 77.1% to 75.1%, and oil stockpiles and products fell as well. Distillate reserves were previously held at a historically high level due to a slow recovery in demand for petroleum products. However, now stocks have dropped by 7.2 million barrels at once, although the forecast was only 2.1 million barrels. This was caused by the hurricane as the work of oil refineries was stopped. OPEC + met on Thursday to discuss oil output growth in Libya and demand risks from the second wave of COVID-19. The main topic of discussion was a slower pace of demand recovery in the fourth quarter of this year. As a result, OPEC + may change the terms of the deal and cut production even more. However, some participants are discussing the possibility of softening the terms in 2021 to 5.7 million barrels per day. By the end of 2020, the reduction will amount to 7.7 million barrels per day. Next time OPEC + will meet on November 30 and December 1. During the meeting, they also discussed how countries adhere to the requirements of the deal. There are countries in the group that ignore the terms. So, these countries need to compensate for about 2.4 million barrels per day of oil overproduction. According to the report of the technical committee, Iraq was the main violator of the deal. Its non-compliance with the production cuts was 698 thousand barrels per day. In May 2020, OPEC + agreed to cut production by 9.7 million barrels per day amid falling demand due to the coronavirus pandemic. However, in May the agreement was fulfilled by only 87%. In August, the reduction in production was supposed to be 8.85 million barrels, and not 7.7 million barrels per day. In September, the volume of compensatory production cuts remained underperformed by 2.33 million barrels per day. In other words, the possibility of a negative change in the terms of the deal increases. In addition, on October 15, the Energy Intelligence Forum was held, at which representatives of the largest oil traders such as Vitol, Gunvor and Trafigura took part. All participants noted that oil demand is recovering very slowly. They expect oil prices to rise above $50 no earlier than October 2021. Vitol representative Russell Hardy noted that insufficient funding of oil production could lead to another jump in prices in 3-5 years. He thinks now is a good time to invest in the long term. The material has been provided by InstaForex Company - www.instaforex.com |
| Dollar climbs new highs, euro remains tormented by pandemic, while pound suffers amid Brexit Posted: 16 Oct 2020 05:46 AM PDT
The American currency is close to completing the week with its maximum rise in a month. The rise of the second wave of the coronavirus outbreak in Europe and the lack of progress on a new stimulus package in the U.S. have boosted demand for safe assets. Thus, the USD index climbed to a two-week high of 93.9 points. In light of the grave coronavirus crisis in Europe, several countries, including Germany, France, and the UK, have announced new restrictive measures in an attempt to slow the outbreak. The US midwest is also grappling with a record rise in new coronavirus cases, while macro data indicates a slower recovery in the US economy. The number of jobless claims in the U.S. jumped to 898,000 last week, which turned out to be worse than expected, while manufacturing activity in New York fell more than expected. At the same time, attempts to propose further stimulus to the US economy is bogged down in trilateral negotiations between the White House, Senate Republicans, and House Democrats. "There are still significant disagreements between all parties that should play a role in the agreement, and the market's assumption that the deal will take place sooner rather than later is questioned," said Global Investments. "Investors fear a slowdown in economic activity as new cases of the virus rise. The deterioration of the situation is observed practically throughout Europe, which is a serious blow to the dynamics of recovery and increases deflationary risks," said ANZ strategists.
European countries are trying to avoid imposing restrictions at the national level, but the measures already taken are putting pressure on economic activity in the region and the common currency. EUR / USD bulls are struggling to hold the important support at 1.1700. If they succeed, the pair could recover to 1.1750-1.1760. Otherwise, it risks sinking to 1.1680 and further to 1.1630 and 1.1610. Meanwhile, the first day of the EU summit failed to please fans of the sterling. EU leaders said they were not ready to make concessions to conclude a deal with London. UK's Prime Minister, Boris Johnson does not intend to conclude a trade agreement on current terms. In this regard, French President Emmanuel Macron and German Chancellor Angela Merkel urged Johnson to re-examine the situation as the absence of a deal will hit the British economy the hardest. The pound has lost about 1% this week and was last seen at $1.2912. According to some estimates, the pound sterling will lose 1.7-4.7% against the US dollar and 1.5-4.4% against the euro if the UK decides to leave the EU without a trade deal. On the other hand, the conclusion of the agreement will cause the sterling to rise against both the dollar and the euro. However, any rally in the pound will be limited by the fact that the UK economy is already facing new restrictions due to the coronavirus and the Bank of England may impose negative interest rates. The material has been provided by InstaForex Company - www.instaforex.com |
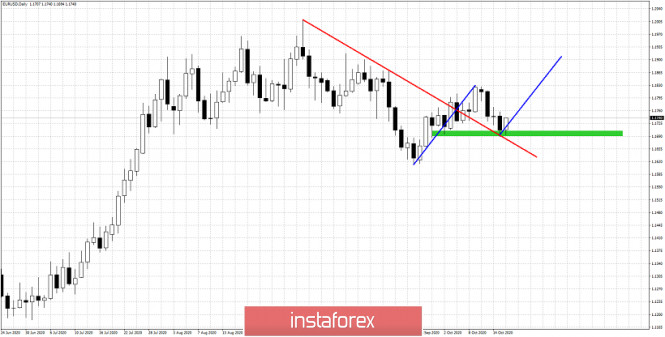
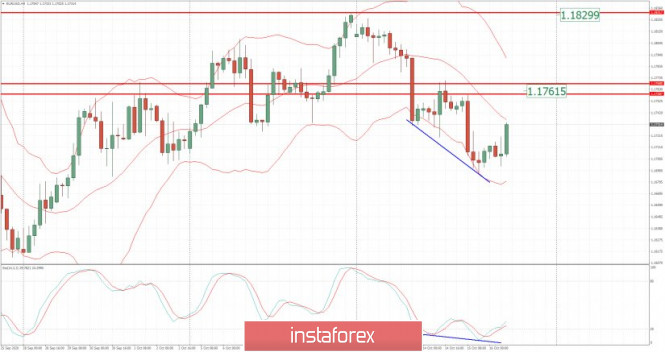
| Posted: 16 Oct 2020 05:31 AM PDT EURUSD has back tested the broken trend line resistance at 1.1690 and is now bouncing higher. What could this mean? What can we expect next from EURUSD? One thing is for sure. Next week I expect volatility to rise.
Red line -resistance (broken) Green rectangle -support Blue line- price projection path EURUSD has broken the resistance trend line but pulled back right above for a back test. The green rectangle is at recent higher lows and is key support. For a bullish move towards 1.19 to be achieved, EURUSD needs to hold above 1.1690 support. Next resistance that needs to be broken is at 1.1770. As long as price holds above 1.1690 we expect to see price move higher. The material has been provided by InstaForex Company - www.instaforex.com |
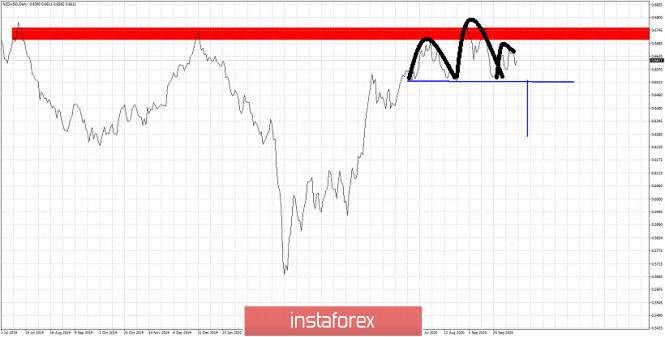
| NZDUSD head and shoulders pattern still active but action should come next week Posted: 16 Oct 2020 05:26 AM PDT At the end of the week NZDUSD remains near the highs of the right hand shoulder in the possible head and shoulders pattern we identified a few days ago. We remain bearish as long as price is below the key resistance at 0.67.
Horizontal Blue line -neckline support Black lines - head and shoulders pattern Blue vertical line -target size of drop if pattern activated The chances of this pattern playing out are high. However as we previously said, this bearish pattern is only activated once price breaks below the horizontal support trend line. So bears need to break below 0.65. As long as price remains above 0.65 bulls have hopes of challenging the 0.68-0.69 area. The material has been provided by InstaForex Company - www.instaforex.com |
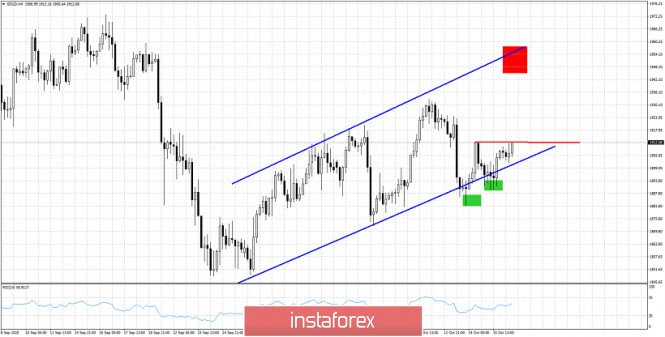
| Gold bulls try to break resistance Posted: 16 Oct 2020 05:21 AM PDT Gold price is trading above $1,900 again and is challenging important short-term resistance at $1,910-15 area. Gold bulls need to continue making higher highs and higher lows and in order to resume the up trend towards $1,955 and maybe higher.
Green rectangles - higher lows Red line - horizontal resistance Red rectangle -target Gold price target remains at $1,955 as long as price remains above the green rectangles. Bulls need to break above $1,910-15 on a daily basis and stay above this level in order to continue higher towards our target of $1,955. As long as price remains above $1,882 which was our stop from our latest trading plan, we remain optimistic. Breaking below $1,882 will cancel all short-term bullish scenarios. The material has been provided by InstaForex Company - www.instaforex.com |
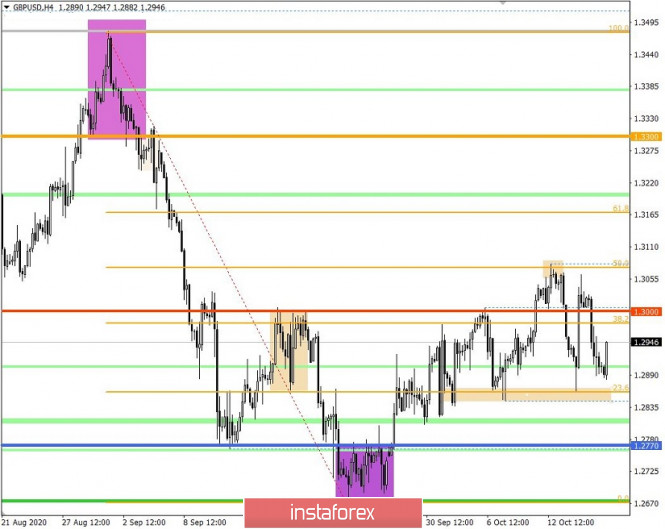
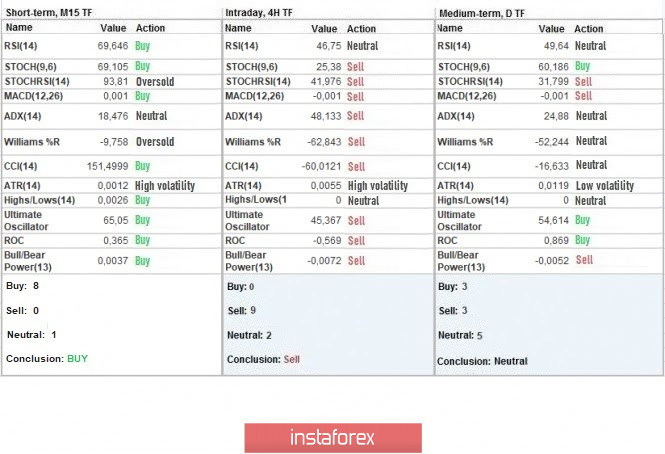
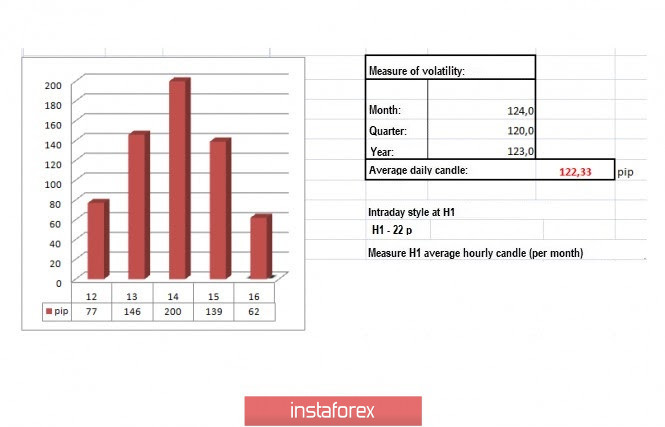
| Trading recommendations for the GBP/USD pair on October 16 Posted: 16 Oct 2020 05:16 AM PDT The trading week is coming to an end. If we analyze all price movements that occurred this week, we will see that large speculative jumps started when the quote reached the psychological level of 1.3000. In fact, it was with the use of technical analysis that key coordinates were determined, within which price jumps were observed. The key coordinates are: 1.2860; 1.3060 / 1.3080. The overall structure, albeit has a wide range, is rather shaky, in which if there is a more dominant activity from certain participants (Bulls or Bears), a breakout occurs, which leads to a further surge in activity. The trading strategy, as before, gives preference to short-term trading operations, where news, as well as areas of interaction of trade forces, serve as trading signals. So, if we look at the M15 chart and analyze the trades set yesterday, we will see that many short positions appeared at 06: 45-15: 30, during which the quote moved towards the level of 1.1860. Such a movement is quite identical with what happened to the EUR / USD pair. In terms of daily dynamics, the indicator recorded 139 points for October 15, which is 13% above the average level. Activity has been high in the market for three days already, which indicates a high ratio of speculative positions in the GBP / USD pair. This is because following the previous review , traders held the quote below 1.3000 in order to trigger a downside move in the pair. Fortunately, it really occurred and coincided with the earlier trading forecast. As for the daily chart, it is quite clear that the correction that started from the local low 1.2674 is coming to an end, and it seems that a recovery process is due to begin soon. With regards to other factors that influence price movement, a slightly weak US labor market report was released, where it was revealed that initial jobless claims increased from 845,000 to 898,000, while second claims decreased from 11,183,000 to 10,018,000. In this case though, the advantage is on the side of second claims, so the US dollar rose evidently in the market. Another factor was the long-standing issue on the post-Brexit deal, which, until now, has not been resolved. The negotiations started again yesterday, however, the EU only reaffirmed that the transition period ends on December 31, and said that countries should prepare for a British exit without a deal. "The European Council confirms that the transition period will end on December 31, 2020 and notes with concern that progress in the negotiations on key issues for the community is not enough to reach an agreement. Against this background, the EU is instructing its chief negotiator, Michel Barnier, to continue negotiations in the coming weeks, and urge the UK to take necessary actions to make the agreement possible. In this regard, the European Council calls on all countries and institutions of the community, as well as all interested players, to intensify work at all levels to prepare for all scenarios, including the absence of an agreement. The summit instructs the European Commission to timely prepare proposals for unilateral emergency measures to ensure the interests of the European Union, "the EU summit document says. London, in turn, expressed its disappointment. "The UK is disappointed with the decision taken at the EU summit. We are surprised that the EU is no longer committed to working hard to achieve a future partnership "said UK chief negotiator, David Frost Today, data on US retail sales will be published, and the growth rate of which may slow down from 2.6% to 2.2%. The upcoming trading week contains many statistical indicators, including data on inflation and retail sales in the United Kingdom. However, the main driver, as before, will be Brexit, coronavirus and the US elections. Tuesday, October 20 USA 13:30 - Number of issued building permits (September) USA 13:30 - Volume of construction of new houses (September) Wednesday, October 21 UK 07:00 - Inflation Thursday, October 22 US 13:30 - Jobless claims US 15:00 - Sales in the secondary housing market (September) Friday, October 23 UK 07:00 - Volume of retail sales (September) US 14:45 - Preliminary Services PMI (October) Further development As we can see on the trading chart, strong fluctuations occurred in the GBP / USD pair, so we should pay close attention to coordinates 1.2860; 1.3060 / 1.3080, as a breakout from which can lead to strong impulsive waves in the market. Indicator analysis Looking at the different sectors of time frames (TF), we can see that the indicators on the minute period signal BUY, while the indicators on the hourly period signal SELL. The daily period, on the other hand, changed signal from BUY to NEUTRAL, and this is because of the price convergence in the GBP / USD pair. Weekly volatility / Volatility measurement: Month; Quarter; Year Volatility is measured relative to the average daily fluctuations, which are calculated every Month / Quarter / Year. (The dynamics for today is calculated, all while taking into account the time this article is published) Volatility is currently at 62 points, which is 49% below the average level. Since speculative activity remains high in the market and that a bunch of news are still relevant on market sentiment, volatility will continue to jump in the GBP / USD pair. Key levels Resistance zones: 1.3000 ***; 1.3200; 1.3300 **; 1.3600; 1.3850; 1.4000 ***; 1.4350 **. Support Zones: 1.2770 **; 1.2620; 1.2500; 1.2350 **; 1.2250; 1.2150 **; 1.2000 *** (1.1957); 1.1850; 1.1660; 1.1450 (1.1411). * Periodic level ** Range level *** Psychological level Also check the brief trading recommendations for EUR / USD pair here. The material has been provided by InstaForex Company - www.instaforex.com |
| GBPUSD: Why did the pound fall so sharply and what did Boris Johnson say to the EU today Posted: 16 Oct 2020 05:08 AM PDT The British pound sharply slowed down in a pair with the US dollar after today's statements made by British Prime Minister Boris Johnson. One of the main tasks of the UK government, except for saving the economy and protecting the country's population from the coronavirus pandemic, is to conclude a trade agreement with the EU. However, everything is not going according to plan, and neither side wants to concede on the main key points.
The British pound fell sharply after a small upward correction in the first half of the day. This happened during a speech by Boris Johnson, who said that it was clear to him from the very beginning that the EU would not accept the same trade conditions under which they interact with Canada. In his opinion, the "Canadian agreement" would be the solution to all problems, but for some reason, Brussels does not want this. Judging by what is happening now and what news is coming out, the October EU summit will not clarify the problem with the trade agreement, but will only make the situation worse for both sides. Johnson lashed out at EU leaders, saying they were trying to maintain the ability to control British freedom of trade, including fishing, which is completely unacceptable for an independent country. Given the fact that there are only 10 weeks left until the end of the transition period on January 1, the probability of concluding a trade agreement very quickly tends to zero, especially given yesterday's EU statements, from which it is clear that no one is going to extend this period for sure, and there is no point in it. The British Prime Minister was also clearly unhappy with the results of negotiations over the past few months, as well as the fact that the EU is ruling out a Canadian-style deal. "But despite this, we are ready for the changes that will occur on January 1. It is time to prepare our companies and businesses for the new realities," Boris Johnson said. However, do not completely put an end to the EU-UK relationship. It is clear from the presentation that the discussion of practical aspects in which much progress has already been made, namely social security, aviation and nuclear, will continue. Boris Johnson was also annoyed by the fact that after 45 years of EU membership, the UK is no longer willing to offer the same conditions as Canada. According to him, if none of the parties agrees to change the fundamental approach of their views, and, judging by the results of the EU summit, it is likely to be so, it will be almost one hundred percent sure to forget about the deal. As noted above, the British pound reacted with a large surge in volatility, as a result of which all the growth that was achieved by buyers during the European session was immediately blocked by a fall in the pound by more than 90 points. But from a technical point of view, the picture has not changed in any way, except for some of the nearest levels. The bears are still looking at the level of 1.2850, a break of which will very quickly return the pound to the support of 1.2800, which will open a direct road to a new local minimum of 1.2740. It will be possible to talk about the prospects of buyers returning to the GBPUSD pair only if there is good news from the EU on Brexit, which will lead to a break in the resistance of 1.2950 and open a direct road to the area of 1.3010 and 1.3085. The material has been provided by InstaForex Company - www.instaforex.com |
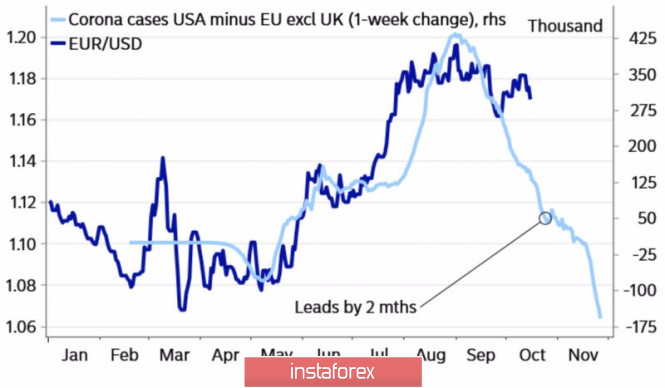
| Posted: 16 Oct 2020 05:02 AM PDT A week ago, I mentioned that the inability of the EUR/USD bulls to gain a foothold above the base of the 18th figure will be a sign of their weakness and create prerequisites for a correction. In fact, this is what happened: the main currency pair closes the five-day period by October 16 in the red zone, while the introduction of repeated restrictions in Europe due to COVID-19, uncertainty around the US presidential election, and the deterioration of macro statistics for Germany and the Eurozone can lead to the development of a pullback. Investors often build a strategy on the divergence. And if the differences in economic growth and monetary policy in June-August played into the hands of the bulls of EUR/USD, the situation has changed significantly in the fall. The pandemic should be blamed for this. The epidemiological situation in the U.S. and Europe continues to worsen. The number of cases is growing, and Paris and London are talking about new restrictions. As a result, the COVID-19-related divergence supports the US dollar. Dynamics of EUR / USD and the ratio of the number of infected in the US and EU:
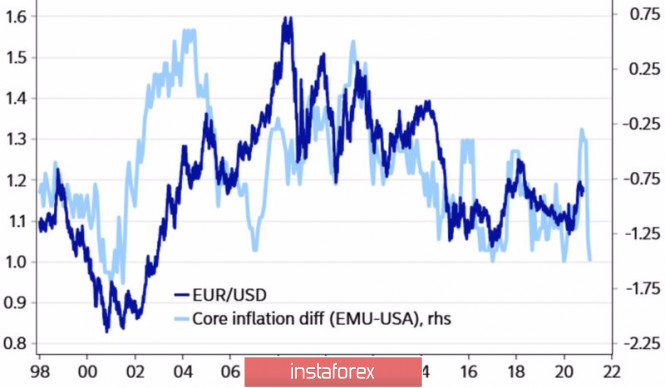
In the summer, a more effective fiscal stimulus and competent management of the pandemic allowed the Euro to strengthen, but we must admit that the Fed's monetary policy has given a greater return than that of the ECB. This is clearly seen in the dynamics of inflation: in the U.S. an increase of 5% was recorded over the past three months, while Eurozone went down by 1%. Divergence in core inflation is a good leading indicator that allows you to predict the future dynamics of EUR/USD, and now it shows in favor of the correction of the main currency pair. Dynamics of EUR / USD and the ratio of core inflation in the USA and the Eurozone:
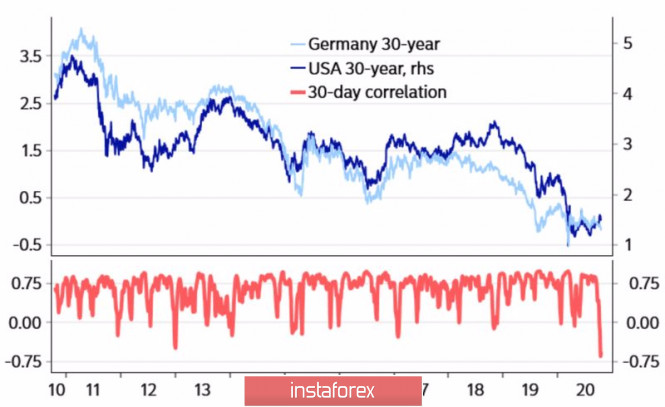
Financial markets do not expect changes in the monetary policy of the Federal Reserve, but they do not mind seeing the expansion of the emergency asset purchase program to combat the pandemic by the European Central Bank. This gives grounds for higher yields on US Treasury bonds, while rates on their European counterparts, including Germany, Italy, Spain, and other countries, remain subdued. As a result, the negative correlation between assets has grown to the highest level in at least a decade, which is not good news for the euro. Dynamics of 30-year US and German bond yields and correlation between debt rates:
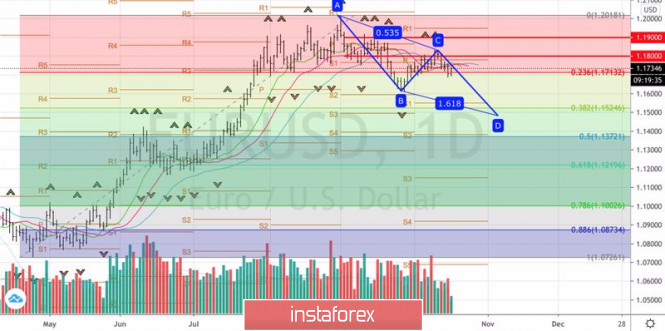
Thus, divergences in the epidemiological situation, in core inflation, and in bond yields signal in favor of the development of a corrective movement in the EUR/USD pair. The only thing that can prevent a pullback is a "blue wave" – the Democrats' taking of the White House and Congress, which will increase hopes for fiscal stimulus and allow the S&P 500 to soar. While the market doubts that the Republicans will give up the Senate, the US dollar feels confident. Technically, the rebound from the lower border of the shelf (range 1.18-1.19) of the Splash and shelf pattern indicates the seriousness of the EUR/USD bears' intentions to develop a correction. They are set to activate the AB=CD model with a target of 161.8%. It is located near the 1.149 mark. Our recommendation is selling on pullbacks. EUR / USD, daily chart:
|
| Posted: 16 Oct 2020 04:54 AM PDT Further Development
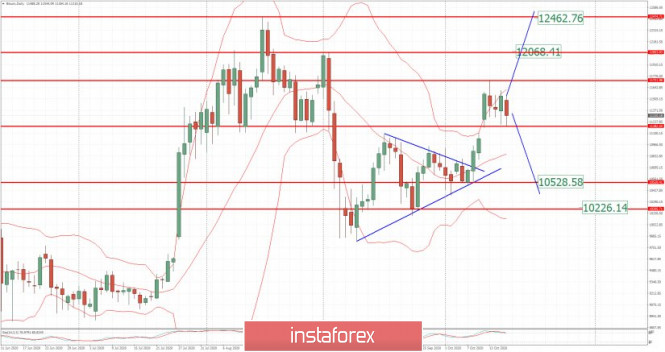
Analyzing the current trading chart of BTC, I found that there is consolidation process and that waiting for the breakout would be best advice. The breakout of resistance at $11,700 can confirm test of $12,000 and $12,460 The breakout of support at $11,180 can confirm downside movement and potential test of $10,530 and $10,230. Watch for the breakout to confirm further direction Key Levels: Resistance: $11,700 Support level: $11,180 The material has been provided by InstaForex Company - www.instaforex.com |
| Evening review on October 16, 2020 Posted: 16 Oct 2020 04:54 AM PDT
The downward breakdown of the EURUSD pair turned out to be false. You may buy the euro from 1.1720. It is possible to buy in case of a breakdown from 1.1760 with a stop at 1.1715. There is no major news, but volatility may increase at 12:30 UTC. The upward trend may continue with a potential target of up to 1.2450. The material has been provided by InstaForex Company - www.instaforex.com |
| Analysis of Gold for October 16,.2020 - Potential for further rally towards the level at $1.931 Posted: 16 Oct 2020 04:44 AM PDT
Some token remarks by Villeroy, as we have seen from most ECB speakers this week. All of this is mainly to reaffirm that they are still in a wait-and-see approach and will only consider more action should there be material downside to incoming economic data.
Further Development
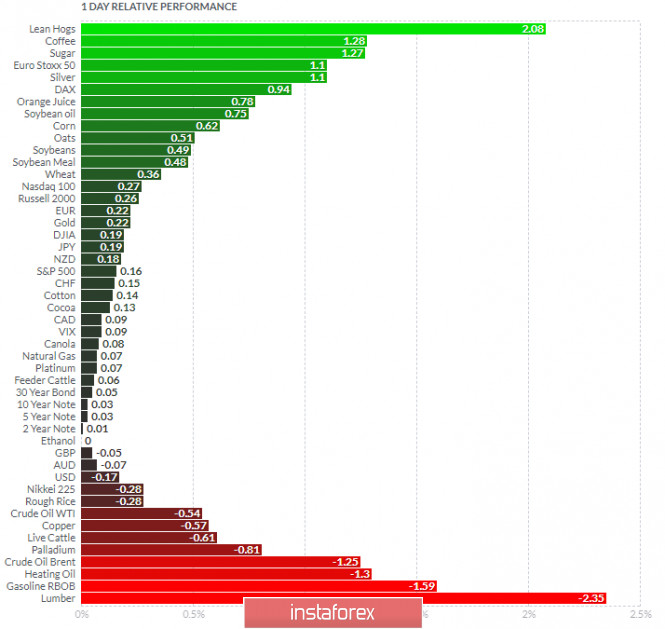
Analyzing the current trading chart of Gold, I found that the sellers got exhausted today and that price failed to test recent swing low based on the 4H time-frame, which is good sign for further rise. The Golds in overall uptrend on the short-mid term and my advice is to watch for buying opportunities on the dips with the tragets at $1,931 and $1,9543 Key pivot level resistance is set at $1,913 1-Day relative strength performance Finviz
Based on the graph above I found that on the top of the list we got Lean Hogs and Coffee today and on the bottom Lumber and Gasoline RBOB. Gold is positive today on the relative strength list, which is another sign for the upside movement. Key Levels: Resistance: $1,913, $1,930 and $1,955 Support level: $1,890 The material has been provided by InstaForex Company - www.instaforex.com |
| Posted: 16 Oct 2020 04:35 AM PDT
Some token remarks by Villeroy, as we have seen from most ECB speakers this week. All of this is mainly to reaffirm that they are still in a wait-and-see approach and will only consider more action should there be material downside to incoming economic data. Further Development
Based on the graph above I found that on the top of the list we got Lean Hogs and Coffee today and on the bottom Lumber and Gasoline RBOB. Key Levels: Resistance: 1,1760 and 1,1830 Support level: 1,1700 The material has been provided by InstaForex Company - www.instaforex.com |
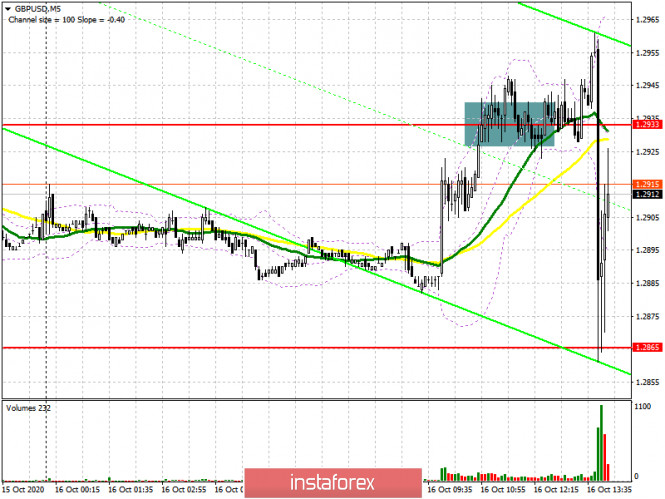
| GBP/USD: plan for the American session on October 16 (analysis of morning deals) Posted: 16 Oct 2020 04:31 AM PDT To open long positions on GBP/USD, you need: In the first half of the day, it was not possible to generate signals for entering the market. As seen on the 5-minute chart, the level of 1.2933 was blurred as a result. Because of this, it was not possible to get a clear signal to buy or sell the pound. After that, British Prime Minister Boris Johnson made several statements related to the EU and the trade agreement, which led to a sharp spike in market volatility. However, given the nature of the statements, this did not affect the technical picture of the pair.
In the second half of the day, buyers of the pound will now focus on the resistance of 1.2945, the consolidation of which will open the opportunity for a new wave of growth of GBP/USD in the area of 1.3008. However, only good news from the EU will support the British, which will lead to a test of the maximum of 1.3080, where I recommend fixing the profits. An equally important task will be to protect the support of 1.2865, which the bulls managed in the first half of the day. In the case of a repeated decline of the pair at the US session, the formation of a false breakout will be a signal to open new long positions in the expectation of strengthening GBP/USD. If there is no bull activity in this range, it is better not to hurry with purchases, but wait for the test of the nearest major support level in the area of 1.2807. You can also open long positions immediately on the rebound from the minimum of 1.2749 to correct 20-30 points within the day. To open short positions on GBP/USD, you need: In the afternoon, sellers need to defend the resistance of 1.2945, but much will depend on the news on the trade agreement and the decisions taken during today's European Union summit. Only the formation of a false breakout at the level of 1.2945 forms a signal to sell the pound, but for major bearish pressure, bad news on Brexit is needed, which is expected today in the afternoon. After fixing below the support of 1.2865, then we can expect a new and larger wave of decline in the pair with a return to the area of 1.2807. A longer-term goal will be a minimum of 1.2749, where I recommend fixing the profit. If the pair grows in the second half of the day and there is no activity in the resistance area of 1.2945, it is best to postpone short positions until the maximum test of 1.3008, where you can sell the pound immediately for a rebound in the expectation of correction of 20-30 points within the day.
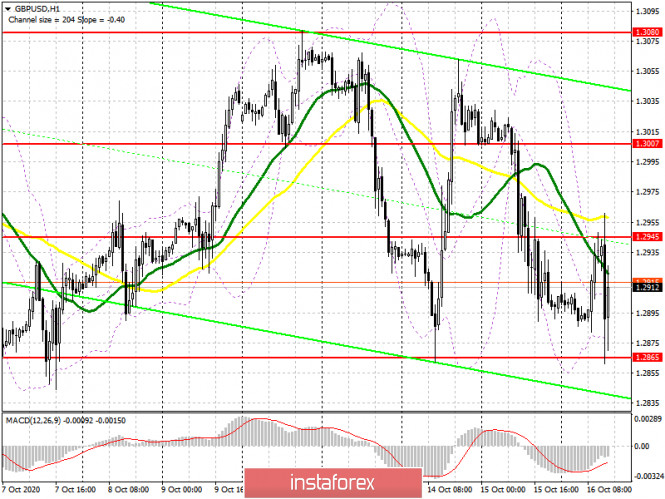
Let me remind you that in the COT reports (Commitment of Traders) for October 6, there was a minimal increase in short non-commercial positions from the level of 51,961 to the level of 51,996. Non-commercial long positions have increased slightly from the level of 216,39 to level 40,698. As a result, the non-commercial net position remained negative and amounted to -11,298 against -12,745, which indicates that sellers of the British pound remain in control and have a minimal advantage in the current situation. The higher the pair grows, the more attractive it will be for sale. Signals of indicators: Moving averages Trading is conducted in the area of 30 and 50 daily averages, which indicates an active confrontation between buyers and sellers. Note: The period and prices of moving averages are considered by the author on the hourly chart H1 and differ from the general definition of the classic daily moving averages on the daily chart D1. Bollinger Bands If the pair grows, the upper limit of the indicator will act as a resistance in the area of 1.2945, a break of which will lead to a new strengthening of the pound. Description of indicators
|
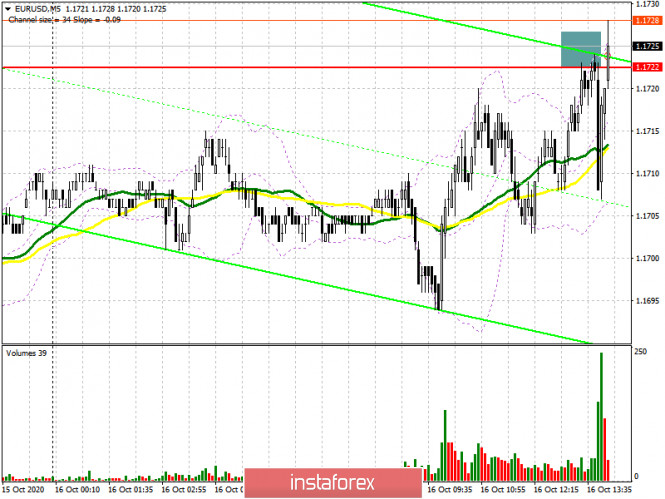
| EUR/USD: plan for the American session on October 16 (analysis of morning deals) Posted: 16 Oct 2020 04:30 AM PDT To open long positions on EURUSD, you need: In the morning forecast, I paid attention to sales from the level of 1.1722, provided that a false breakout is formed. On the 5-minute chart, the first attempt to reach the resistance of 1.1722 was unsuccessful, however, the second test led to the formation of a false breakout, after which the bears immediately returned to the market, increasing pressure on the euro. However, there was no major downward movement, although there were all the prerequisites for this. Most likely, the reason is the news on Brexit, which is now the most important for the Forex market.
In the second half of the day, all attention will also be focused on the level of 1.1722 and on actions in the area of this range. Now the bulls are trying to gain a foothold above this area, however, only a real break and a test of this range from top to bottom on the volume forms a signal to open long positions in the expectation of continuing the upward correction to the resistance area of 1.1756, where I recommend fixing the profits. If the bears manage to defend this range in the second half of the day after the release of the report on retail sales in the United States, it is best to postpone purchases and wait for the renewal of the weekly low, where the formation of a false breakout will be a signal for opening long positions. Otherwise, I recommend buying EUR/USD only for a rebound from the new low of 1.1644, based on a correction of 15-20 points within the day. To open short positions on EURUSD, you need to:
Sellers will continue to try to defend the resistance of 1.1722, however, news related to the EU's decision on a trade agreement with the UK may spoil everything. Don't rush to sell the pound. It is best to wait for the next unsuccessful attempt of the bulls to get above 1.1722 with a return under this range. Only this scenario will lead to the formation of a larger downward wave in the support area of 1.1688. An equally important task for the continuation of the bear market will be to break through this range, fixing under which will form a new signal to sell the euro with the main goal of testing a new minimum in the area of 1.1644, where I recommend fixing the profits. If the bulls turn out to be stronger in the second half of the day, it is best to postpone sales until the high of 1.1756 is updated, based on a correction from it of 15-20 points within the day. Let me remind you that the COT report (Commitment of Traders) for October 6 recorded a reduction in long positions and an increase in short ones, which led to an even greater decrease in the delta. Buyers of risky assets believe in the continuation of the bull market, however, they prefer to proceed cautiously, as there is no good news on the Eurozone and the pace of economic recovery yet. So, long non-commercial positions decreased from level 241,967 to 231,369, while short non-commercial positions increased from 53,851 to 57,061. The total non-commercial net position fell to 174,308 from 188,116 a week earlier, indicating a wait-and-see position for new players. However, the bullish sentiment for the euro remains quite high in the medium term. Signals of indicators: Moving averages Trading is conducted in the area of 30 and 50 daily moving averages, which indicates an active confrontation between buyers and sellers. Note: The period and prices of moving averages are considered by the author on the hourly chart H1 and differ from the general definition of the classic daily moving averages on the daily chart D1. Only a break of the lower limit of the indicator around 1.1695 will increase the pressure on the euro and lead to a new fall. Description of indicators
|
| Posted: 16 Oct 2020 04:29 AM PDT
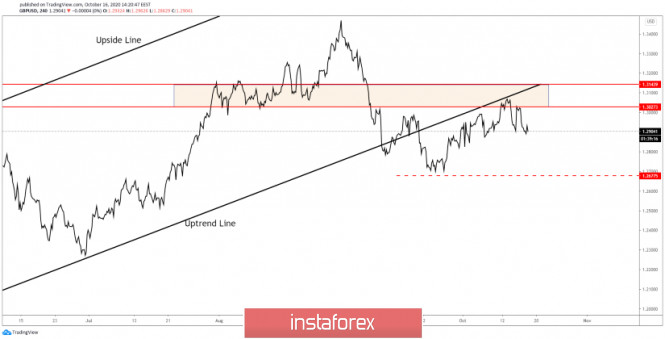
GBP/USD has escaped from a major ascending channel. The breakdown below the uptrend line signals that we may have a down reversal. As you can see, the pair has come back higher trying to retest the broken uptrend line and the 1.3027 - 1.3143 resistance area. Finally, the price was rejected from the resistance area, so now it could drop deeper again. The selling pressure is high as long it stays under the 1.3027 level.
I believe that a drop somewhere below 1.2840 signals a larger drop. So, we may have a selling opportunity below this level. The downside scenario could be invalidated only by another higher high, a jump above the 1.3082 level. The material has been provided by InstaForex Company - www.instaforex.com |
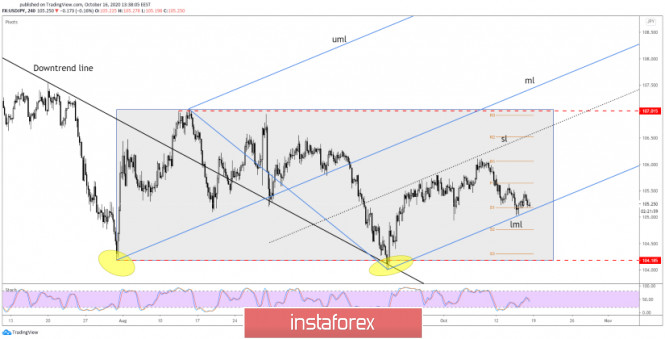
| Posted: 16 Oct 2020 04:14 AM PDT USD/JPY flirts with a support area, so, technically, the pair could give birth to upside momentum. Personally, I believe that the next few hours are crucial as the US is to release high impact data. The US retails sales are expected to increase by 0.7% in September, versus 0.6% in August, while the Core Retail Sales could increase by 0.4%. The Industrial Production could register a 0.6% growth, the Capacity Utilization Rate could increase from 71.4% to 72.1%, while the Business Inventories could grow by 0.3%.
Better than expected US data could send USD/JPY higher again after the current retreat. USD needs a bullish spark to be able to take the lead again. A disappointment today could weaken the dollar which could lose significant ground versus its rivals and not only against the Japanese Yen. The lower median line (lml) of the ascending pitchfork represents strong dynamic support, a critical downside obstacle, so false breakdown through it or a major bullish engulfing could suggest buying. A valid breakdown through the lower median line (lml) and under the S1 (105.18) signals a drop towards the 104.18 area.
The US economic figures will bring high volatility, so maybe you should way away till the markets will calm down. As I've said, a false breakdown with great separation below the lower median line (lml) or a major bullish engulfing printed on this dynamic support should offer is a long opportunity. Also, a valid breakout above the PP (105.64) could signal upside continuation. A valid breakdown below the lower median line (lml), drop, retest, and stabilization under it suggests selling. This scenario could be caused by poor US data. The material has been provided by InstaForex Company - www.instaforex.com |
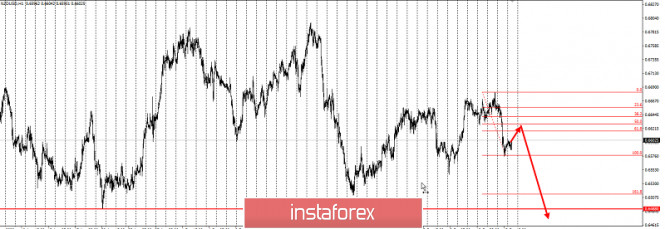
| Trading idea for the NZD/USD pair Posted: 16 Oct 2020 03:46 AM PDT
A strong bearish momentum went through the kiwi yesterday, following the downward scenario predicted on October 14 . Thus, as of today, the pair has already moved down 70 pips, almost reaching the target price levels set earlier.
In fact, the recent price movements have formed a three-wave pattern, with which wave A is the strong downward thrust yesterday. To keep the quote moving in the direction of the target price levels, set short positions along the 50% retracement zone. However, such a strategy will be irrelevant once the quote reaches the level of 0.6660. Aside from that, the risk should also be monitored to avoid any losses. Remember that trading in this financial market is precarious, but also very profitable as long as you use the right approach. In this case, the strategy used is Price Action and Stop Hunting. Good luck! The material has been provided by InstaForex Company - www.instaforex.com |


| You are subscribed to email updates from Forex analysis review. To stop receiving these emails, you may unsubscribe now. | Email delivery powered by Google |
| Google, 1600 Amphitheatre Parkway, Mountain View, CA 94043, United States | |
No comments:
Post a Comment