
Forex analysis review |
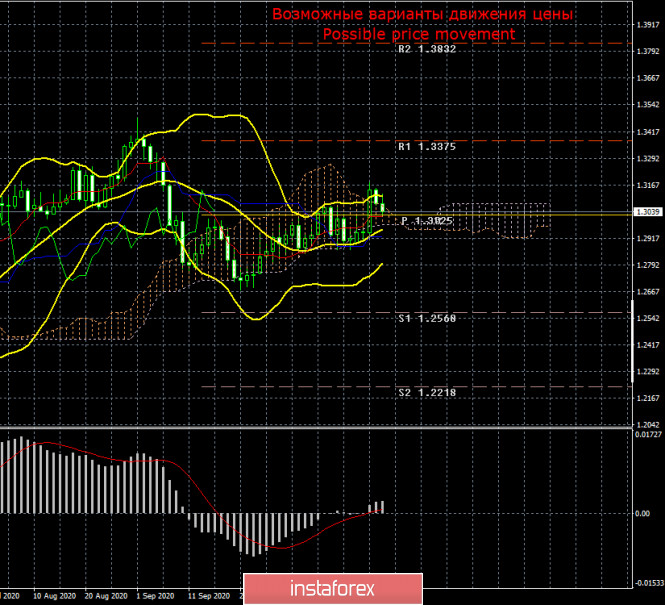
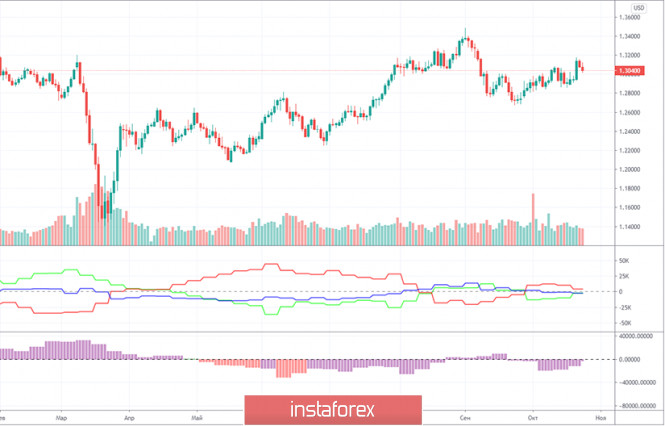
| Posted: 24 Oct 2020 10:06 AM PDT GBP/USD 24H Unlike EUR/USD, GBP/USD is not trading in the flat market. Moreover, the sterling seems to take a nosedive in the nearest days. Following a slump on September 1, the currency pair has rebounded exactly 61.8%. To sum it up, the odds are that GBP/USD will resume a downtrend in the short term. Oddly enough, the reinforcement of the sterling in the past few weeks confounds the fundamental background. The UK is dealing with challenging foreign politics, economic picture, and the COVID-19 resurgence. So, the logical development would be a slump of GBP/USD. COT report A new COT (Commitments of traders report) showed that non-commercial traders were speculating the sterling robustly on the week of October 13-19. At the same time, several COT reports baffled market sentiment on GBP. Last week, the non-commercial group opened 4,485 buy contracts and closed 4,072 sell contracts. Thus, the net position of professional traders instantly surged by 8,500 contracts that proves active trading activity. The problem is that over a few past weeks, non-commercial traders increased the buy net position, thus boosting bullish sentiment, but over a few weeks before that they had decreased the net position. In other words, professional traders have been puzzled about a trajectory of GBP/USD for a few months. No wonder, they are at a loss amid the fundamental background. Last week, the pound sterling dropped almost 110 pips. Net positions of both commercial and non-commercial traders equal nearly zero at present. It means that both groups of market players keep open roughly the same number of buy and sell contracts. Of course, such data of COT reports confuses traders with both short- and long-term forecasts. The fundamental background of GBP/USD is determined by few factors: Brexit, the talks between London and Brussels on the trade deal, and the presidential election in the US. So, reinforcement of the sterling can be explained by the lack of negative news from the UK. Nevertheless, the overall picture in Great Britain remains challenging. In essence, Brussels and London could announce the termination of the talks because the gridlock cannot be solved. Personally, I reckon that the talks are likely to continue until the sides come to some agreement, though it might take much longer time than expected. Meanwhile, the deadline for the trade deal is set for December 31. Obviously, the sides will hardly make the deal until December 31. Everyone understands it. So, from my viewpoint, the pound sterling will inevitably tumble again sooner or later. Nowadays, the sterling is keeping afloat amid political jitters in the US and uncertain outcome of the election. However, after the election (I'd like to believe that uncertainty will not linger for weeks or months), the situation will clear up, thus releasing the pressure from dollar bulls. Once, I told you the list of factors why the pound sterling is doomed to failure next year. Therefore, the sterling is expected to follow the long-term downtrend that began back in 2007 and resurfaced in 2014. Trading plan for week of October 26-30 1)The buyers are exhausting strength to push the pair up. So, GBP/USD could reverse downwards in the nearest future. It is still possible to buy the pair on minor time frames as long as the price is staying above the crucial Kijun-sen line. Please beware that the current fundamental background makes any long bets too risky. 2)The sellers have more power to insist on the bearish trend. They need to push the price below the Senkou Span B line (1.2980) and the Kijun-sen line (1.2923) on the 24-hour time frame. In this case, the likelihood of a new nosedive will increase notably. The first target is seen at 1.2568. Notes for the pictures The resistance/support levels are the target levels when opening long/short positions. You can place take profit levels next to them. Indicators Ishimoku, Bollinger bands, MACD Areas of support and resistance are the ones from where the price has rebounded or has been rejected a few times. Indicator 1 in the COT charts is a size of net positions for each category of traders. Indicator 2 in the COT charts is a size of net positions for the non-commercial group. The material has been provided by InstaForex Company - www.instaforex.com |
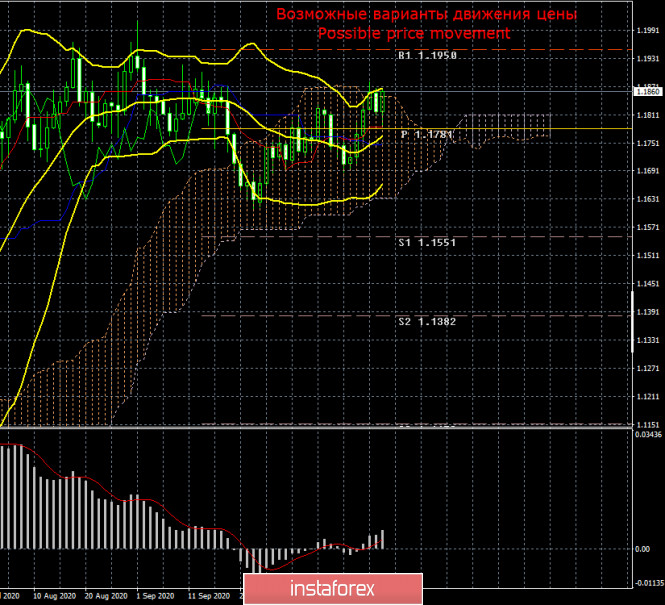
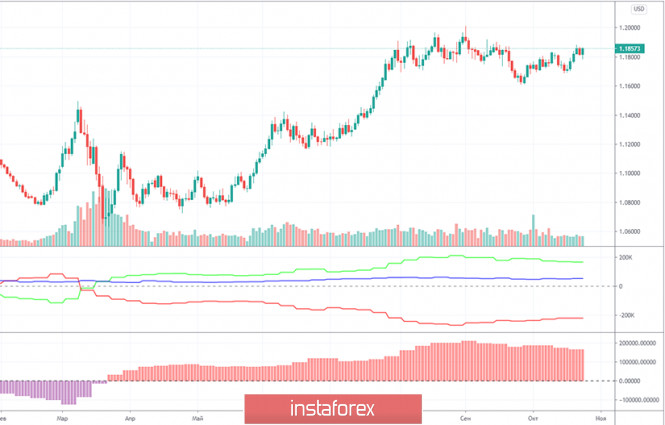
| Posted: 24 Oct 2020 08:42 AM PDT EUR/USD 24H In my daily reports, I turned your attention to the fact that EUR/USD had been trading mainly sideways for a few straight weeks and even months. This dynamic is clearly displayed on the daily chart. Earlier, the pair was trapped inside a range of 1.17-1.19. At present, the trading range is not clearly pinpointed. EUR/USD is trading roughly inside the corridor of 1.1620 to 1.1940. So, the channel's range is 320 pips. At the same time, the dynamic over the past few months cannot be defined as a pure flat market. Actually, perfect trends are not a common situation on Forex. Thus, the Ishimoku indicator is of little importance now. The indicator generates fake signals in the flat market. So, traders should wait until the price gets out of the trading range. Then, we will be able to develop a new trading strategy. COT report Over the previous trading week (October 13-19), EUR/USD shed nearly 40 pips. On the whole, the currency pair has not logged any serious gyrations. Hence, data of any COT report could be used only for a long-term outlook. A new COT report reveals minimal changes in sentiment of professional traders. Retail traders, who make up the bulk of traders on Forex, opened 1,081 buy contracts and 673 sell contracts. In the previous 2 weeks, the non-commercial group decreased its net positions that could mean the completion of the uptrend. Nevertheless, the latest COT report does not suggest any conclusions. In fact, there is no change in the market. Non-commercial traders opened almost 300,000 contracts on EUR/USD in total. So, opening or closing 1,000-2,000 contracts is just a tiny change. At the same time, the lines plotting net positions of the commercial and non-commercial groups are still getting slightly narrower (this is the upper indicator plotted by the green and red lines). The pair is still trading sideways. I'm keeping the same viewpoint. The uptrend is either over or is about to complete. The swing high of 1.12 could remain the strongest level of the uptrend. What about the fundamental background of the past trading week? First, the economic calendar did not contain a lot of data. Second, market participants took little notice of the statistics. Third, investors were riveted to politics and the COVID-19 developments, but neglected economic data. Fourth, no crucial events took place last week. Although EUR appreciated 140 pips on the last trading week, this was for no fundamental reason, I guess. Nothing has changed in the US either for the better or for the worse: neither the political nor economic nor coronavirus situation. The US dollar's dynamic does not depend on fundamental factors. On the euro front, investors are alarmed by soaring COVID-19 cases in the EU. If traders had responded to this, it would have been logical to expect the EUR's fall. In the US, the final debates between Donald Trump and Joe Biden were held on Thursday. Traders did not make any discoveries. Each of the candidates remained faithful to their programs and election pledges unveiled in recent months. Nearly two weeks are left before the presidential vote. So, EUR/USD is set to trade in the flat market ahead of this crucial event. As soon as the winner is announced, the currency pair will develop a trend. The thing is that the exact number of votes could be overshadowed by court proceedings which could take a few weeks or even months ... Trading plan for week of October 26-30 1)Bearing in mind that EUR/USD has been trapped in the flat market, it is highly recommended to trade using charts with shorter time frames like a 1H or 4H time frames. Currently, EUR is carrying on with its advance, so it is likely to climb as high as 1.1900 and even try to test the previous swing high of 1.2011. I don't foresee the price higher than these levels. 2)Before we have another buying opportunity, it would be better to wait until EUR/USD fixes below that trading range mentioned in the first paragraph. The lines of the Ishimoku indicator are of little importance now. It is possible to sell the pair on shorter time frames in the flat market. Make sure you sell the pair at levels close to the upper border of the trading range bearing in mind a decline to the lower border. Notes for the pictures The resistance/support levels are the target levels when opening long/short positions. You can place take profit levels next to them. Indicators Ishimoku, Bollinger bands, MACD Areas of support and resistance are the ones from where the price has rebounded or has been rejected a few times. Indicator 1 in the COT charts is a size of net positions for each category of traders. Indicator 2 in the COT charts is a size of net positions for the non-commercial group. The material has been provided by InstaForex Company - www.instaforex.com |
| You are subscribed to email updates from Forex analysis review. To stop receiving these emails, you may unsubscribe now. | Email delivery powered by Google |
| Google, 1600 Amphitheatre Parkway, Mountain View, CA 94043, United States | |
No comments:
Post a Comment