
Forex analysis review |
- EUR / USD fell 0.6% reaching monthly lows at 1.1655
- October 30, 2020 : GBP/USD Intraday technical analysis and trade recommendations.
- BTC analysis for October 30,.2020 - Inside day pattern active and potential for the breakout.
- October 30, 2020 : EUR/USD Intraday technical analysis and trade recommendations.
- Analysis of Gold for October 30,.2020 - Potential for drop towards the level at $1.848
- October 30, 2020 : EUR/USD daily technical review and trade recommendations.
- EUR/USD analysis for October 30 2020 -Downside target reached at 1.1690 and there is potential for next downside target test
- Evening review of EURUSD on October 30, 2020
- British pound awaits BoE policy meeting
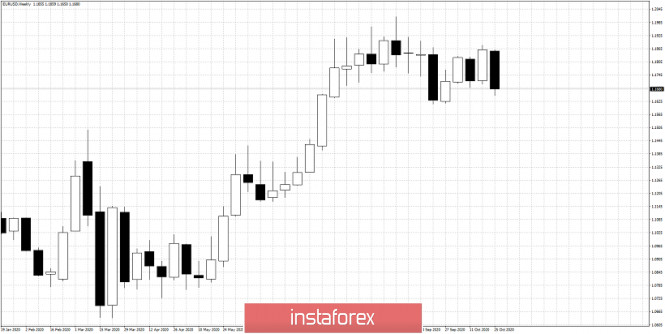
- Weekly analysis on EURUSD
- Weekly analysis on Gold
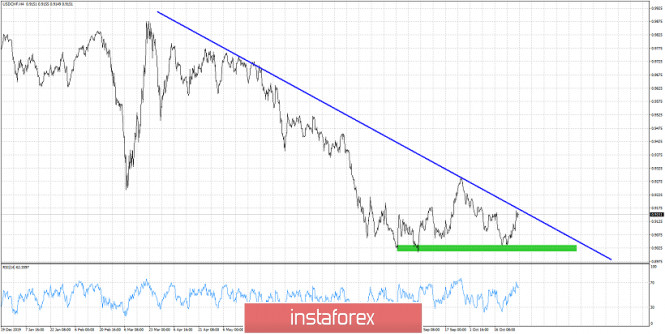
- USDCHF approaches key resistance trend line after double bottom
- Analysis for GBP/USD on October 30. Markets continue to wait for information about the negotiations between the EU and the
- Analysis for EUR/USD on October 30. Reports on GDP and inflation in the Eurozone may cause a new fall in the European currency
- Gold prospects for November and December 2020
- APX exhibited negative dynamics with no apparent reason
- Apple fell $ 100 billion due to lower iPhone sales
- Second wave of COVID-19 put EUR/USD to lowest level since end of September
- What are the results of the EU's virtual summit?
- Spring oil prices collapse happens again
- Trading recommendations for the GBP/USD pair on October 30
- October marked sharp surges and swings in the oil market
- Trading idea for the USD/JPY pair
- Analysis and Trading Ideas for USD / CHF from October 30, 2020
- Forex forecast 10/30/2020 from Sebastian Seliga
| EUR / USD fell 0.6% reaching monthly lows at 1.1655 Posted: 30 Oct 2020 09:00 AM PDT
Since the beginning of the week, the euro has depreciated against the US dollar by more than 1.5%. The EUR / USD pair fell 0.6% on Thursday, reaching monthly lows around 1.1655. Meanwhile, the greenback was supported by positive data on US GDP for the third quarter. According to the data, in July-September, the US economy expanded by 33.1% at an annualized rate. In addition, the number of initial applications for unemployment benefits in the country fell by 40,000 last week, which left it at 751,000. The demand for the dollar persists amid growing concerns of the possible backfire of the US presidential elections. Euro, on the other hand, is under pressure amid the crisis with the coronavirus outbreaks in the Eurozone. Due to this, several countries have reimplemented repeated lockdowns which may undermine the region's fragile economic recovery. At the moment, the outlook remains so bleak that the ECB does not rule out a repeat of the recession in the fourth quarter.
Following the October meeting, the European Central Bank left the policy unchanged but promised to take action at the next meeting in December, when new macroeconomic forecasts will be published. According to experts, the ECB will at least have to expand its asset buyback and emergency programs during the pandemic, as well as adjust the terms of the long-term refinancing program (TLTRO). "The fact that the ECB will increase its balance sheet by the end of the year is beyond doubt. However, the main question is whether the expansion of QE will be enough to affect the economy, or whether the regulator will have to come up with something new at the limit of its powers and even beyond, for example, by introducing direct business lending programs," Saxo Bank said. "We expect the ECB to expand its pandemic emergency procurement program by € 500 billion and announce more targeted long-term refinancing operations. However, taking into account recent developments regarding weak inflation and increased restrictions due to COVID-19, there may be an orientation towards an even larger mitigation package," said analysts from Nordea Bank. Commerzbank experts believe that, among other measures, the ECB's deposit rate is likely to decrease by 10 basis points, to -0.6%. They predict that the EUR / USD pair will decline to 1.15 by the end of the year. "This assumption is based on optimism that the debate on the ECB's effective lower rate will not be too intense, but investors should be prepared for a more serious weakening of the euro," experts said. The material has been provided by InstaForex Company - www.instaforex.com |
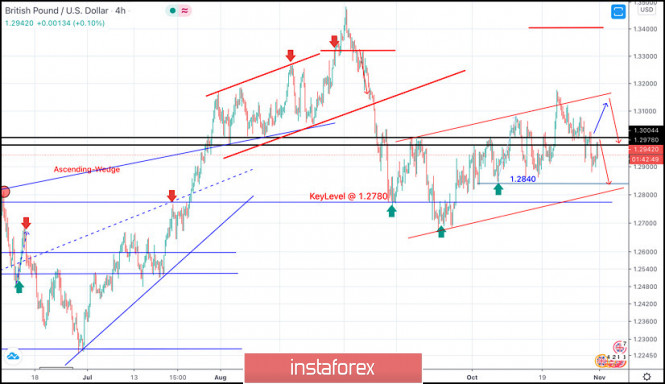
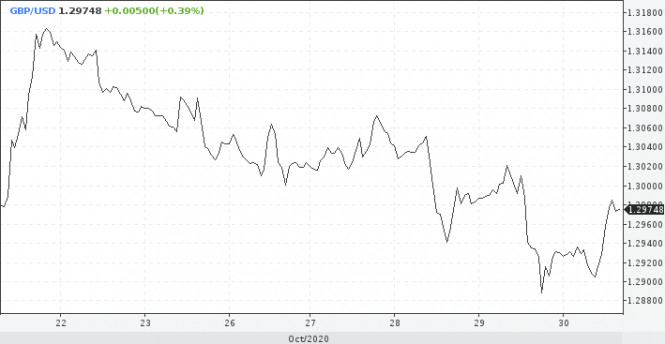
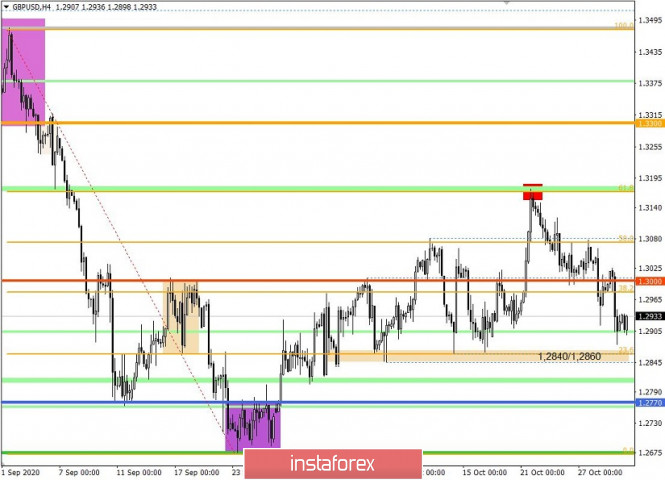
| October 30, 2020 : GBP/USD Intraday technical analysis and trade recommendations. Posted: 30 Oct 2020 08:26 AM PDT
Short-term bearish outlook was expected especially after bearish persistence was achieved below the lower limit of the newly-established ascending-channel around 1.3100. A quick bearish decline took place towards 1.2780 and 1.2700 where considerable bullish rejection brought the pair back towards 1.3000 and 1.3100 during the past few weeks. The price zone of 1.3100-1.3150 (the depicted channel upper limit) constituted an Intraday Key-Zone to offering considerable bearish pressure on the GBPUSD Pair. Bullish Persistence above the mentioned price zone of 1.3100-1.3150 was supposed to allow bullish pullback to pursue towards 1.3400 as a final projection target for the suggested bullish pattern. However, the GBPUSD pair failed to do so, Instead, another bearish movement is probably targeting the price level of 1.2840 where bullish SUPPORT will probably exist. On the other hand, please note that any bullish breakout above 1.3000 will probably enable further bullish advancement towards 1.3150-1.3170 to gather sufficient bearish pressure The material has been provided by InstaForex Company - www.instaforex.com |
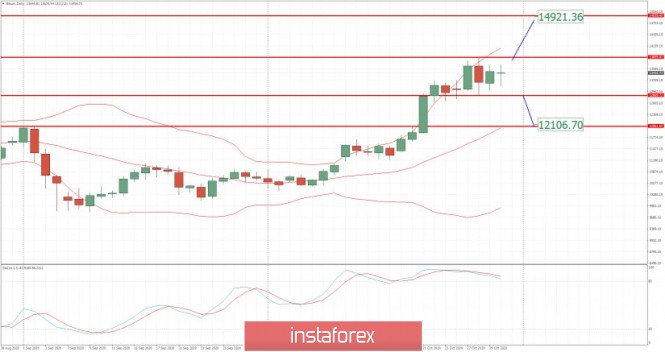
| BTC analysis for October 30,.2020 - Inside day pattern active and potential for the breakout. Posted: 30 Oct 2020 08:16 AM PDT Further Development
Analyzing the current trading chart of BTC, I found that BTC is still trading in sideways mode and the breakout of the balance would confirm further direction. The breakout of balance resistance at $13,900 will confirm test of $14,900 The breakout of the balance support at $12,700 will confirm test of $12,100 Watch for the breakout to confirm further direction The overall trend is still bullish... Key Levels: Resistance: $$13,900 Support level: $12,700 The material has been provided by InstaForex Company - www.instaforex.com |
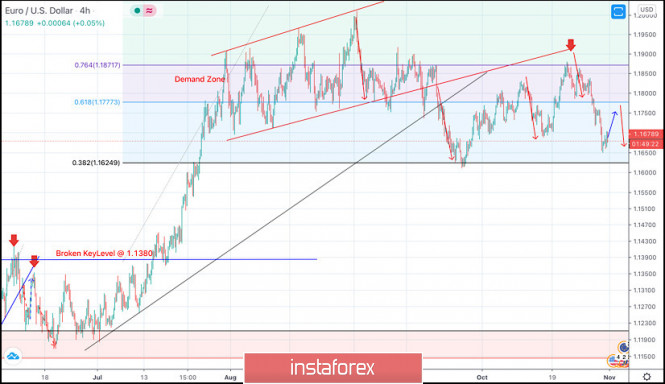
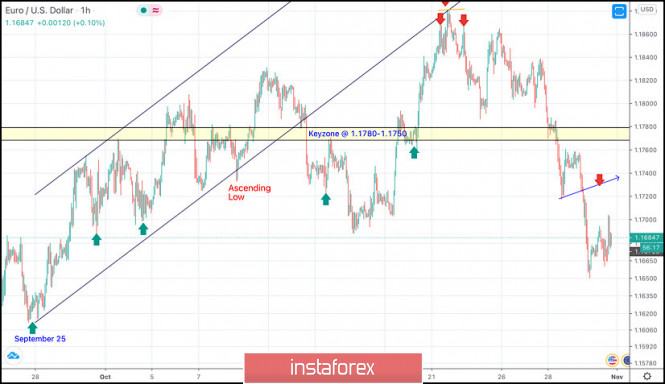
| October 30, 2020 : EUR/USD Intraday technical analysis and trade recommendations. Posted: 30 Oct 2020 08:14 AM PDT
In July, the EURUSD pair has failed to maintain bearish momentum strong enough to move below 1.1150 (consolidation range lower zone). Instead, bullish breakout above 1.1380-1.1400 has lead to a quick bullish spike directly towards 1.1750 which failed to offer sufficient bearish pressure as well. Bullish persistence above 1.1700 - 1.1760 favored further bullish advancement towards 1.1975 - 1.2000 ( the upper limit of the technical channel ) which constituted a Solid SUPPLY-Zone offering bearish pressure. Moreover, Intraday traders should have noticed the recent bearish closure below 1.1700. This indicates bearish domination on the short-term. On the other hand, the EURUSD pair has failed to maintain sufficient bearish momentum below 1.1750. Instead, another bullish breakout was being demonstrated towards 1.1870 which corresponds to 76% Fibonacci Level. As mentioned in previous articles, the price zone of 1.1870-1.1900 stood as a solid SUPPLY Zone corresponding to the backside of the broken channel. Intraday Trend-Traders could have considered the recent bearish H4 candlestick closure below 1.1770 as a valid short-term SELL Signal with bearish targets located around 1.1700 and 1.1630. Any bullish pullback towards the price zone of 1.1770 should be considered for signs of bearish rejection and a valid SELL Entry. S/L should be placed just above 1.1810 The material has been provided by InstaForex Company - www.instaforex.com |
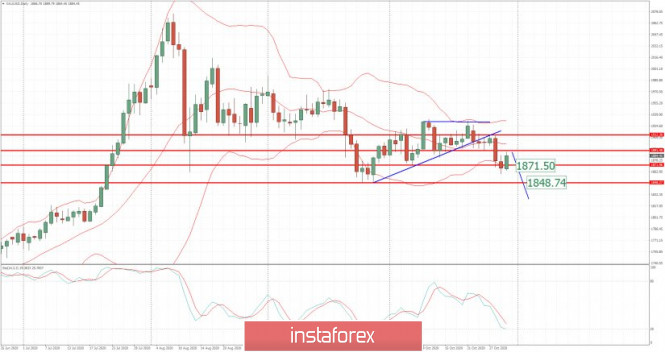
| Analysis of Gold for October 30,.2020 - Potential for drop towards the level at $1.848 Posted: 30 Oct 2020 08:12 AM PDT Fed lowers minimum loan size in Main St lending program to $100K from $250K Fed tweaks the program
The Fed will do anything to keep the market up.
Further Development
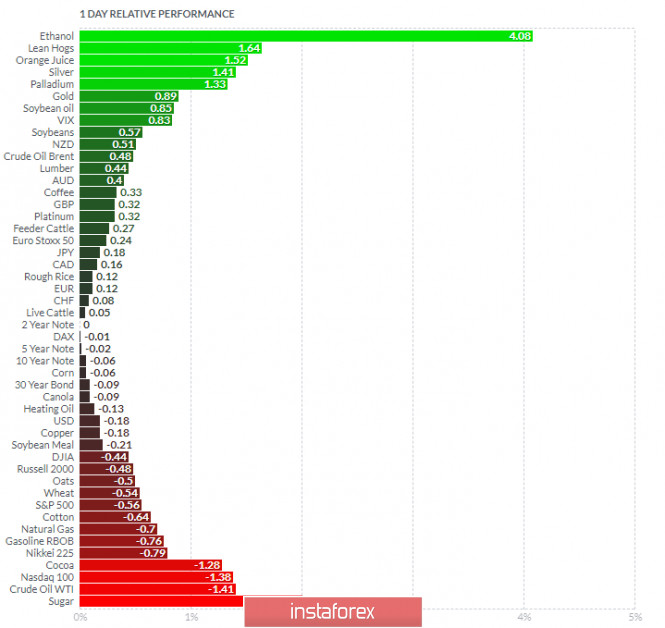
Analyzing the current trading chart of Gold, I found that Gold reached my frist downside target at $1,870 but that today we got reaction from buyers. 1-Day relative strength performance Finviz
Based on the graph above I found that on the top of the list we got VIX and Ethanol today and on the bottom Nasdaq100 and SP 500. Gold is positive today on the relative strength list but with potential for overbought zone on intraday. Key Levels: Resistance: $1,890 Support level: $1,848 The material has been provided by InstaForex Company - www.instaforex.com |
| October 30, 2020 : EUR/USD daily technical review and trade recommendations. Posted: 30 Oct 2020 08:09 AM PDT
Two weeks ago, temporary breakout above 1.1750 was demonstrated within the depicted ascending channel. This indicated high probability of bullish continuation towards 1.1880. However, downside pressure pushed the EUR/USD pair towards 1.1700 where significant BUYING Pressure Existed. This was followed by another quick upside movement towards 1.1880-1.1900. The price zone around 1.1880-1.1900 constituted a KEY Price-Zone as it corresponded to the backside of the depicted broken ascending channel where significant bearish pressure and a reversal Head & Shoulders pattern were demonstrated. Recently, Two opportunities for SELL Entries were offered upon the recent upside movement towards 1.1880-1.1900. Both positions are already running in profits. Early signs of bullish reversal are being demonstrated. Exit level should be lowered to 1.1750 to secure more profits. Trade Recommendations :- Currently, the price zone of 1.1740-1.1780 stands as a significant Resistance-Zone to be watched during any upcoming upside pullback for a valid SELL Position. Initial bearish target would be located around 1.1720 and 1.1690. The material has been provided by InstaForex Company - www.instaforex.com |
| Posted: 30 Oct 2020 08:03 AM PDT PEC October oil output rose on Libyan supply
This whole paradigm underscores the tough situation that OPEC and the world oil market is in. OPEC is cutting a bit more by Libya will bring another 600-800kbpd online before year-end. Libya is not bound by the OPEC+ agreement because it had dropped production due to a civil war. Further Development
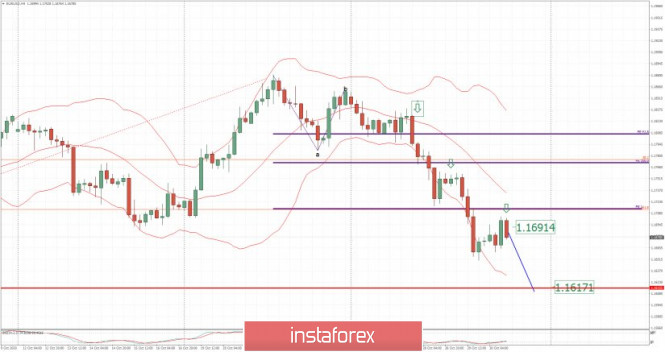
Analyzing the current trading chart of EUR/USD, I found that EUR reached our downside target at 1,1690 and that is heading for the test of the next downward target at 1,1615. My advice is still to watch for selling opportunities on the rallies with the main downside target at 1,1615 (Daily pivot low). The downside pressure is still very strong and selling opportunities are preferable in this condition... 1-Day relative strength performance Finviz
Based on the graph above I found that on the top of the list we got VIX and Ethanol today and on the bottom Nasdaq100 and SP 500. Key Levels: Resistance: 1,1688 Support level: 1,1615 The material has been provided by InstaForex Company - www.instaforex.com |
| Evening review of EURUSD on October 30, 2020 Posted: 30 Oct 2020 07:56 AM PDT
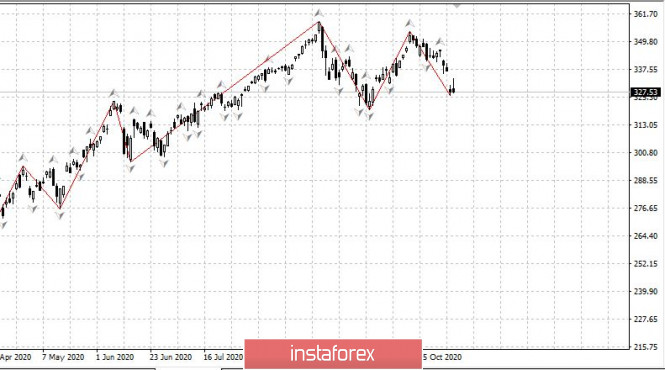
S&P 500 one day before the opening As the chart suggests, the US market does not exhibit positive dynamics despite the strong data on the economy. The anticipation of Biden's victory in the election doesn't seem to be in the favor of the market.
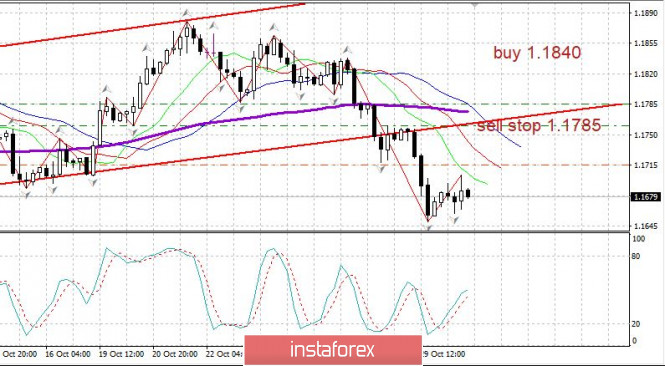
EURUSD: Euro stopped to decline. You may hold sales from 1.1785, stop, and upside reversal from 1.1760. Expect strong resistance upon correction at 1.1645. Decisions will be made upon the closing of the day and this week's trading. The material has been provided by InstaForex Company - www.instaforex.com |
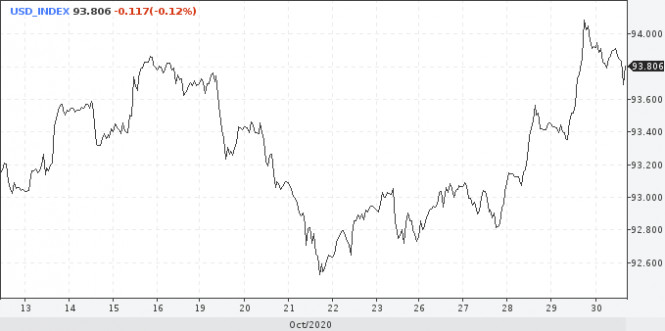
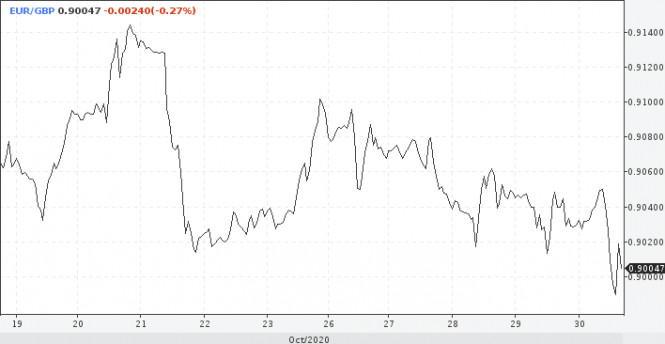
| British pound awaits BoE policy meeting Posted: 30 Oct 2020 07:52 AM PDT Investors are still focused on the spread of the coronavirus pandemic. Global markets are declining, while US stock indices are trading in the red. Recently, the coronavirus infection rate in the US has hit new records. Thus, in the coming days, the number of infected people may reach 100,000. At least, there are no plans so far to implement a new lockdown in the country. Risk appetite remains low. At the same time, the US dollar is also showing negative dynamics, having slipped from yesterday's highs. The US dollar index is again trading below the key mark of 94. While the risk of new lockdown measures in Europe is still high, Brexit remains the main topic on the agenda. At the moment, the situation is developing against the British economy and the pound. Investors doubt the EU and the UK will reach a trade deal before the deadline which is due in December this year. The former Governor of the Bank of England has repeatedly said that leaving the EU without a deal would be an immediate shock for the UK economy. This means that the country's regulator may step in with certain actions aimed at supporting local businesses and the UK economy. Ahead of the BoE policy meeting, traders will be looking for more clues on what steps the British regulator can take. Next Thursday, November 5, the Bank of England is expected to ramp up its bond-buying program to 845 million pounds or cut the base interest rate. At the same time, the majority of market players are skeptical about a possible change in monetary policy at the November meeting. According to their forecasts, the regulator will refrain from such measures. The pound sterling is likely to remain under pressure until the BoE meeting takes place, which means that the EUR/GBP pair will not decline further. On Friday, the pair approached the level of 0.9000, hitting the key support of 0.8990 at some point. Meanwhile, GBP/USD continues to develop an upward correction. However, at this stage, the pair is unlikely to change the trend, and the price may resume its downtrend. In this case, its first target will be found at the level of 1.2835. After testing this level, the pound may rebound and continue to move further within the uptrend until it hits the resistance at 1.3070. |
| Posted: 30 Oct 2020 07:43 AM PDT EURUSD is trading near the weekly lows. Price has broken below the lows of the previous three weeks and this is a bearish sign. Price got rejected at the 1.19-1.1850 resistance and bulls have failed to hold price above 1.17.
|
| Posted: 30 Oct 2020 07:38 AM PDT Gold price ends this week with negative performance relative to last week. Price has made a low near the major support of $1,850. The low at $1,859 we saw this week is very important for what could follow. Breaking below it will open the way for a move towards $1,800 which is our primary scenario since price got rejected again at the major resistance trend line.
Price is about to close below the lows of the previous two weeks. So far price action suggests that bulls are not strong enough to break above red resistance trend line and a new wave of selling will follow, putting pressure on price and pushing it lower towards $1,800. This week's high was at $1,910. Bulls need to recapture this level but the most important level is to break above last week's high at $1,931. Only then bulls will take control of the trend. The material has been provided by InstaForex Company - www.instaforex.com |
| USDCHF approaches key resistance trend line after double bottom Posted: 30 Oct 2020 07:34 AM PDT Support at 0.9025-0.9050 has held and USDCHF formed a double bottom. Price has now reached important resistance levels and a rejection here will open the way for another pull back towards 0.9025-0.9050.
Green rectangle - support area Blue line -resistance trend line USDCHF so far has touched the blue downward sloping resistance trend line more than three times. The last time was at 0.93 and a decline to 0.9050 followed. Price is now testing this resistance again. Resistance is now at 0.9175. A rejection here is highly likely. Short-term aggressive traders will look to go short with stops above 0.9220. A rejection here will increase chances of a pull back towards green rectangle area. The material has been provided by InstaForex Company - www.instaforex.com |
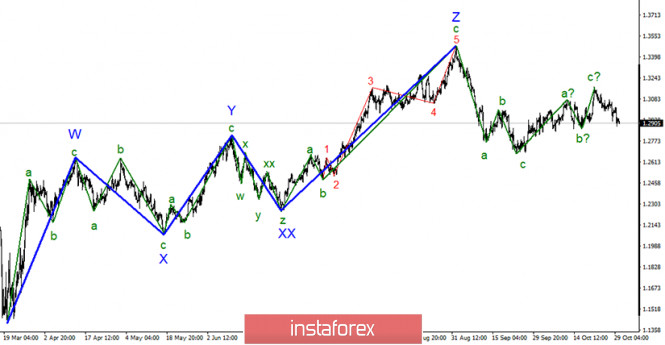
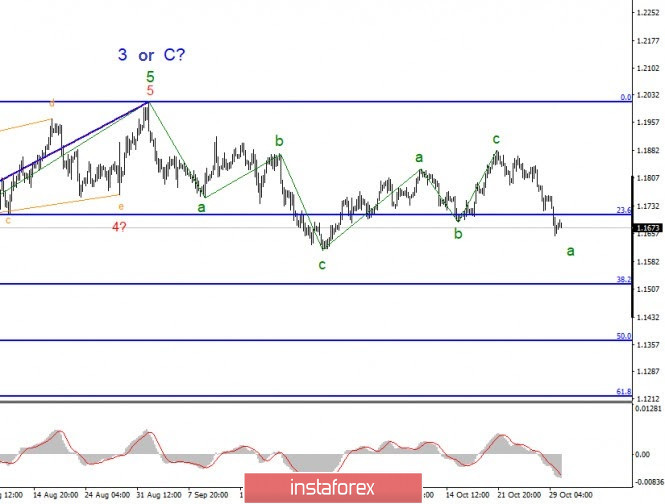
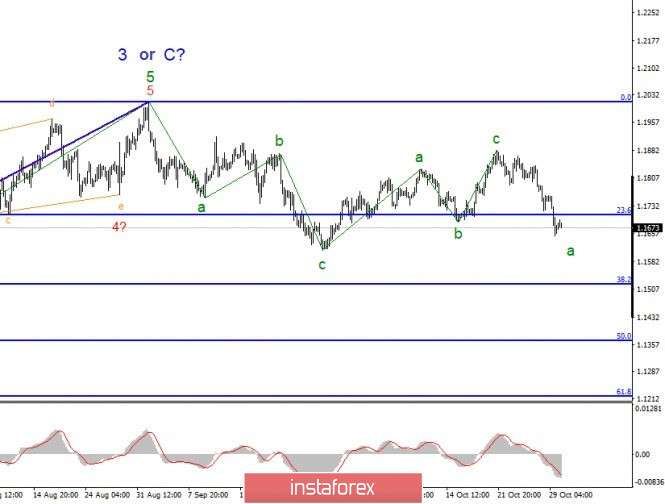
| Posted: 30 Oct 2020 07:26 AM PDT In most global terms, the construction of the expected new upward section of the trend continues. The internal wave layout continues to get confused, as the third wave takes on a rather non-standard appearance, and under certain layouts, it may even be completed. Thus, the wave marking of this instrument becomes similar to the wave marking of the EUR/USD instrument. Starting from September 1, both can have two three-wave structures built, after which the construction of a new downward structure, also three-wave, can begin. The wave markup on the lower chart does not look too convincing and clear. The rising wave 3 or C looks as if it has already completed its construction or, on the contrary, will take a very extended form. At the same time, an unsuccessful attempt to break through the 38.2% Fibonacci level suggests that the increase in the instrument's quotes will resume. The entire section of the trend that starts on September 1 can take the form a-b-c. Thus, you need to be prepared for the complexity of the wave structure. There is still little good news for the British currency. More precisely, there is no news for the pound right now. Negotiations in London seem to be continuing, while markets continue to wait for information. The British pound has fallen slightly in the last few days, which does not correspond to the current wave marking, but it can easily jump up by 100 or 200 points if there is real progress in the negotiations. Thus, now we can conclude that the markets are just waiting for information and that's it. Today, there were no important economic reports in either the UK or America. Therefore, the markets spent most of the day trading fairly calmly with a slight upward bias. Now I hope for the weekend. On the fact that on Saturday or Sunday there will be information from London. From the point of view of wave marking, there must be progress in the negotiations. If not, the demand for the British pound will fall again, and the instrument's quotes may update the minimum of wave 2 or b, which will complicate the entire wave picture. Thus, the outcome of the negotiations depends not only on the fate of the pound but also on the wave pattern of the instrument. General conclusions and recommendations: The pound/dollar instrument has presumably completed the construction of a downward trend section. A successful attempt to break through the minimum of wave 2 or b will indicate that the markets are not ready for new purchases of the British, and the entire wave marking can be transformed into a more complex one. Thus, if the mark of 1.2860 is broken, the option of building an upward wave will be canceled. While this has not happened, the increase in quotes may still resume with targets located near the calculated marks of 1.3189 and 1.3480, which corresponds to 23.6% and 0.0% for Fibonacci. The material has been provided by InstaForex Company - www.instaforex.com |
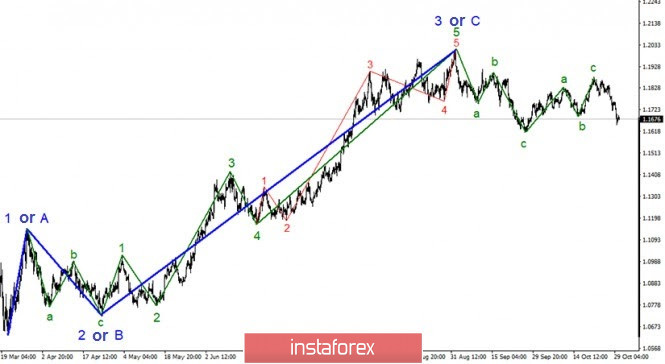
| Posted: 30 Oct 2020 07:26 AM PDT The wave marking of the EUR/USD instrument in global terms has undergone certain changes after the quotes fell below the minimum of wave b. Thus, the entire section of the trend, which begins on September 23, now looks three-wave and completed. If this is true, then the decline in the instrument's quotes will continue with targets located around 15 figures and below. Perhaps another three-wave structure will be built down. Smaller-scale wave markings also indicate certain changes. The option with a further increase in quotes is canceled at the moment, and now I expect to build at least three waves down. Accordingly, just a few days before the US election, the dollar, according to the wave markup, received good reasons to increase in pair with the euro. However, it should also be noted that the news background is superior to wave analysis. In other words, it is the news background that can easily cause a new increase in the instrument's quotes, and the wave markup will have to adjust. Yesterday, the next ECB meeting ended in the European Union. These meetings usually have a high value for the market, however, the European regulator did not intend to change rates or expand the quantitative stimulus program. The pandemic (second wave) in the European Union began relatively recently, but rapidly. Thus, the EU economy has not yet started to need help due to the new wave of the epidemic. However, the President of the ECB Christine Lagarde clearly outlined the prospects for the European economy in the coming months. Lagarde said that the economic recovery was not super-fast even in the summer when the situation with the coronavirus was relatively calm and stable, and now, when anti-records on the incidence are noted throughout the European Union, and many countries are re-introducing a "lockdown", the EU economy may begin to slow down again. It follows that the program to counter the economic consequences of the pandemic (PEPP) may be revised again in the near future, as well as the usual program of quantitative stimulation. What else is there to do? The quarantined economy will not recover, it will shrink. To prevent this from happening, or at least to smooth out the negative process, the ECB will have to pour new money into the economy. And the longer the complex epidemiological situation persists, the more cash injections will be required. Today, the European Union released a report on GDP for the third quarter, which was slightly better than the markets expected. Yesterday, for example, US GDP in the third quarter showed very strong growth, by 33.1% q/q. European GDP did not disappoint, but it did not overly please. The decline in the euro currency did not continue during the day. The European Union also released a report on inflation, which remained at -0.3% y/y. General conclusions and recommendations: The euro/dollar pair has presumably completed the construction of a three-wave upward trend section. Thus, at this time, I recommend selling the instrument with targets located near the 1.1519 mark, which corresponds to 38.2% Fibonacci, for each MACD signal "down", based on the construction of a downward wave a. The material has been provided by InstaForex Company - www.instaforex.com |
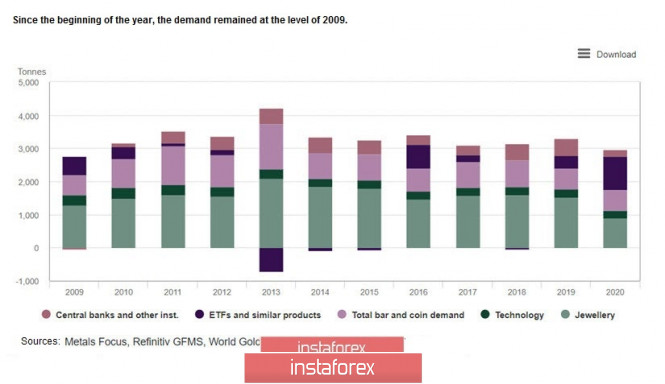
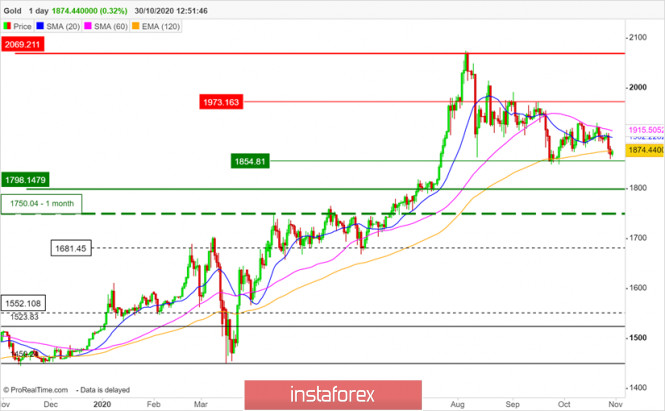
| Gold prospects for November and December 2020 Posted: 30 Oct 2020 07:21 AM PDT Gold has undoubtedly become the hit of 2020, and many investors have turned their attention to it not only as a safe haven asset but also as an asset that can generate profits by increasing its value. However, where there is massive psychosis in the markets, there is always the possibility of a sharp price movement in the opposite direction, and today I would like to cool off the hotheads who expect the precious metal to rise rapidly to new highs. Perhaps I will be wrong in my fears, moreover, for many years I have been a supporter of investing in gold, but a reasonable person is always prone to doubts, which makes his choice conscious and more balanced. Therefore, I decided to share my doubts in order to show the reverse side of the coin, and not only the one that blinds the eyes and fogs the mind with its brilliance. All the more so as new input from the World Gold Council brings a healthy dose of pessimism to the optimism in the precious metals markets, but let's start with it. Against the backdrop of widespread optimism about the prospects for gold prices, there are a number of significant negative aspects and factors affecting the gold price in this market that should be mentioned. As you know, price is a derivative of supply and demand, and the current rise in the price of gold on the market should theoretically be caused either by increased demand or lack of supply. However, is it really so? Figure 1: Chart of demand in the gold market from 2009 to 2020 As suggested in Figure 1, the demand for gold in 2020 is at its lowest level since 2009. In other words, buyers in their general mass now do not want to buy gold, which is associated with its high cost, as well as a drop in demand for jewelry, including primarily in India and China. Compared to that of 2019, in 2020, the demand for jewelry in India decreased by 48%, and in China by 25%. The demand for technological use of gold decreased by 6%. In the third quarter of 2020, central banks had negative purchases of gold. If it were not for the purchase of coins and bars by 49% and investments in exchange-traded funds ETF by 5%, which brought an overall increase of 21%, the demand in the gold market would have collapsed to the minimum values, but this did not happen thanks to investors who believed in gold. The increase in prices and the decline in supply also helped, which increased to -3% in the third quarter of 2019. However, as the global economy recovers, the supply of gold to the markets will increase. For example, Russia returned to the gold market, which provided the country with a greater inflow of foreign exchange from gold exports than from gas exports. The recovery in production at less profitable mines is accompanied by peaks in the price of gold not only in US dollars, but also in local currencies, which makes mining profitable where production would have been impossible at previous prices, but now it is quite profitable. As we can see from the data provided by the World Gold Council, the price increase was mainly due to the demand of American and European investors, as well as positioning in the US futures markets. However, as per my previous article published a week ago, the CME has significantly increased the margin for speculators who are a priori net buyers, literally forcing them to leave the market. According to the COT Traders' Commitment Report, as a result of the exchange's actions, long positions of speculators have decreased by more than a third since March 2020, while their total position is minimal, and short positions are maximum since summer 2019. Thus, based on the data on supply and demand, the following conclusions can be drawn: the recovery in demand for jewelry in India and China, which will occur as the economies of these countries recover, will be accompanied by an increase in supply from the mining industry. However, the position of American investors, who currently provide the main price driver, may change after the US elections, for example, due to the growth of the US dollar. Now, most forecasts assume that the stock market will decline, and gold will simultaneously serve as a safe-haven asset and as an inflation-defender asset. At the same time, the decline in stock markets is always accompanied by a contraction of liquidity, when the dollar rises in price in relation to all assets, including gold. Moreover, the period between the beginning of a decline and an increase in the price of gold can reach several quarters. However, even if we assume that the US stock market does not collapse, but remains in the range or even continues to grow, will gold become as desirable an asset for investors as it was in 2020? If American investors turn their backs on gold, it will simply collapse, and it will collapse quite deeply. On Friday, gold is above the substantial support of 1854, but it has already dipped to the half-year averages. On the one hand, this indicates the weakness of the market in the medium term, and on the other hand, it accurately describes the current situation (Fig. 2), which, in the event of a decline in the price of gold, suggests targets at $ 1750, $ 1680, and $ 1500 per troy ounce. To be honest, I don't think gold buyers who bought it at $ 2,000 would be happy that the price dropped to the 1,500 mark. Figure 2: Medium-term outlook for gold is negative If on top of everything else, the US dollar starts strengthening against a basket of foreign currencies and, first of all, against the euro on the market, then gold will begin to actively lose its price. Moreover, the strengthening of the dollar can occur not only in the event of a decline in stock markets but also in the event of their growth. The dollar and stock markets do not have a direct correlation. Here are just a few reasons why the dollar might rise as equity markets rise. The situation in the US is better in terms of interest rates than in Europe. The US economy is more adapted to the shock of the COVID-19 pandemic than the eurozone economy, which, in addition to the coronavirus pandemic, is experiencing a painful divorce from the UK. The dollar is also the dollar in Africa, and all other things being equal, investors will choose it. Why not assume in this regard that the dollar has the potential to strengthen by 10% against the euro? Summing up my reflections, I would especially like to draw the readers' attention to the fact that I am not calling for the complete liquidation of gold-bearing assets in portfolios, but talking about a possible scenario and a revision of views on gold as an asset that will always grow in price. I also draw the attention of traders to the possibility of selling gold in the medium term, but only if their trading systems generate appropriate signals. However, I remind you that selling against the current long-term trend is always an action against the expected value and often leads to losses, so be careful and make sure to follow the rules of capital management. The material has been provided by InstaForex Company - www.instaforex.com |
| APX exhibited negative dynamics with no apparent reason Posted: 30 Oct 2020 05:23 AM PDT
The Asia-Pacific Stock Exchanges (APX) continue with the negative dynamics on Friday morning. Major stock indexes are decreasing against the background of unresolved problems and difficulties that are predicted by experts in the future. At the moment, market participants are in no hurry to show excessive initiative in their work, as they await the US presidential elections. In addition, the very exciting issue of a new financial incentive program also remains unresolved, which also forces investors to conduct more restrained work. However, financial incentives are required not only for American citizens and enterprises; the European region also needs support measures due to the worsening epidemiological situation and the introduction of strict quarantine in a number of countries. In this regard, the ECB began to discuss possible adjustments to its instruments, but not earlier than December of this year. And the latter will be relevant only under certain conditions, namely, poor macroeconomic statistics and corresponding forecasts for the next year. Japan's Nikkei 225 index fell 1.32%. Note that the fall has continued for the fifth session in a row, which may ultimately cause the maximum decline in a week. Moreover, this weekly decline is likely to be larger in volume than the full month's decline. Despite this, the statistics on economic growth in the country seemed satisfactory. The unemployment rate in the first month of autumn remained at the same level as a month ago at 3%, which is the lowest value over the last two years. At the same time, experts said that the growth of the indicator would be inevitable to at least 3.1%. However, the total number of unemployed Japanese citizens increased by 0.5% and reached 2.06 million. Another extremely revealing indicator is the number of applicants per number of open vacancies. Minimal changes were recorded. There were 103 real vacancies per 100 applicants in September, whereas a month earlier there were 104. In this case, the figure is considered one of the lowest in the last seven years. Recall that during Thursday's meeting, the Bank of Japan did not begin to make changes in its monetary policy, leaving all interest rates at the same level. At the same time, the forecast for the country's economy for the next year was revised and adjusted downward. China's Shanghai Composite Index fell 0.5%. The Hong Kong Hang Seng Index supported the negative trend and declined 0.89%. As it became known, the Chinese government nevertheless put forward for consideration another long-term program for the development of the country's economy until 2035, as well as its medium-term analog for the next four years (from 2021 to 2025). The priority areas were the increase in domestic consumption, as well as the build-up of our own scientific and technical developments. South Korea's KOSPI index dropped 1.5%. The statistics also exhibited satisfactory data. The total volume of production of industrial goods in the first month of autumn increased immediately by 8% on a yearly basis. Recall that in the previous period, the indicator showed a decline of 2.6%. Analysts had expected growth, but not more than 1.7%. The level of retail sales in the country also increased by 4.4% in September, while earlier the growth was recorded by only 0.3%. Australia's S&P / ASX 200 also fell 0.55%. The material has been provided by InstaForex Company - www.instaforex.com |
| Apple fell $ 100 billion due to lower iPhone sales Posted: 30 Oct 2020 05:03 AM PDT
This significant decline in the market value of the company occurred after the release of financial statements and the decline in the value of securities by 5%. New smartphone sales were not reported for the fourth quarter due to their late launch. As a result, iPhone sales for this period in annual terms decreased by 20.7% and amounted to $ 26.4 billion. According to analysts' forecasts, the new iPhones with 5G technology will be among the top sellers in China. But in the fourth quarter, smartphone sales in this country fell 28.5% to $ 7.95 billion. There is also good news: the company's revenue was $ 64.7 billion, beating analysts' expectations ($ 64 billion). Sales of Mac computers grew by 29% year-on-year to $ 9 billion, iPads - by 46% ($ 6.8 billion). The company's services revenue increased by 16.3% in annual terms, amounting to $ 14.5 billion. The material has been provided by InstaForex Company - www.instaforex.com |
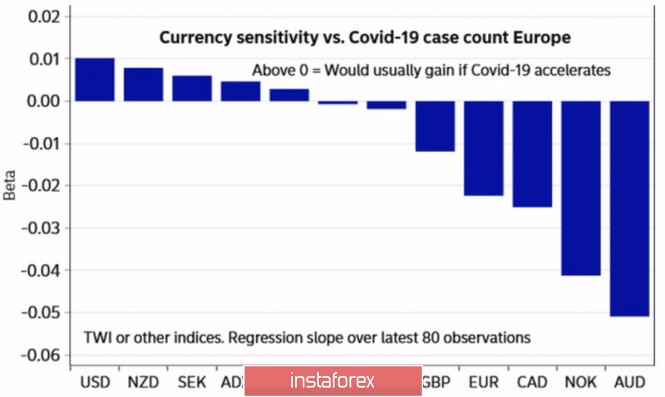
| Second wave of COVID-19 put EUR/USD to lowest level since end of September Posted: 30 Oct 2020 04:40 AM PDT The end of October was a real benefit for the US dollar. Despite the rise in the number of COVID-19 cases in the US to record highs and the probable loss of Donald Trump in the presidential election, the EUR / USD quotes fell to a monthly low. The second wave of the pandemic in Europe, the imposition of severe restrictions by Germany and France, as well as the ECB's hints of expanding monetary stimulus, played into the hands of the bears on the euro. The rise in the number of COVID-19 cases in the Eurozone put the US dollar in a good purchase position. On the contrary, currencies such as the euro, loonie, aussie, and the Norwegian krone were ignored. Reaction of G10 currencies to rising incidence of COVID-19 in Europe:
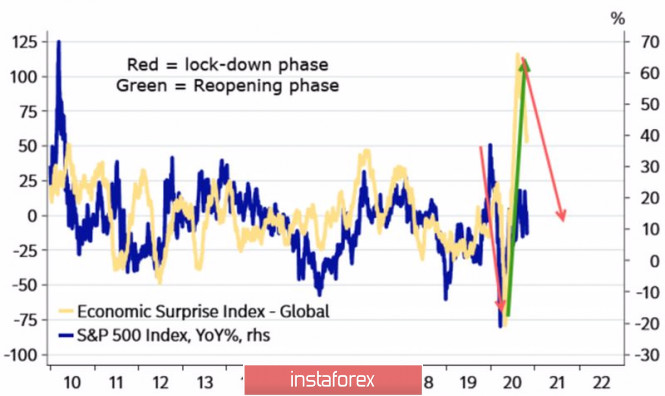
Most likely, the fourth quarter will be similar to the second, only the collapse of world stock indexes and the strengthening of the USD will not be as rapid as in the spring. I would like to believe that vaccines are on the way and the world will be able to cope with the pandemic. Currently, the global index of economic surprises is moving away from its extremes and heading downward, which creates preconditions for the development of a correctional movement in the S&P 500, a deterioration in risk appetite, and an increase in demand for safe-haven assets, particularly, the US dollar. Dynamics of S&P 500 indexes and economic surprises:
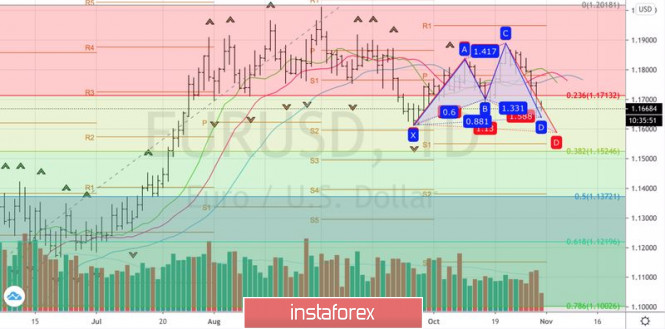
The ECB is forced to act against the background of repeated lockdowns, the associated risks of a significant slowdown in the eurozone's GDP, and the possibility of a double recession. At a press conference following the ECB's October meeting, Christine Lagarde said that there is no reason to doubt the expansion of the monetary stimulus in December. This circumstance allows investors to sell EUR / USD due to divergence in the monetary policy of the European Central Bank and the Fed. But there are also discrepancies in economic growth and in the number of COVID-19 cases. In this regard, the correction of the main currency pair looks logical. It is unlikely that Joe Biden's victory will lead to a restoration of the upward trend in the S&P 500: the market is too scared of repeating the history of the second quarter to buy shares at breakneck speed. It's another matter if the Fed adds monetary stimulus at its November 5 meeting, and news about vaccines and drugs for coronavirus will be positive. History repeats itself, and often rhymes, which allows us to count on the strengthening of the euro as the epidemiological situation develops. This takes time, therefore, at the moment, there is a high probability of a corrective movement in EUR / USD. Adjustments to this plan can be made by the US presidential elections and the FOMC meeting. Technically, the "Shark" pattern was formed on the daily chart of the main currency pair with targets at 88.6% and 113%. They correspond to the levels of 1.164 and 1.159. A pullback from supports with the closing of the test bar higher will become a signal for the formation of long positions. The euro may rise if Biden wins the November 3 elections, however, without overcoming the dynamic resistance in the form of a combination of moving averages, it is premature to expect the upward trend to recover. EUR / USD daily chart:
|
| What are the results of the EU's virtual summit? Posted: 30 Oct 2020 04:28 AM PDT
A virtual EU summit was held yesterday, whose goal was to unite heads of state and government to effectively contain the spread of the COVID-19 pandemic. European leaders discussed economic recovery after the coronavirus crisis. In this regard, the President of the European Council, Charles Michel, expressed hope for the speedy implementation of the stimulus package that was adopted in July this year. The European Commission discussed issues of economic recovery, highlighting an important factor – the unification of the positions of all EU countries. Mr. Michel said that gathering all EU states and governments into one team in order to recover the economies of the member states and maintain their social standards is the only way to deal with this crisis. At the same time, he noted that the current situation with the spread of COVID-19 has grown from alarming to threatening in a few weeks. To avoid tragedy, the EU member states agreed on a common policy to fight the virus, which involves the implementation of joint actions. The first thing that is planned to be implemented is the exchange of complete and accurate data using the platform of the European Center for Disease Control (ECDC). This approach is intended to improve the management of the actions of the EU members, as well as to facilitate the timely compensation of missing materials and equipment. The heads of countries also noted the need to exchange experience and analysis results. It was decided to create a special platform for communication, exchange of views and consultations of high-level specialists, as well as the governments of the EU member states. However, mass testing is still a crucial factor in preventing the spread of the virus. An important role is assigned to rapid tests for antigens. It will be mandatory for every resident of the EU countries to be tested in the near future. Moreover, it is planned to do contract tracing of people using a special portal for communication of mobile applications and their interoperability. It is clear that the coverage of these applications is clearly insufficient today. Therefore, the heads of the EU are going to urge their citizens to actively download these applications to their mobile phones. At the same time, passenger localization tracking forms will also eventually be compatible with these applications. Perhaps, without such applications, it will be unlikely to use all the benefits of civilization that are still available in the near future. Time will tell how true this assumption is. However, it is worth recognizing that the population will still have to get used to controlling their lives. Lastly, widespread vaccination is considered to be the main factor to stop COVID-19 from spreading. This will have three priorities. The first of them means the early approval of vaccines, but with the obligatory consideration of safety guarantees. In fact, the European Medicines Agency is already testing the proposed vaccines for safety and effectiveness. The second priority is the equitable distribution of vaccines. This means that all EU countries will receive the right amount of vaccines for their population. The developed vaccines will be delivered to countries simultaneously and under the same conditions. At the same time, the European Commission intends to check all vaccination plans prepared by the EU member states. Unfortunately, it is quite difficult to predict what will happen to the pandemic in the future, how the virus will behave and what damage will be done to the economies of countries and the population of the world. And even though we are talking only about the countries of the European Union, it should be admitted that this kind of order will eventually cover all the countries of Europe, and possibly the whole world. Therefore, based on the results of the summit held yesterday, it can be concluded that we should expect that the population will have to get used to a new reality, a new world order in the near future. The material has been provided by InstaForex Company - www.instaforex.com |
| Spring oil prices collapse happens again Posted: 30 Oct 2020 03:36 AM PDT
Some European countries have reintroduced tighter control measures to stop the COVID-19 spread. Once again, trade and tourism are under pressure. As a result, demand for fuel falls. On Thursday, WTI crude futures fell to a 5-month low, losing 6.6%. WTI was trading at $36.17 per barrel. Brent crude futures dropped by 3.8% to $37.65 per barrel. At the beginning of the year, quotes were above $60 per barrel. After a global lockdown in the spring, oil prices partially recovered as the global economy revived from the virus and the number of new cases declined. However, with the beginning of cold weather, the number of infected people began to grow sharply. Thus, many countries in Europe have again introduced restrictive measures, which undoubtedly affected the recovery in oil demand. Investors fear that other countries will resort to the same measures, reducing demand for gasoline. Oil prices are directly dependent on the dynamic of supply and demand. Many analysts expect volatility to continue despite possible economic stimulus and the coronavirus vaccine. In other words, forecasts for a recovery in oil prices in 2021 are unlikely to come true. During this year, quotes have been too low. Many manufacturers are still unable to cover their charges. The situation in the oil market is really difficult. In recent months, many people have been laid off, many mergers and acquisitions have been made, and many companies have been declared bankrupt. According to law firm Haynes and Boone LLP, 40 North American oil companies have collapsed since the beginning of the year. Despite the rise in oil and gas stocks, included in the S&P 500, their value still remains 50% lower compared to the beginning of the year. Given the current situation, analysts are changing their forecasts for oil prices. Thus, UBS has lowered its forecasts for oil prices by $5 per barrel, citing a decrease in European demand and an increase in Libyan supply. By the way, in Libya, the government managed to negotiate with the rebels at the end of the eight-month blockade of mining facilities. Market participants are waiting for OPEC's decisions. The group will meet in November and January to discuss plans to ease production restrictions that were imposed due to the market crash in the spring. Analysts at Commerzbank believe that the fall in prices will force OPEC to take new measures to balance the market. However, today, on Friday, oil prices rose during trading. WTI crude oil for December delivery grew by 0.91% to trade at $36.50 per barrel. Brent crude for January delivery advanced by 0.86% to settle at $38.59 per barrel. The difference in price between the Brent and WTI contracts is $2.09 per barrel. The USD Index, which measures the US dollar against a basket of six major currencies, lost 0.13% to trade at $93.858. The material has been provided by InstaForex Company - www.instaforex.com |
| Trading recommendations for the GBP/USD pair on October 30 Posted: 30 Oct 2020 02:37 AM PDT The GBP / USD pair managed to overcome the local low of 1.2916 yesterday, which opened the way to the next price coordinate 1.2860, where a regular stop was observed at the beginning of the month, followed by a rebound in price. If we pay attention to the recovery process relative to the four-week upward trend (from 1.2674 to 1.3175), we will see that on October 21-29, the bears managed to restore the downward movement by about 57%, which can be considered a sell signal. The main volume of short positions will appear after a consolidation below 1.2840, which may lead to a 100% recovery of the September cycle. So, if we analyze the trades setup yesterday by minutes, we will see that the wave of short positions arose from 09:45 and lasted until 15:30, during which the quote reached the level of 1.2880. After that, the pair underwent a pullback and moved from 1.2880 to 1.2935, and then to a sideways move 1.2915 / 1.2935. In terms of daily dynamics, a volatility of 144 points was recorded, which is 22% higher than the average level. an acceleration has occurred for two days already, which suggests that perhaps, there is a predominant downward interest. Nonetheless, speculative positions continue to grow in the market. Anyhow, as discussed in the previous review , traders focused on consolidating the quote below 1.2990, hoping for a recovery in price and, in turn, a build-up of short positions. Thus, if we look at the trading chart in general terms (daily period), we will see a clear signal of the restoring downward interest, in which a breakdown of the 1.2840 / 1.2860 area will lead to the resumption of the 1.3480 --- -> 1.2674 tick. The success of this may change the medium-term trend. With regards to news, quite good data on the UK lending market was published, where the volume of mortgage lending increased from £ 3.3 billion to £ 4.83 billion, while the volume of consumer lending fell by £ 0.622. Then, in the afternoon, weekly data on jobless claims in the United States were released, which was also quite good, considering the decrease in their volume. Repeated applications fell from 8,495,000 to 7,756,000, while initial applications decreased from 791,000 to 750,000. At the same time, the first estimate of the US GDP for the third quarter was published, where a 33.1% economic growth was recorded, against expectations of only 30.0%. This overwhelming amount of strong statistical data resulted in an increase in the value of the US dollar. As for today, only the eurozone has significant reports that could affect the market, thus, the pound will move according to correlation, as well as on the updates about hot topics such as COVID-19 and Brexit. The upcoming trading week is expected to be one of the most volatile, as it is supported by a large number of important events: the US presidential election, the Fed meeting, the Bank of England meeting, a report from the US Department of Labor. Monday, November 2 US 16:00 - ISM business activity index (October) Tuesday, November 3 US presidential election Wednesday, November 4 US 13:30 - ADP employment report (October) Thursday, November 5 UK 13:30 - Bank of England meeting US 13:30 - Jobless claims US 20:00 - FRS meeting US 20:30 - FOMC press conference Friday, November 6 US 13:30 Moscow time - report of the US Department of Labor - Non-farm employment change report - Unemployment rate - Average hourly wages Further development As we can see on the daily chart, there is a variable bumpiness within the values of 1.2900 / 1.2945, where the downward interest is still taking place in the market, although it is in the stage of regrouping trading forces. The subsequent downward movement is expected after the price is kept below 1.2880, with a local move towards 1.2840 / 1.2860. The main volume of short positions will appear after the price consolidates below 1.2840 in the four-hour period, which will open the way towards the local low of 1.2674. Indicator analysis Looking at the different sectors of time frames (TF), we can see that the indicators on the hourly and daily periods signal SELL because of the rapid pullback of quotes, while the minute period emits different signals because of the current regrouping of trading forces. Weekly volatility / Volatility measurement: Month; Quarter; Year Volatility is measured relative to the average daily fluctuations, which are calculated every Month / Quarter / Year. (The dynamics for today is calculated, all while taking into account the time this article is published) Volatility is currently at 40 points, which is even lower than the average level by 66%. However, there is a high chance that this will accelerate, mainly due to the high coefficient of speculative positions in the market. Key levels Resistance zones: 1.3000 ***; 1.3200; 1.3300 **; 1.3600; 1.3850; 1.4000 ***; 1.4350 **. Support zones: 1.2840 / 1.2860; 1.2770 **; 1.2620; 1.2500; 1.2350 **; 1.2250; 1.2150 **; 1.2000 *** (1.1957); 1.1850; 1.1660; 1.1450 (1.1411). * Periodic level ** Range level *** Psychological level Also check the trading recommendations for the EUR/USD pair here. The material has been provided by InstaForex Company - www.instaforex.com |
| October marked sharp surges and swings in the oil market Posted: 30 Oct 2020 02:19 AM PDT
Oil prices are slowly rising Friday morning after the devastating fall on Thursday, which led it to the minimum values recorded almost six months ago. The sharp surges and swings that have been observed in the oil market throughout October have already made this period the worst this year, not counting the failure in May, which happened against the background of the first wave of the coronavirus pandemic. In the second month of autumn, the Brent crude oil mark began to cost 7% less, while WTI lost even more at 9%. There are plenty of factors for the negative this year. Take, for example, the increase in oil production in Libya, which was unexpected for everyone and seriously undermined the mood of investors. At the same time, the market was overtaken by the second wave of the coronavirus pandemic, which, according to experts, will become more destructive than the spring one. The situation is especially aggravated in European countries and the US. Market participants are not so much afraid of an increase in production, but of a reduction in the already too low demand for black gold. In this regard, the consequences of the new restrictive quarantine measures gradually introduced in different countries are immediately assessed as it will exert the most significant pressure on the market in the short and medium-term. To date, it is clear that the European region is covered by a second, larger wave of COVID-19, which, together with the unresolved problems of the first wave, will put even more pressure on demand. Analysts are almost certain that the level of demand will not be restored to pre-crisis levels in the coming year since the scale of the next tragedy is not fully understood. Nevertheless, the fact that oil consumption in Europe will become noticeably less is no longer disputed. The situation is further complicated by the new strict quarantine measures. In particular, French leader Emmanuel Macron has decided on a partial lockdown, which will begin Friday. If the epidemiological situation in the country worsens, the lockdown may be extended. While its validity period is determined by the end of November, however, all specific decisions will be made upon the stabilization of the situation. Following France, Germany also restricts the activities of public institutions. There is also a sharp surge in infection. In the US, new outbreaks continue to be recorded. On Thursday, the number of new covid patients increased by more than 91,000. If everything continues at the same pace, then a strict quarantine measure cannot be avoided. And given the fact that next week the presidential elections are to be held, the situation is heating up to the limit. The price of futures contracts for Brent crude oil for delivery in December on the trading floor in London rose slightly by 0.4% or $0.15, which sent it to $37.8 per barrel. Thursday's trading session was again a failure with a reduction of 3.8% or $1.47, which sent it to the lowest level since the end of spring. The price of futures contracts for WTI crude oil for delivery in December on the electronic trading platform in New York also showed positive dynamics, with a slight increase of 0.08% or $0.03. The current price is now consolidated at $36.2 per barrel. Thursday's trading ended in the red zone, with a serious drop of 3.3% or $1.22. Contracts also reached the lowest level since the beginning of this summer. Against the background of recent trends in the oil market, there are huge risks of not meeting the forecasts that were previously set for the next year, especially since during the current year the cost of raw materials was located mainly below the level that experts spoke about. Moreover, not all producers were able to cover production costs due to the low price of black gold. And some oil companies even had to cut employees to cope with the problems. In this regard, it is not necessary to predict an improvement in the situation in the near future. Rather, it is worth adjusting the preliminary data on oil for the following year by lowering the main indicators. The material has been provided by InstaForex Company - www.instaforex.com |
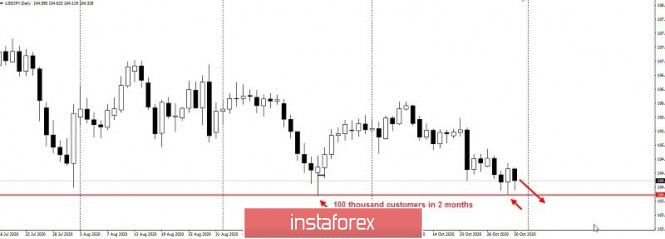
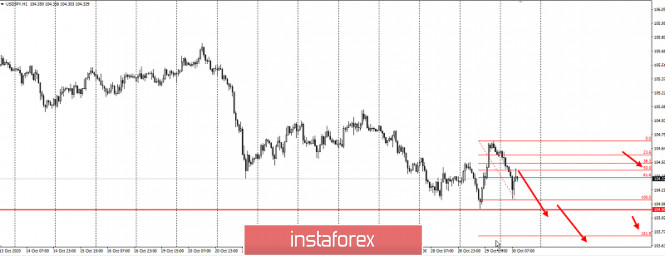
| Trading idea for the USD/JPY pair Posted: 30 Oct 2020 02:15 AM PDT The USD/JPY pair currently shows a downward trend, moving closely to the low (104) of this month, which is based on the trading idea to decline last Wednesday. There was a deep pullback yesterday during the European and US trading session, which was almost completely absorbed by the short action from the Asian session. Thus, it is suggested to consider the idea of of declining further with the goal of breaking through the level 104 according to the next plan: Here, the short action from the Asian session will be taken for the wave "A". After that, we will sell it with a pullback of 50%. Risks, in turn, is located at 104.7, while take profit is at 104. The methods of "Price Action" and "Stop Hunting" were used for the strategy. However, controlling the risks in order to avoid losing profit is necessary. We should note that trading in this market is quite precarious and unpredictable, although profit can still be earned as long as the right techniques are used. Good luck everyone! The material has been provided by InstaForex Company - www.instaforex.com |
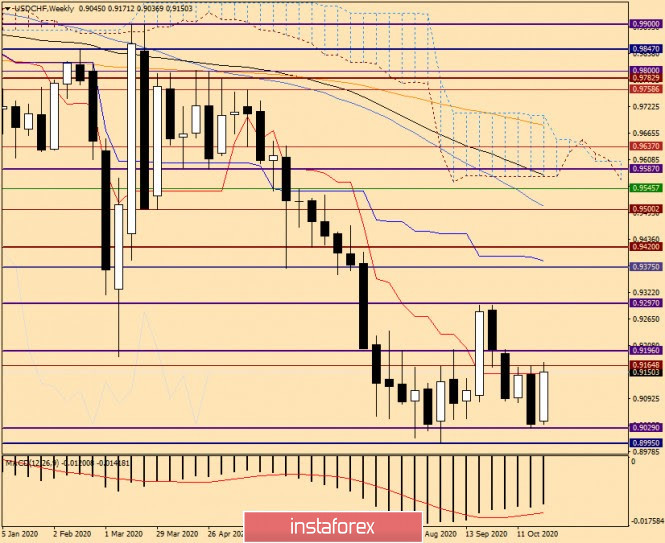
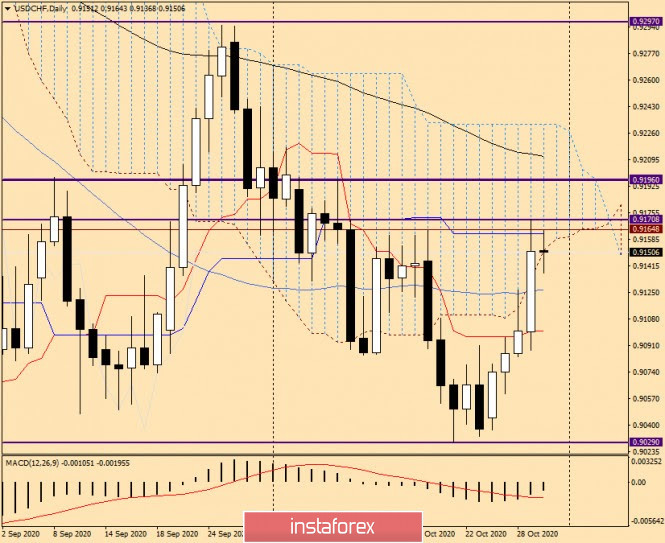
| Analysis and Trading Ideas for USD / CHF from October 30, 2020 Posted: 30 Oct 2020 02:13 AM PDT Today, on the last day of weekly and monthly trading, I would like to consider another major currency pair: the USD/CHF pair. I have repeatedly noted that, in my opinion, this pair is quite interesting and technical, but often remains without proper attention. Well, let's analyze the situation that is developing for USD/CHF and for the sake of completeness, let's start with the weekly timeframe. Weekly The pair met strong resistance in the form of the Tenkan line of the Ichimoku indicator over the past two week which they could not overcome. At the current five-day trading session, the USD/CHF bulls found the strength to test the level again for a breakdown of the red Tenkan line and are succeeding so far. At the time of writing, the pair is trading above the Tenkan, near 0.9158. As you can see, very strong support was received in the price zone of 0.9030-0.9000 and this is not accidental. Market participants are well aware of the strength and significance of the psychological mark of 0.9000 and so far they are clearly not eager to trade under this important level. The piquancy of the situation also lies in the fact that, due to certain circumstances, both the Swiss Franc and the US Dollar act as safe-haven currencies. As you know, the rampant COVID-19 pandemic gives privileges to the Dollar to a greater extent. If we return to the technical picture on the weekly chart, the current task of the bulls is to pass not only the Tenkan line but also to break through the sellers' resistance at 0.9164, where the maximum values of the last five-day trading period were shown. If these conditions are met, the USD/CHF pair will have good prospects for continuing the upward movement where the nearest resistance of sellers is concentrated near 0.9200. However, in my opinion, the most important thing will be to pass up the 0.9300 mark. It is clear that if this happens, it will not happen today. For now, the bulls are focused on current tasks. It is worth noting that the course of today's weekly and monthly trading on the pair may be influenced by statistics from the United States, which will begin to arrive at 12:30 UTC. Despite the fact that for this currency pair, I mostly adhere to bearish sentiments, the current situation is quite favorable for the bulls. Daily On the daily chart, we see that as a result of yesterday's fairly strong growth, trading ended within the Ichimoku cloud. At the same time, one candle closed in the cloud may not be enough to consider its position as final. Much will depend on the outcome of today. At the time of writing, the USD/CHF pair is showing moderate strengthening. It is characteristic that before this, the bears on the instrument tried to return the price to the lower border of the cloud but at 0.9137, the pair found strong support and began to recover actively. At the end of the review, there are attempts to break through the blue Kijun line of the Ichimoku indicator, after which the bulls will have to storm the sellers' resistance at 0.9170, where the maximum values of yesterday's trading were shown. Despite the high probability of upward dynamics, buying right here and now, on the breakout of resistance, is unwise and quite risky. However, for those who use a breakout strategy, you can try buying at the breakout level of 0.9170. Another option is to wait for the actual breakdown of this mark and buy on the rollback to it. The material has been provided by InstaForex Company - www.instaforex.com |
| Forex forecast 10/30/2020 from Sebastian Seliga Posted: 30 Oct 2020 02:07 AM PDT Let's take a look at the EUR/USD and USD/JPY technical picture after the interest rate decision were made and USD/CAD ahead of the GDP data. The material has been provided by InstaForex Company - www.instaforex.com |


| You are subscribed to email updates from Forex analysis review. To stop receiving these emails, you may unsubscribe now. | Email delivery powered by Google |
| Google, 1600 Amphitheatre Parkway, Mountain View, CA 94043, United States | |
No comments:
Post a Comment