Delta Air Lines (DAL) and other airlines have been on everyone's radar for some time since the pandemic hit, but I'm wondering if we're beginning to feel a sense of deja vu because of - oddly enough - the delta variant.
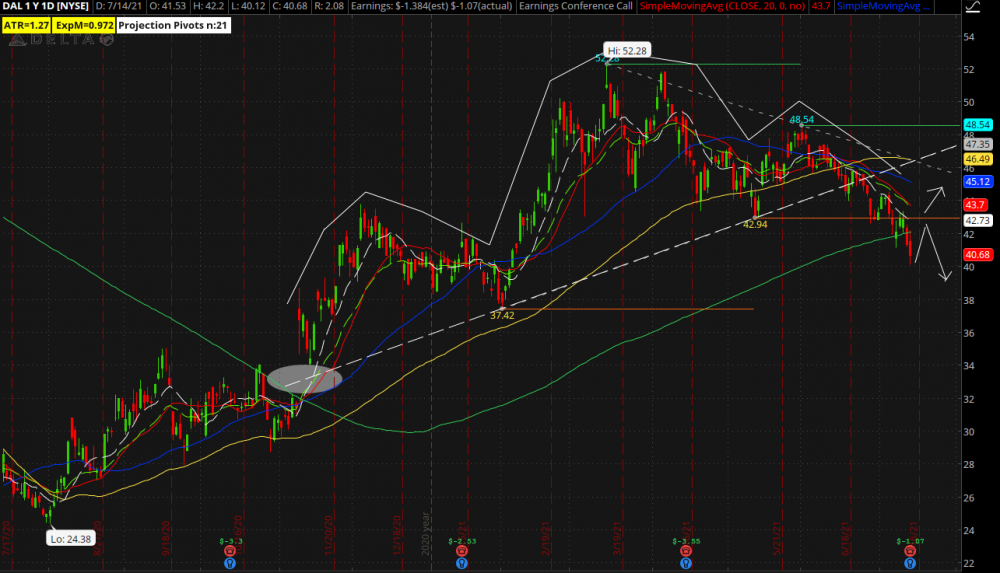
DAL presents a head-and-shoulders pattern and is now trading under the 200-day simple moving average (green) and you can see the pattern drawn out in white. The white, dotted trendline shows the recent break of the neckline.
Now, to the left of the neckline is a gray bubble showing a sizable gap at the ~$32.00-$34.00 level.
If the share price can regain the recent support close to ~$43.00, it could continue moving up before hitting more resistance.
However, if it fails, the next stop is ~$37.50 with potentially more pain below it.
-Corey
(Disclosure: I hold no position in DAL.) | 


No comments:
Post a Comment