
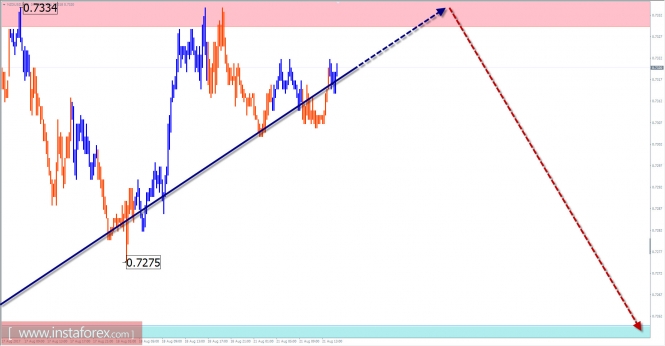
The major trend of the New Zealand dollar in the past 2 years is formed by an upward wave. In a larger-scale wave model, this zone took the area of correction. An analysis of its wave structure indicates a high probability of continuation of the wave. Finally, the formation of the ascending line segment of May 11 is not yet complete. During the end of July, there was a collision forming in the middle part of the wave (B). The formation of the wave is irregular, hidden, with an elongation toward the main trend. Correction in this type of wave often ends at the lowest possible levels. The growth of prices started a week ago and does not have a potential for reversal. This rollback can be completed in the coming days. The recovery is expected to be completed today. Within the resistance zone, you can wait for the turn and the beginning of the decline. Boundaries of resistance zones: - 0.7330 / 60 Support zone boundaries: - 0.7260 / 30 Show full picture Explanations to the figures: For simplified wave analysis, a simple type of wave is used that combines 3 parts (A; B; C). Of such waves, all kinds of correction are composed mostly of impulses. On each considered time-frame the last and incomplete wave is analyzed. The zones marked on the graphs are indications of calculation areas in which the probability of a change in the trend direction significantly increased. Arrows indicate the wave counting according to the technique used by the author. The solid background of the arrows indicates the structure formed, the dotted one indicates the expected wave motion. Attention: The wave algorithm does not take into account the duration of the tool movements in time. The forecast is not a trading signal! To conduct a trade, you need to confirm the signals used by your trading systems.


No comments:
Post a Comment