
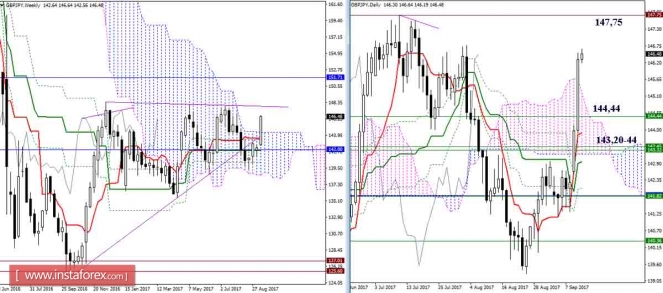
Show full picture The optimism expressed last week supported the players to increase and overcome the next resistance 143.20-44 (daytime Senkou Span B + week Tenkan), as well as to close the last day outside the cloud Ichimoku week and day timeframe. Maintaining the achieved highs will allow the pair to form an upward target in the near future to break the clouds.
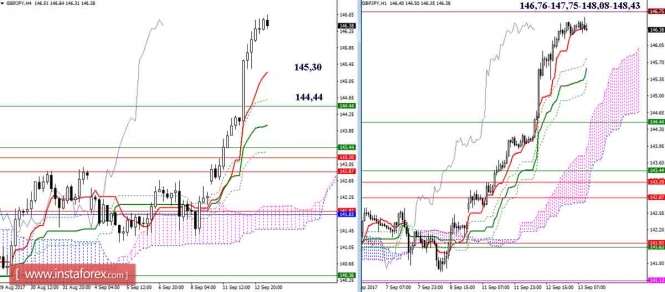
The Ichimoku indicator is currently on the side of the players to raise. The pair rose to the resistance zone of weekly maximum extremes of 146.76 - 147.75 - 148.08 - 148.43. As a result, it is expected that the player's activity to increase, brake or pull back will drop. The nearest supports for today is at 145.30 (Tenkan N4 + final borders of the cross N1) and 144.44 (Fibo Kijun N4 + cloud N1 + week Senkou Span B) can be singled out today.
EUR / JPY
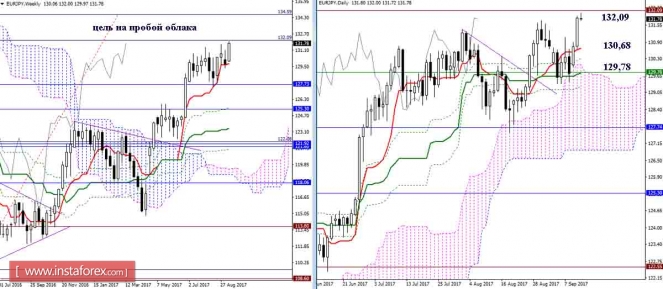
The pair reached the resistance zone of the first target (132.09) for the week to breakdown the cloud. Overcoming the level will open the way towards the fulfillment of the target level at 134.59. In this situation, the support continues to remain at the levels of the daytime cross (Tenkan 130.68 + Kijun 129.78), strengthened by the week-long Tenkan (129.78).
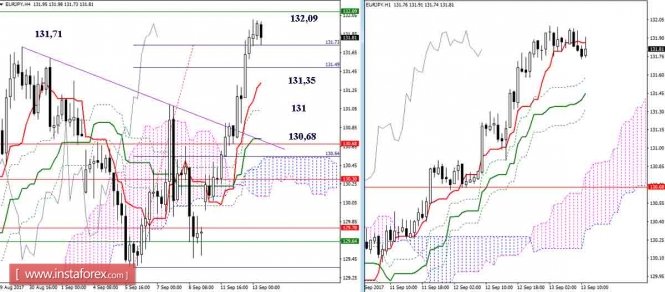
Increasing players enjoy the advantage and support of the Ichimoku indicator. They overcame the target at the breakdown of the H4 cloud and updated the maximum (131.71), and used these levels as support. In addition, the 131.35 (Tenkan H4 + Kijun H1) - 131 (Fibo Kijun N4 + H1 cloud) - 130.68 (Kijun H4 + day Tenkan) can be referred today as supports. As of this moment, the resistance is at 132.09 (the upper half level), the breakdown of the level opens new targets.
Indicator parameters: all time intervals 9 - 26 - 52
Color of indicator lines:
Tenkan (short-term trend) - red, Kijun (medium-term trend) - green, Fibo Kijun is a green dotted line, Chinkou is gray, Clouds: Senkou Span B (SSB, long-term trend) - blue, Senkou Span A (SSA) - pink.
Color of additional lines: Support and resistance MN - blue, W1 - green, D1 - red, H4 - pink, H1 - gray, Horizontal levels (not Ichimoku) - brown, Trend lines - purple.
GBP / USD
Analysis of wave counting:
The acceleration of the August inflation indicators in Britain was optimistically welcomed by the market, which allowed the GBP/USD pair to continue its upward movement and at the end of the day to end tt a few points from the level of the 33rd figure. At the same time, in connection with the breakdown of the currency pair of the highs from 03.08.17 (1.3270), it can be assumed that the internal wave structure of the 5th wave, in the 3rd (or C), took a much more complicated form and at the moment the currency the pair is in the stage of formation of the 3rd wave, in the 5th, in the 5th, in the 3rd (or C), in the composition of the rising section of the trend, which has developed further from the lows of the beginning of the year.
Objectives for a building an downward wave option:
1.3100 - 1.3200
Objectives for building an upward wave option:
1.3336 - 300.0% by Fibonacci 1.3400
Wave counting has undergone some changes in connection with the breakdown of the mark of 1.3270. The increase in prices continues with the targets near the estimated level of 1.3336, which corresponds to 300.0% of Fibonacci, and above, about 34 figures, within 3, at 5, at 5, in 3 (or C). Within the framework of the correctional wave 4, a slight decrease is possible with the targets being about 32 and 31 figures.
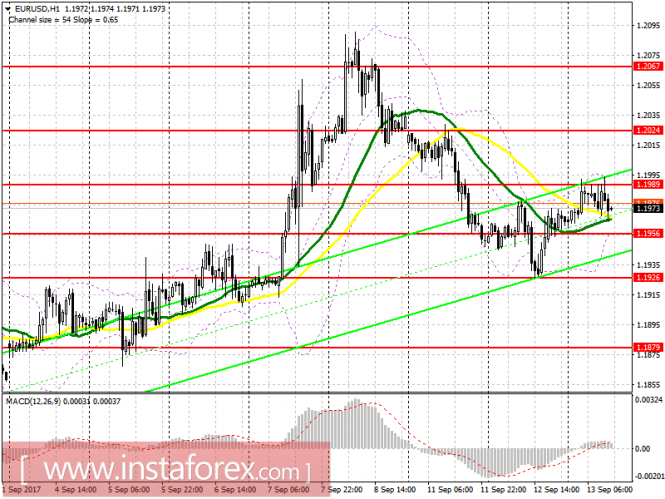
EUR/USD
To open long positions for EURUSD, you need:
The buyers could not get a hold of 1.1989, which led to the selling of the euro in the morning. At the moment, it's best to return to long positions only after a real breakdown of 1.1989 happens. It is possible, on the weak data on inflation in the US. In this case, you can count on an update of 1.2024 and 1.2067, where I recommend locking in the profit. If the euro falls below 1.1956, it is best to return to long positions after updating 1.1956 or to rebound from 1.1879.
To open short positions for EURUSD, you need:
Sellers will try to drive the pair further below the level of 1.1956, and good data on the US will lead to the selling of the euro to the support area of 1.1926 and 1.1879, where I recommend locking in profits. In the event of a sharp increase in the euro in the afternoon, it would be best to pay attention to the selling of the euro for it to rebound from 1.2024.
Get Bonus No Deposite in your Trading Account now and add this currency pair to your forex portfolio, enjoy your trading with us!


No comments:
Post a Comment