
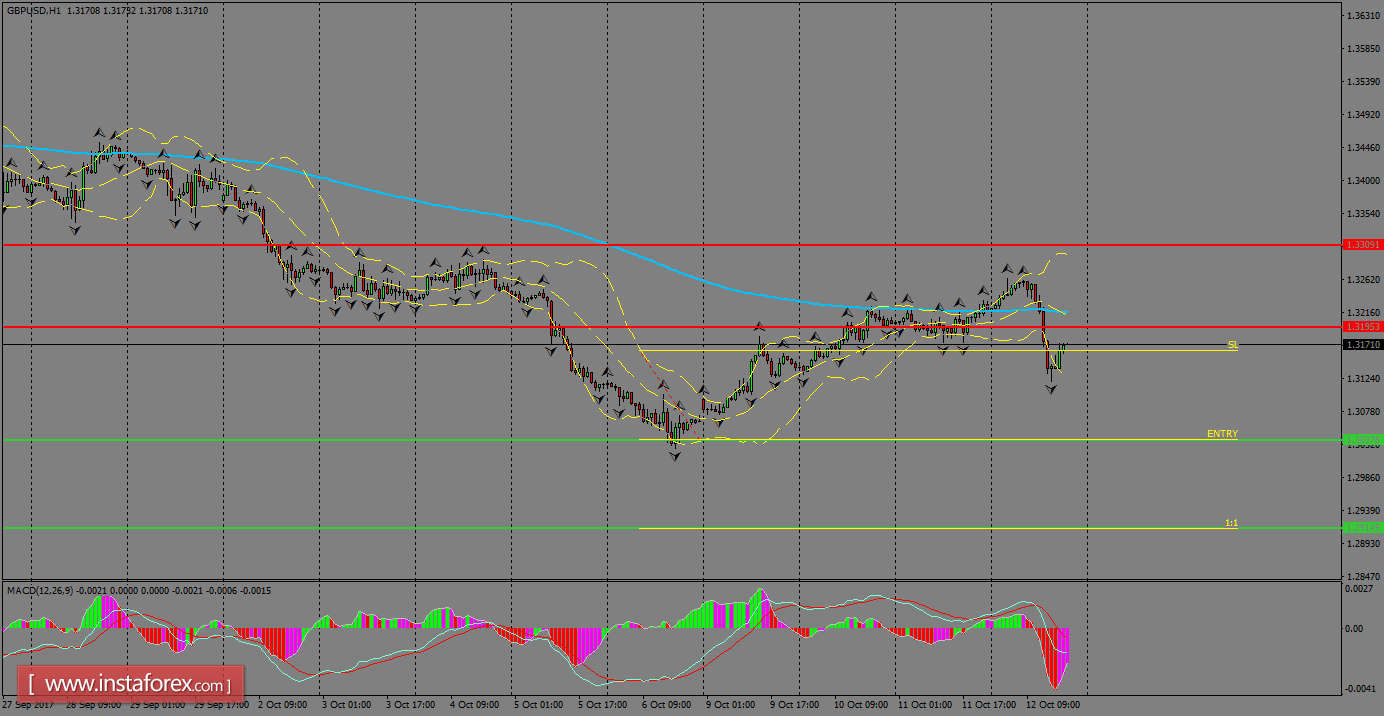
Following that pullback, the pair is forming a fractal around the 1.3150 level and possibly this is the move before resuming the bearish bias. To the upside, the moving average remains as a critical level.

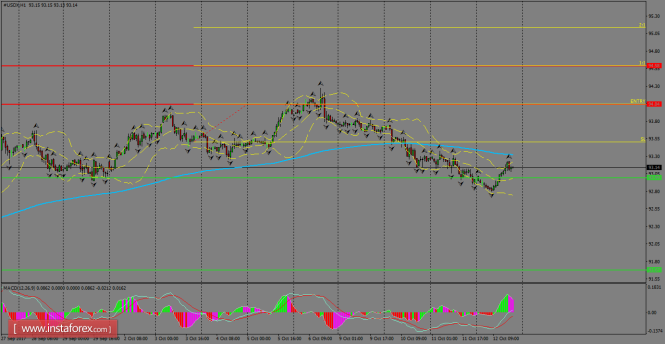
H1 chart's resistance levels: 1.3195 / 1.3309
H1 chart's support levels: 1.3037 / 1.2914
Trading recommendations for today:
Based on the H1 chart, sell (short) orders only if the GBP/USD pair breaks a bearish candlestick; the support level is at 1.3037, take profit is at 1.2914 and stop loss is at 1.3161.
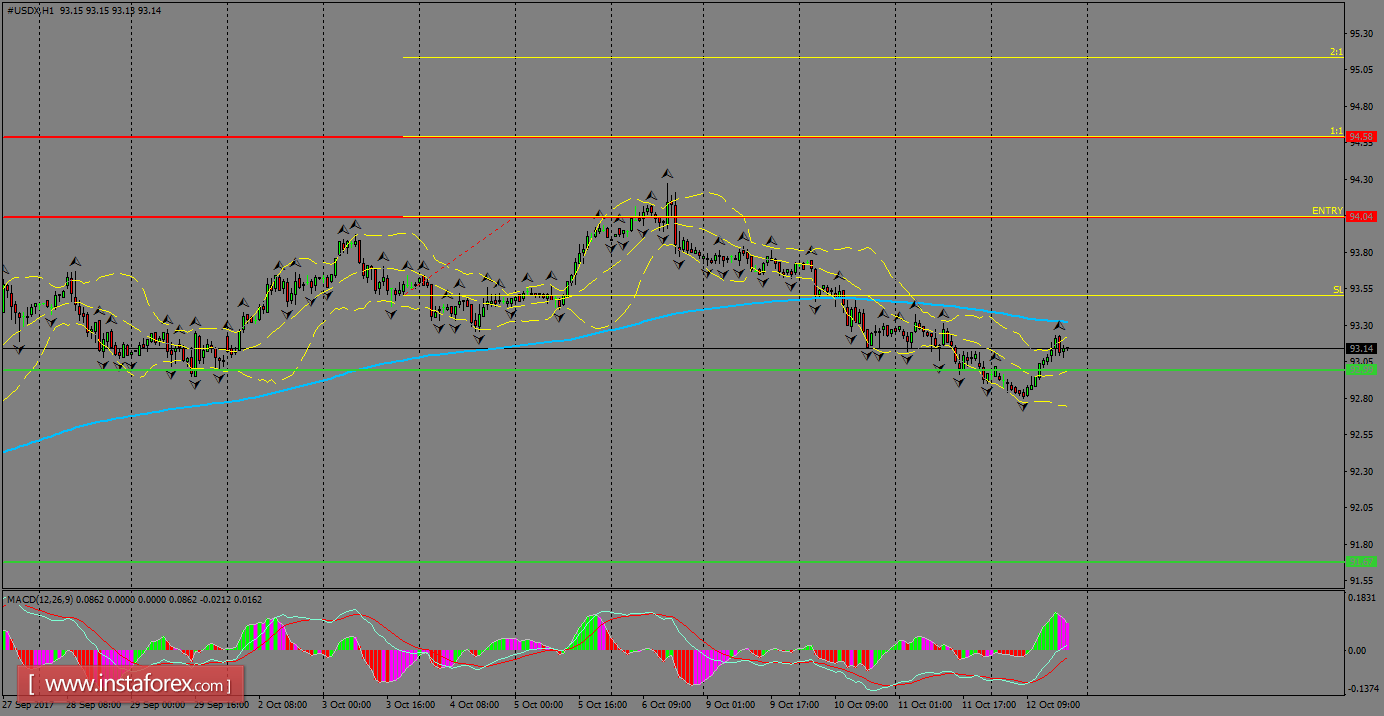
USDX continues to strengthen the bearish bias on a short-term basis, but still remains supported by the psychological level of 93.00.
USDX continues to strengthen the bearish bias on a short-term basis, but still remains supported by the psychological level of 93.00.
If that zone gives in to the bears' force, the index could look to extend the downside towards the 91.67 level. However, if it manages to rebound, focus should be shifted to the resistance zone of 94.04.
H1 chart's resistance levels: 94.04 / 94.58
H1 chart's support levels: 93.00 / 91.67
Trading recommendations for today:
Based on the H1 chart, place buy (long) orders only if the USD Index breaks with a bullish candlestick; the resistance level is at 94.04, take profit is at 94.58 and stop loss is at 93.50.
Get Bonus No Deposite in your Trading Account now and add this currency pair to your forex portfolio, enjoy your trading with us!


No comments:
Post a Comment