
Wave Analysis:
The cable continues to rise as previously anticipated but is yet to hit our target. At the moment, the cable is slightly below a key weekly resistance level 1.33054, and as long as this level protects the upper side, a possible rebound from this level is expected, if this level (1.33054) is broken then the price could rise even higher towards 1.37240. The anticipated upward movements is the continuation of the impulsive wave (5) to the upper side but must no go beyond 1.40 by the end of this week. This pair will have a similar price action to EURUSD and NZDUSD.
Trade Recommendations:
We're still long towards 1.40
Bitcoin analysis for 13/10/2017
Bitcoin analysis for 13/10/2017: The small island-state in the Pacific, the Republic of Vanuatu, has announced that applicants for citizenship will be able to pay for the application in Bitcoins. Foreigners can acquire Vanuatu citizenship for 43 Bitcoins, which is about $ 200,000, according to Newsweek magazine. This is the first country in the world to accept Bitcoins as a payment method for government services. Foreigners who apply for the Vanuatu nationality must do so through the Australian stock exchange. The Exchange will check whether the applicants meet the requirements set by the Australian Financial Regulations. In order to process the necessary data, the Vanuatu government has formed a partnership with Selfkey, a technology firm specializing in blockchain technology. The company will provide a platform where you will be able to apply along with the ability to pay a fee. It will also make it possible to verify the identity. Having a passport of this micronation has many advantages. Since the country is a member of the Commonwealth of Nations, its citizens can travel to 113 countries. You can travel without a visa to Russian Federation, the United Kingdom or the European Union.
Bitcoin analysis for 13/10/2017: The small island-state in the Pacific, the Republic of Vanuatu, has announced that applicants for citizenship will be able to pay for the application in Bitcoins. Foreigners can acquire Vanuatu citizenship for 43 Bitcoins, which is about $ 200,000, according to Newsweek magazine. This is the first country in the world to accept Bitcoins as a payment method for government services. Foreigners who apply for the Vanuatu nationality must do so through the Australian stock exchange. The Exchange will check whether the applicants meet the requirements set by the Australian Financial Regulations. In order to process the necessary data, the Vanuatu government has formed a partnership with Selfkey, a technology firm specializing in blockchain technology. The company will provide a platform where you will be able to apply along with the ability to pay a fee. It will also make it possible to verify the identity. Having a passport of this micronation has many advantages. Since the country is a member of the Commonwealth of Nations, its citizens can travel to 113 countries. You can travel without a visa to Russian Federation, the United Kingdom or the European Union.
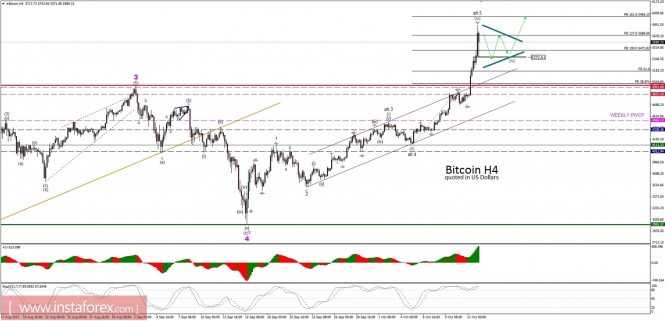
Let's now take a look at the Bitcoin technical picture. The market rally has been extended above the projected target levels and the recent high was noted at the level of $,5841 before small correction happened. From the Elliott Wave Theory point of view, it might be the time for an internal corrective cycle to occur, possibly in a form of a triangle pattern. This wave will be labeled as the wave (iv) and when completed another higher high is expected for a top of the wave (v). The immediate support is seen at the level of $5,372.

Trading plan for 13/10/2017:
A very quiet night on the financial markets, but like yesterday the US Dollar is losing ground to the other major currencies. The EUR/USD pair is trading around 1.1850. The British Pound is still strong: GBP/USD is close to 1.33. USD/JPY again descended to 112.00. On Wall Street, the sellers were slightly dominant yesterday - the SP500 futures are at the level of 2,500 points in the morning.
A very quiet night on the financial markets, but like yesterday the US Dollar is losing ground to the other major currencies. The EUR/USD pair is trading around 1.1850. The British Pound is still strong: GBP/USD is close to 1.33. USD/JPY again descended to 112.00. On Wall Street, the sellers were slightly dominant yesterday - the SP500 futures are at the level of 2,500 points in the morning.
On Friday 13th of October, the event calendar is busy in important news releases. During the London session, Switzerland will post Producer and Import Prices data, Italy will post Consumer Price Index data and Germany will present Final Consumer Price Index data. During the US session, the US will present Consumer Price Index, Retail Sales and Preliminary UoM Consumer Sentiment data. Moreover, there are some speeches scheduled for later from FOMC officials Charles Evans, Robert Kaplan, and Jerome Powell.
EUR/USD analysis for 13/10/2017:
The Consumer Price Index data and Retail Sales from the US are scheduled for release at 12:30 pm GMT and market participants expect inflation to increase from 0.4% to 0.6% on the reported month. Retail Sales are expected to increase as well, from -0.2% last month to 1.7% this month. The impact of the recent hurricanes increases the uncertainty whether the expectations will be met. As the recovery continues in the Greater Houston area, we think the increased replacement purchases will boost retail sales in September. On the other hand, Hurricane Irma brought extensive power outages in Florida, which may have resulted in considerable loss of sales. Nevertheless, both natural disaster effects are transitory and they will unlikely to change the overall US economic outlook. The US labor market remains healthy and steady growth in personal income continues. High volatility is expected on the USD main pairs though.
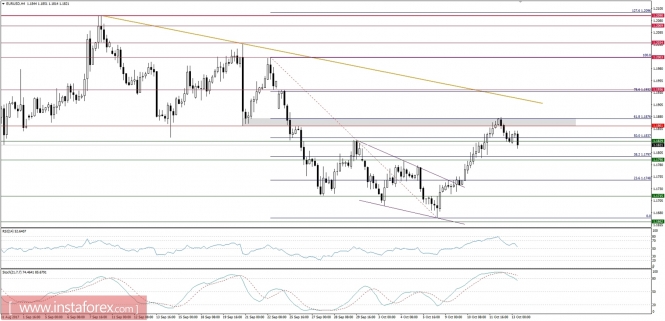
Let's now take a look at the EUR/USD technical picture in the H4 time frame. The 61% Fibo at the level of 1.1876 acted as a proper resistance, so the price reversed and now is trading below the technical support at the level of 1.1829. The market conditions are overbought. So if the data meets the expectations, then a further move down is expected towards the level of 1.1790 and below.

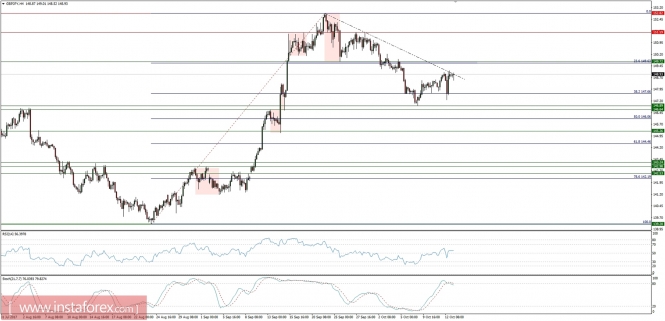
Market Snapshot: GBP/JPY at the key resistance The price of GBP/JPY is trading at the level of 148.93, just below the key trend line resistnace. The market conditions looks overbought, so the price might reverse here and fall towards the level of 147.66. On the other hand, a breakout higher opens the road towards the technical resistance at the level of 149.63.
Ichimoku indicator analysis of USDX for October 13, 2017
The Dollar index has broken below 93 and this is a bearish sign. Price is now trading below the Ichimoku cloud. We could see a bounce to back test the lower boundary of the clouds, but I would expect price to get rejected.
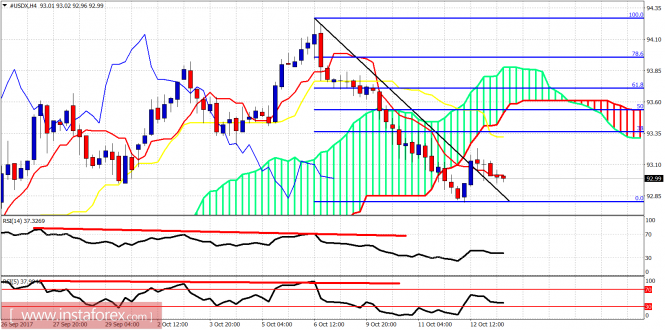
The Dollar index is trading below the 4-hour cloud. Price could bounce towards 93.30-93.40 where the 38% Fibonacci retracement is found. Short-term support is at 92.80. Resistance at 93.35.
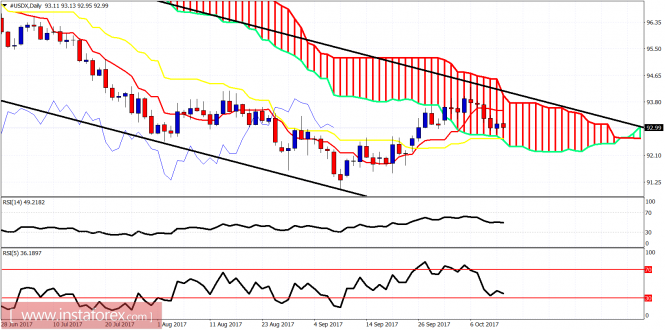
Black lines - bearish channel
The Dollar index remains inside the bearish channel and price has now broken below the tenkan-sen (Red line indicator). Next important support is at 92.60 where the lower cloud boundary is found together with the kijun-sen (yellow line indicator). Breaking below that level will confirm that we have started the next downward move to new lows.
Ichimoku indicator analysis of gold for October 13, 2017
Gold price made a shallow pull back yesterday towards $1,289 and is now making fresh new highs. Gold price is breaking above the 38% Fibonacci retracement and this is a bullish continuation sign.
Gold price made a shallow pull back yesterday towards $1,289 and is now making fresh new highs. Gold price is breaking above the 38% Fibonacci retracement and this is a bullish continuation sign.
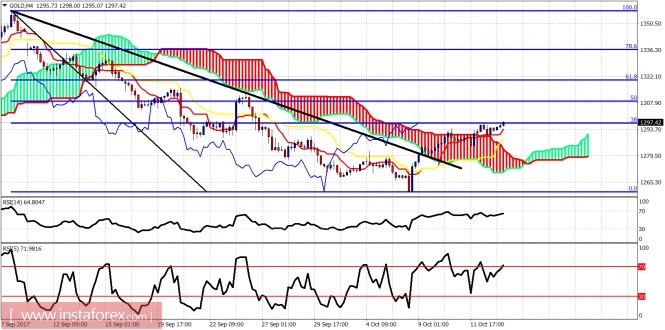
The short-term RSI is overbought and diverging. This is just a small warning that we could see another short-term pull back towards $1,290 before higher, but necessary. Gold is in a bullish short-term trend after breaking above the 4-hour Kumo (cloud). Support is at $1,288 and next at $1,283.
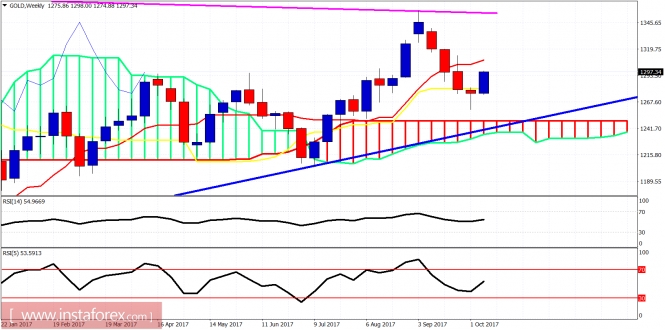
The weekly reversal off the kijun-sen (yellow line indicator) is progressing as expected and according to bulls plan. Trend remains bullish and with short-term trend changing to bullish again, we expect Gold price to move at least towards $1,320. The big test will come then.


No comments:
Post a Comment