
2017-12-07

Wave summary:
We continue to look for resistance near 133.22 for more downside pressure towards 132.31 and the important support at 131.14, which needs to be broken to confirm wave (D) peaked with the test of 134.50 and wave (E) lower to the ideal target at 123.43 is developing.
R3: 133.75
R2: 133.50
R1: 133.22
Pivot: 132.62
S1: 132.31
S2: 131.70
S3: 131.14
Trading recommendation:
We are short EUR from 133.75 with stop placed at break-even.
Elliott wave analysis of EUR/NZD for December 7, 2017
2017-12-07

Wave summary:
Once again EUR/NZD failed to break below support seen at 1.7077 (the low was seen at 1.7100). The rally following the 1.7100 low does begin to look constructive, but only a clear break above resistance at 1.7342 will indicate a corrective low already could be in place.
We do think the correction from 1.7409 has been very short both in points and time and would expect a larger correction as wave (4), but it might be that the complexity just is rising.
R3: 1.7342
R2: 1.7319
R1: 1.7264
Pivot: 1.7195
S1: 1.7157
S3: 1.7100
Trading recommendation:
Our short position from 1.7450 has been stopped at 1.7250 for a 200 pip profit. We will stay neutral for now.
The US dollar index has broken out of the bearish Kumo cloud resistance. Trend is changing to bullish as long as price is above 93-92.50. The index has started making higher highs and higher lows on the 4 hour chart.
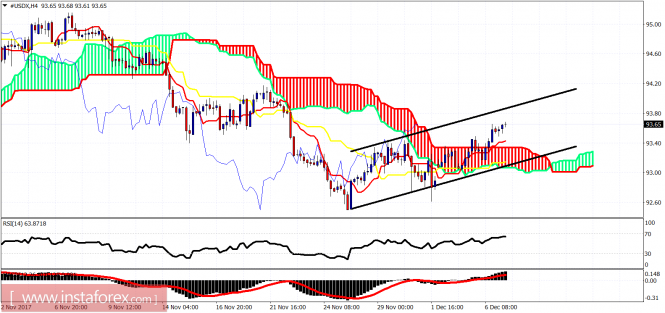
Black lines - bullish channel
The Dollar index is trading above the Ichimoku cloud. Price is inside the bullish short-term channel. Support is found at 93.30 while the resistance lies at 93.80. Trend is bullish.
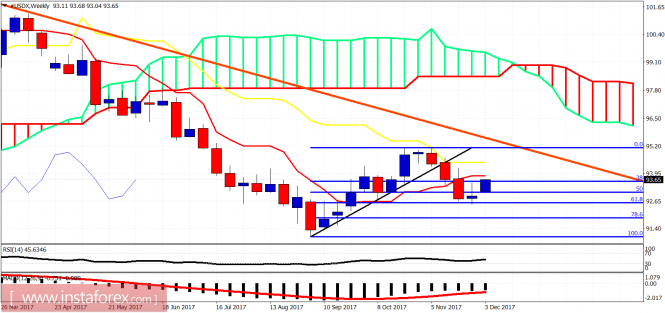
On a weekly basis, the US dollar index has started the bounce exactly as expected. Price is now approaching the Tenkan-sen resistance at 93.80-93.90. A weekly close above this level will be a bullish sign. Next important resistance is at 94.40. Weekly support that must hold now is at 93. A break below 93 will be a very bearish sign for the index.
Ichimoku indicator analysis of gold for December 7, 2017
Gold price has reached our target area of $1,255-50. Price is showing bullish divergence signs in the 4 hour chart. Trend remains bearish as price is still below the Ichimoku cloud and both the Tenkan- and Kijun-sen.
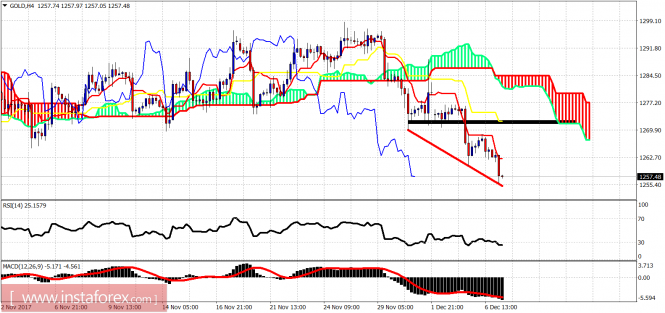
Gold price is making lower lows and lower highs. Trend is bearish. I believe it is time for bears to take some profits or tighten their stops. I believe a strong bounce towards at least $1,270 is imminent. Support is at $1,255-50. Resistance lies at $1,262. Upon a break above the short-term resistance, we can reach $1,270.
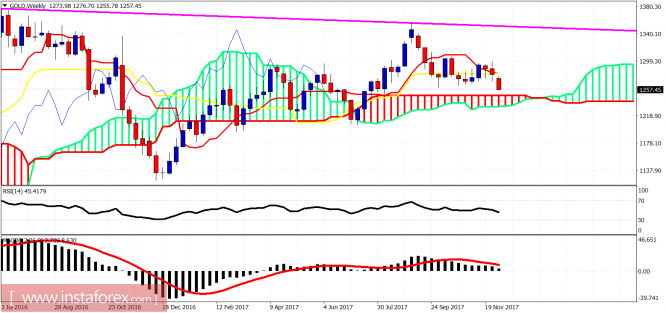
As said yesterday, gold price is expected to move towards the weekly Kumo (cloud) support. We are just 10$ away from that support. This is not the area where people should be selling gold. This is the time for bears to take their profits. A big upward reversal could be expected.
Get Bonus No Deposite in your Trading Account now and add this currency pair to your forex portfolio, enjoy your trading with us!


No comments:
Post a Comment