
The formation of the $35 range in the precious metals band is largely due to the pressure of two opposing groups of factors. On the one hand, the Fed's willingness to hike rates in the event of fiscal reform in the US leads to an increase in the yield of treasury bonds and the strengthening of the dollar, which gold is unable to compete with. On the other hand, in the context of uncertainty surrounding the overhaul of the tax system, the ceiling of the national debt, the relationship of the United States with North Korea, China and other countries that are ready to receive a mark of the currency manipulator from Washington, investors would naturally diversify their portfolios in favor of reliable assets.
Dynamics of gold and yield of US bonds
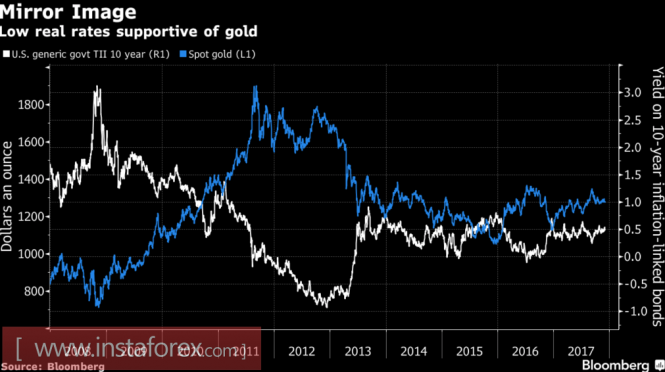
Quotes of the XAU/USD could grow more if fans of the physical asset did not switch to bitcoin and other cryptocurrencies in 2017.
As a result, the sale of coins by the American court fell to its lowest level since 2007. There is no consensus on medium and long-term prospects for gold from banks and investment companies. TD Securities believes that its average price in 2018 will be $1,313 per ounce, which is approximately 4% higher than the same indicator of the current year. Yes, the Fed will continue to hike the rate on federal funds, but this will unlikely strengthen the dollar, as other central banks will begin to normalize monetary policy. The tax reform will help accelerate inflation and reduce the real yield of US Treasury bonds, which is also a bullish factor for XAU/USD. Similar positions are held by HSBC Securities and CPM Group, expecting to see average prices at $1310 and $1322.
Current and average gold prices
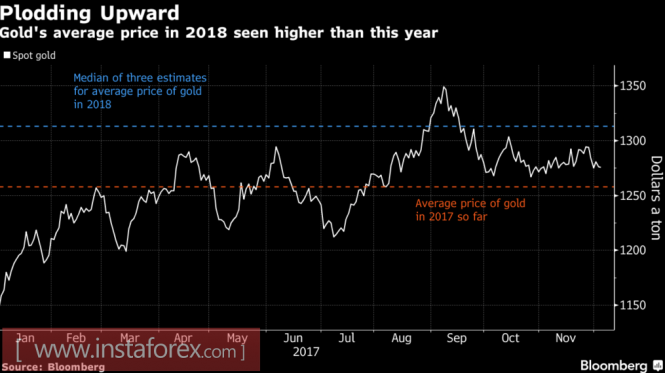
Source: Bloomberg.
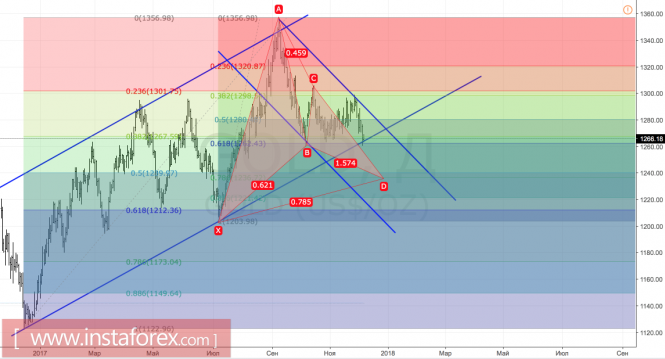
On the contrary, Citigroup and ABN Amro forecast $1,270 and $1,250 per ounce in 2018 due to improved health conditions of the US and the global economy, more aggressive actions by the Fed than the market is currently waiting for, and sluggish demand for jewelry in Asia. Therefore, both "bulls" and "bears" have quite serious arguments. On which of them will ultimately decide to use gold, and will determine its dynamics next year. Technically, the output of futures quotes outside the consolidation range of $1262-1302 and the breakthrough of diagonal support in the form of the lower border of the upward trading channel increases the risks of implementing the target by 78.6% on the Gartley pattern.
Gold, daily chart
Trading plan for the US session on December 7 EUR/USD and GBP/USD
To open long positions for EURUSD, it is required:
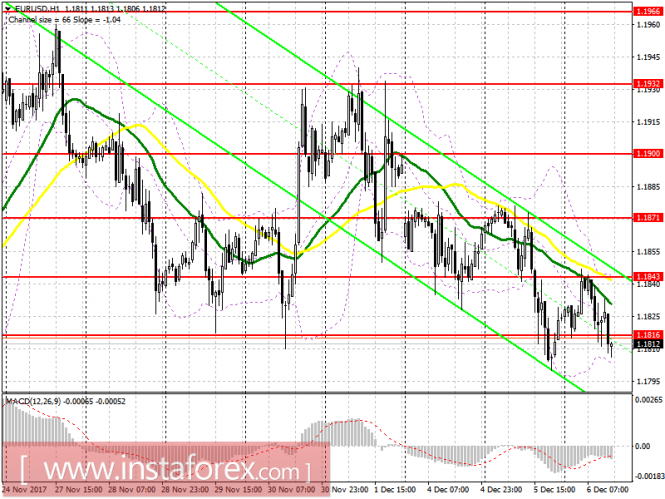
Buyers have not been able to set up the euro from the level of 1.1816, the breakdown of which will lead to the renewal of 1.1774. This is where I recommend that you open new long positions for the euro in the afternoon. In case the false breakdown is formed after updating yesterday's lows, you can count on a repeated rebound of the EUR/USD pair in the resistance area of 1.1843.
To open short positions for EURUSD, it is required: A break below 1.1816 will lead to a further decline in the European currency with a test of 1.1774 and a forecasted yield of 1.1737, where it is advised to lock in the profit for today. If after the update of the low of yesterday's morning quickly drops, the euro will not be considered. I advise that you postpone selling and wait for the EUR/USD pair to return to the resistance area of 1.1843.
GBP/USD
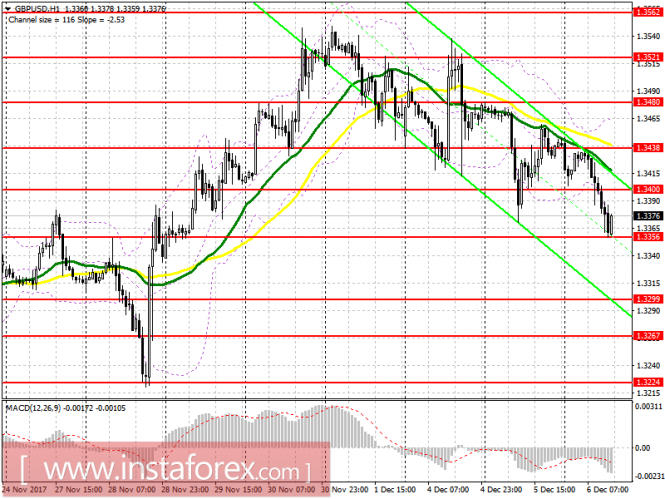
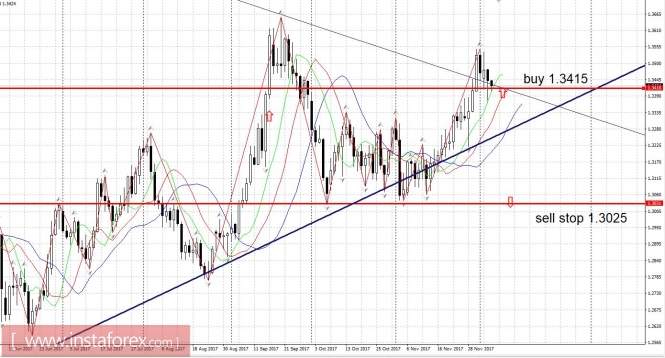
To open long positions for GBP/USD, it is required: Buyers of the pound expected to show themselves in the support area of 1.3356, but a larger rebound upwards from this level has not yet been seen. Only a second test with the formation of a false breakout at 1.3356 will signal a rise in long positions in the pound for a return and consolidation above 1.3400, with an update of 1.3438. In the event of a decline below 1.3356, it's best to go back to a rebound from 1.2399 in order to buy.
To open short positions for GBP/USD, it is required: A retest of 1.3356 may lead to a breakthrough of this level of support with a further decrease in the pound in the range of 1.3299, where it is advised to lock in profits. In the event of an unsuccessful consolidation below 1.3356, selling would be best done after the test of 1.3400 or on a rebound of 1.3438.
Indicator description
Moving Average (average sliding) 50 days - yellow
Moving Average (average sliding) 30 days - green
MACD: fast EMA 12, slow EMA 26, SMA
Bollinger Bands 20
Wave analysis of the USD/CHF currency pair for December 7, 2017
Analysis of wave counting: At the beginning of yesterday's European session, the USD/CHF pair was still able an attempt to resume the growth of quotations and, having updated the highs reached the previous day, at the end of the day, reached the mark of 0.9885. It can be assumed that the currency pair remained in the stage of formation of the first generating waves in the composition of the wave c, in a, in C, probably already indicating the beginning of its future 3rd wave. At the same time, fairly strong overbought indicators and the emerging divergence of MACD_aka indicate the possibility of resuming the downward movement to 0.9655, with the prospect of a significant complication of the internal wave structure of wave b, in a, in C.
Targets for an upward wave option: 1.0080 - 1.0100
Targets for a downward wave option: 0.9728 - 50.0% by Fibonacci
General conclusions and trading recommendations:
The currency pair continues to build an upward set of waves. The assumed wave b, in a, in C has completed its construction near the mark of 0.9728, which corresponds to 50.0% of Fibonacci. If this is the case, an extended increase in quotations is now expected with targets above parity.
Wave analysis of the GBP/USD currency pair for December 7, 2017
Analysis of wave counting:
As expected, yesterday's GBP/USD pair trades began with the continuation of the downward movement, however, failing to gain a foothold under the level of the 34th figure, finished the day at around 1.3440-1.3450. Thus, it seems that the currency pair was in the stage of formation of the third wave, in the composition of the future c, in the 4th, which did not yet seem to be completed by the close of the American session. At the same time, the emerging divergence of MACD_aka indicates a continuing probability of a renewed growth in quotations and an even greater complication of the internal wave structure of the 5th wave, in c, in b, in the 4th.
Targets for a downward wave option:
1.3065 - 38.2% by Fibonacci
1.2882 - 50.0% by Fibonacci
Targets for an upward wave option: 1.3538 - 161.8% by Fibonacci
1.3600
General conclusions and trading recommendations:
The construction of the downward wave 4 in the upward trend section continues. Now it is possible to resume the decline in the price of the trading instrument with targets near the estimated mark of 1.2882, which corresponds to 50.0% of Fibonacci, within the limits of wave c, in 4. Wave b, in 4 can still resume its construction, complicating its internal structure even more, with targets above the 1.3538 mark, which is equivalent to 161.8% Fibonacci.
Wave analysis of the EUR/USD currency pair for December 7, 2017
Analysis of wave counting:
Yesterday's EUR/USD pair trades began with the expected downward movement and, having lost more than 100 percentage points from the Asian session high, finished the day by testing the level of the 18th figure. At the same time, it can be assumed that the currency pair remained in the stage of formation of the near wave c, in a, in c, in a, in (C), whose estimated targets are possibly in the 1.1750 area. At the same time, a fairly strong divergence of MACD_aka indicates the possibility of a currency pair's renewal of the growth of quotations, with the prospect of a significant complication of the internal wave structure of wave b, in a, in (C).
Targets for a downward wave option:
1.1792 - 50.0% by Fibonacci 1.1736 - 38.2% by Fibonacci
Targets for an upward wave option:
1.1946 - 76.4% by Fibonacci
1.2000
General conclusions and trading recommendations:
The construction of the downward trend section continues. The assumed wave b, in a, in (C) has completed its construction. If this assumption is correct, then the decline in quotations will continue with the targets located near the estimated marks of 1.1792 and 1.1736, which corresponds to 50.0% and 38.2% Fibonacci within the assumed wave a, in c, in a, in (C), and below.
As a result, the sale of coins by the American court fell to its lowest level since 2007. There is no consensus on medium and long-term prospects for gold from banks and investment companies. TD Securities believes that its average price in 2018 will be $1,313 per ounce, which is approximately 4% higher than the same indicator of the current year. Yes, the Fed will continue to hike the rate on federal funds, but this will unlikely strengthen the dollar, as other central banks will begin to normalize monetary policy. The tax reform will help accelerate inflation and reduce the real yield of US Treasury bonds, which is also a bullish factor for XAU/USD. Similar positions are held by HSBC Securities and CPM Group, expecting to see average prices at $1310 and $1322.
Current and average gold prices
Source: Bloomberg.
On the contrary, Citigroup and ABN Amro forecast $1,270 and $1,250 per ounce in 2018 due to improved health conditions of the US and the global economy, more aggressive actions by the Fed than the market is currently waiting for, and sluggish demand for jewelry in Asia. Therefore, both "bulls" and "bears" have quite serious arguments. On which of them will ultimately decide to use gold, and will determine its dynamics next year. Technically, the output of futures quotes outside the consolidation range of $1262-1302 and the breakthrough of diagonal support in the form of the lower border of the upward trading channel increases the risks of implementing the target by 78.6% on the Gartley pattern.
Gold, daily chart
Trading plan for the US session on December 7 EUR/USD and GBP/USD
To open long positions for EURUSD, it is required:
Buyers have not been able to set up the euro from the level of 1.1816, the breakdown of which will lead to the renewal of 1.1774. This is where I recommend that you open new long positions for the euro in the afternoon. In case the false breakdown is formed after updating yesterday's lows, you can count on a repeated rebound of the EUR/USD pair in the resistance area of 1.1843.
To open short positions for EURUSD, it is required: A break below 1.1816 will lead to a further decline in the European currency with a test of 1.1774 and a forecasted yield of 1.1737, where it is advised to lock in the profit for today. If after the update of the low of yesterday's morning quickly drops, the euro will not be considered. I advise that you postpone selling and wait for the EUR/USD pair to return to the resistance area of 1.1843.
GBP/USD
To open long positions for GBP/USD, it is required: Buyers of the pound expected to show themselves in the support area of 1.3356, but a larger rebound upwards from this level has not yet been seen. Only a second test with the formation of a false breakout at 1.3356 will signal a rise in long positions in the pound for a return and consolidation above 1.3400, with an update of 1.3438. In the event of a decline below 1.3356, it's best to go back to a rebound from 1.2399 in order to buy.
To open short positions for GBP/USD, it is required: A retest of 1.3356 may lead to a breakthrough of this level of support with a further decrease in the pound in the range of 1.3299, where it is advised to lock in profits. In the event of an unsuccessful consolidation below 1.3356, selling would be best done after the test of 1.3400 or on a rebound of 1.3438.
Indicator description
Moving Average (average sliding) 50 days - yellow
Moving Average (average sliding) 30 days - green
MACD: fast EMA 12, slow EMA 26, SMA
Bollinger Bands 20
Wave analysis of the USD/CHF currency pair for December 7, 2017
Analysis of wave counting: At the beginning of yesterday's European session, the USD/CHF pair was still able an attempt to resume the growth of quotations and, having updated the highs reached the previous day, at the end of the day, reached the mark of 0.9885. It can be assumed that the currency pair remained in the stage of formation of the first generating waves in the composition of the wave c, in a, in C, probably already indicating the beginning of its future 3rd wave. At the same time, fairly strong overbought indicators and the emerging divergence of MACD_aka indicate the possibility of resuming the downward movement to 0.9655, with the prospect of a significant complication of the internal wave structure of wave b, in a, in C.
Targets for an upward wave option: 1.0080 - 1.0100
Targets for a downward wave option: 0.9728 - 50.0% by Fibonacci
General conclusions and trading recommendations:
The currency pair continues to build an upward set of waves. The assumed wave b, in a, in C has completed its construction near the mark of 0.9728, which corresponds to 50.0% of Fibonacci. If this is the case, an extended increase in quotations is now expected with targets above parity.
Wave analysis of the GBP/USD currency pair for December 7, 2017
Analysis of wave counting:
As expected, yesterday's GBP/USD pair trades began with the continuation of the downward movement, however, failing to gain a foothold under the level of the 34th figure, finished the day at around 1.3440-1.3450. Thus, it seems that the currency pair was in the stage of formation of the third wave, in the composition of the future c, in the 4th, which did not yet seem to be completed by the close of the American session. At the same time, the emerging divergence of MACD_aka indicates a continuing probability of a renewed growth in quotations and an even greater complication of the internal wave structure of the 5th wave, in c, in b, in the 4th.
Targets for a downward wave option:
1.3065 - 38.2% by Fibonacci
1.2882 - 50.0% by Fibonacci
Targets for an upward wave option: 1.3538 - 161.8% by Fibonacci
1.3600
General conclusions and trading recommendations:
The construction of the downward wave 4 in the upward trend section continues. Now it is possible to resume the decline in the price of the trading instrument with targets near the estimated mark of 1.2882, which corresponds to 50.0% of Fibonacci, within the limits of wave c, in 4. Wave b, in 4 can still resume its construction, complicating its internal structure even more, with targets above the 1.3538 mark, which is equivalent to 161.8% Fibonacci.
Wave analysis of the EUR/USD currency pair for December 7, 2017
Analysis of wave counting:
Yesterday's EUR/USD pair trades began with the expected downward movement and, having lost more than 100 percentage points from the Asian session high, finished the day by testing the level of the 18th figure. At the same time, it can be assumed that the currency pair remained in the stage of formation of the near wave c, in a, in c, in a, in (C), whose estimated targets are possibly in the 1.1750 area. At the same time, a fairly strong divergence of MACD_aka indicates the possibility of a currency pair's renewal of the growth of quotations, with the prospect of a significant complication of the internal wave structure of wave b, in a, in (C).
Targets for a downward wave option:
1.1792 - 50.0% by Fibonacci 1.1736 - 38.2% by Fibonacci
Targets for an upward wave option:
1.1946 - 76.4% by Fibonacci
1.2000
General conclusions and trading recommendations:
The construction of the downward trend section continues. The assumed wave b, in a, in (C) has completed its construction. If this assumption is correct, then the decline in quotations will continue with the targets located near the estimated marks of 1.1792 and 1.1736, which corresponds to 50.0% and 38.2% Fibonacci within the assumed wave a, in c, in a, in (C), and below.
Trading plan 12/07/2017
Trading plan 12/07/2017 General picture: Markets are waiting for reports on US employment.
The report on business activity in the US services sector for November (ISM index) came well below the forecast (reading is 57, forecast is 60).
Still, the US and EU economies are in strong shape. At the same time, inflation is low, which excludes (so far) the sharp movements of the main securities.
Markets are preparing to leave for the winter holidays - but before that they are ready to play out the decisions of the Fed and the ECB (next week).
And today and on Friday the main thing is the reports on employment in the USA (on Wednesday the report from ADP at 12:15 pm London Time).
Euro: An important level of 1.1807 has been break through - but did not go down.
Enter down from 1.1799 Or upward from 1.1880 GBPUSD: Trend upward, buy from rebound.
still some sellers left?
07 December 2017, USD/JPY
Technical Observation:
Last week's candle was a bullish engulfing candle and meant that the price was to rise but until now, bears still appears to have some strength left. I still expect a rise towards 114.10 and even a breakout above 114.82 to continue higher towards 118.00. As it is on the weekly chart above, only buy positions look more ideal, but if you're a skeptic to buy now, you could wait and buy above 114.82, or sell upon a rejection from 114.10-114.82 with you take profit at 108.61.
Technical Levels
Resistance levels
R1: 113.1
R2: 114
R3: 116.04
Pivot
111.97
Support Levels
S1: 107.9
S2: 109.94
S3: 111.06
Trade Signal
Look for a buy trade towards 114.10
111.97
Support Levels
S1: 107.9
S2: 109.94
S3: 111.06
Trade Signal
Look for a buy trade towards 114.10
Get Bonus No Deposite in your Trading Account now and add this currency pair to your forex portfolio, enjoy your trading with us!


No comments:
Post a Comment