
2017-12-06

Monthly Outlook
In January 2015, the EUR/USD pair moved below the major demand levels near 1.2050-1.2100 (multiple previous bottoms set in July 2012 and June 2010). Hence, a long-term bearish target was projected toward 0.9450.
In March 2015, EUR/USD bears challenged the monthly demand level around 1.0500, which had been previously reached in August 1997.
In the longer term, the level of 0.9450 remains a projected target if any monthly candlestick achieves bearish closure below the depicted monthly demand level of 1.0500.
However, the EUR/USD pair has been trapped within the depicted consolidation range (1.0500-1.1450) until the current bullish breakout was executed above 1.1450.
The current bullish breakout above 1.1450 allowed a quick bullish advance towards 1.2100 where recent evidence of bearish rejection was expressed (Note the previous Monthly candlestick of September).

Daily Outlook
In January 2017, the previous downtrend was reversed when the Inverted Head and Shoulders pattern was established around 1.0500. Since then, evident bullish momentum has been expressed on the chart.
As anticipated, the ongoing bullish momentum allowed the EUR/USD pair to pursue further bullish advance towards 1.1415-1.1520 (Previous Daily Supply-Zone).
The daily supply zone failed to pause the ongoing bullish momentum. Instead, evident bullish breakout was expressed towards the price level of 1.2100 where the depicted Head and Shoulders reversal pattern was expressed.
If the recent bearish breakout persists below 1.1700 (Neckline of the reversal pattern), a quick bearish decline should be expected towards the price zone of 1.1415-1.1520 (Initial targets for the depicted H&S pattern).
Bearish target for the depicted Head and Shoulders pattern extends towards 1.1350. However, to pursue towards the mentioned target level, significant bearish pressure is needed to be applied against the mentioned zone (1.1415-1.1520).
However, recent price action around the price zone of 1.1520-1.1415 indicated evident bullish recovery. This hindered further bearish decline as long as the recent low around 1.1550 remains unbroken.
Trade Recommendations
The price levels around 1.1900-1.1950 should be watched for a possible short-term SELL entry if the current signs of bearish rejection are maintained.
S/L should be placed above 1.1970. T/P levels to be located at 1.1850, 1.1700 and 1.1590.
NZD/USD Intraday technical levels and trading recommendations for December 6, 2017
2017-12-06

Daily Outlook
A recent bullish breakout above the downtrend line took place on May 22. Since then, the market has been bullish as depicted on the chart.
This resulted in a quick bullish advance towards next price zones around 0.7150-0.7230 (Key-Zone) and 0.7310-0.7380 which was temporarily breached to the upside.
Recent bearish pullback was executed towards the price zone of 0.7310-0.7380 (newly-established demand-zone) which failed to offer enough bullish support for the NZD/USD pair.
Re-consolidation below the price level of 0.7300 enhanced the bearish side of the market. This brought the NZD/USD pair again towards 0.7230-0.7150 (Key-Zone) which failed to pause the ongoing bearish momentum.
An atypical Head and Shoulders pattern was expressed on the depicted chart which initiated bearish reversal.
As expected, the price level of 0.7050 failed to offer enough bullish support for the NZD/USD pair. That's why, further bearish decline was expected towards 0.6800 (Reversal pattern bearish target).
Evident signs of bullish recovery was expressed around the recent low (0.6780). That's why, a bullish pullback was expected towards 0.7050.
On the other hand, an inverted Head and Shoulders pattern is being established on the chart indicating bullish reversal.
That's why, the price zone of 0.6800-0.6830 can be considered for a short-term BUY entry. S/L should be placed below 0.6770. T/P level remains projected towards 0.7050.
Trading Plan for EUR/USD and US Dollar Index for December 06, 2017
2017-12-06

Technical outlook:
The EUR/USD short-term story remains intact for now. The pair has found intraday support at fibonacci 0.382 levels as seen here, price being 1.1800. A slight probable change in the wave structure has been shown here as wave x, which could be a counter trend towards 1.1900 levels before turning lower again. As an alternate though, the entire drop from 1.1960 through 1.1800 levels could be considered as a flat as well, and in that case, a rally should unfold from here. In either case, a potential push higher, at least towards 1.1900, could be seen from current levels before the pair turns bearish again. A continued drop below 1.1800 levels should keep the interim bearish structure intact hence a safe way to trade for now would be to remain short or look to sell on rallies. Please note 1.1700 levels are still possible either from current levels or from 1.1900.
Trading plan:
Conservative strategy would be to remain short and also look to sell higher again around 1.1900 with risk above 1.1960. An aggressive way to trade would be to go long now, risk below 1.1790, target 1.1880/1.1900.
US Dollar Index chart setups:
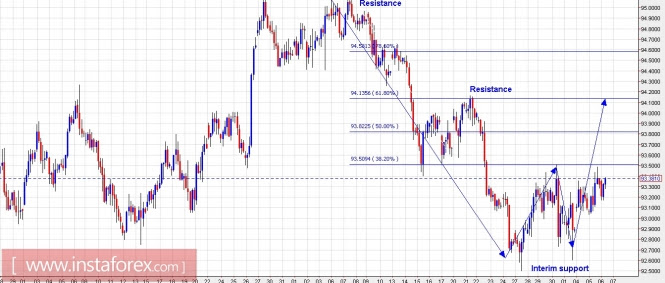
Technical outlook:
The US Dollar Index short-term outlook remains intact with bulls poised to push higher through 94.10 levels from here. There could be a slight pullback ahead of 92.60 levels, but the bullish outlook remains unchanged till prices remain broadly above 92.50 levels going forward. Please note that we are just looking for a counter-trend rally towards 94.10 levels which also coincides with Fibonacci 0.618 resistance of the drop between 95.10 through 92.60 levels respectively. But if prices do break above 94.10 levels, it could easily reach 95.00 and higher levels in the coming days.A simple and safe trading strategy from here would be to go long on dips till prices stay above 92.50 levels. A break below 92.50 levels could change the short term wave structure.
Trading plan:
Remain long for now and also look to buy on dips, stop below 92.50, the target is 94.20.
Fundamental outlook:
Watch out for Bank of Canada rate decision at 1000 AM EST.
Good luck!
Get Bonus No Deposite in your Trading Account now and add this currency pair to your forex portfolio, enjoy your trading with us!


No comments:
Post a Comment