
2018-01-17

NZD/USD is under pressure and expected to continue its downside movement. The pair remains capped by its falling 50-period moving average and is likely to test its next support at 0.7250. The nearest resistance at 0.7290 maintains the strong selling pressure on the prices. Last but not least, the relative strength index is mixed to bearish below its neutrality area at 50.
To sum up, as long as 0.7290 is resistance, look for a new pullback to 0.7220 and 0.7190 in extension.
The black line shows the pivot point. Currently, the price is above the pivot point, which is a signal for long positions. If it remains below the pivot point, it will indicate short positions. The red lines are showing the support levels, while the green line is indicating the resistance levels. These levels can be used to enter and exit trades.
Resistance levels: 0.7315, 0.7335, and 0.7375.
Support levels: 0.7220, 0.7190, and 0.7150.
Technical analysis of GBP/JPY for January 17, 2018
2018-01-17
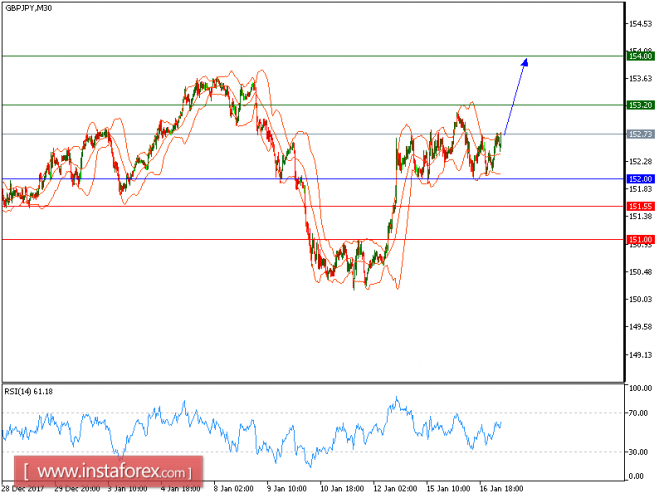
Our first target which we predicted in the previous analysis has been hit. The pair is bouncing off its rising trend line support and has also broken above its key horizontal level at 152.00. The upside potential has been opened now toward 1.3920. In addition, a bullish cross has been identified between the 20-period and 50-period moving averages.
In which case, as long as 152.00 isn't broken, likely advance to 153.20 and 154.00 in extension.
Alternatively, if the price moves in the direction opposite to the forecast, a short position is recommended below 152.00 with the target at 151.55
Strategy: BUY, stop loss at 152.00, take profit at 153.20
Chart Explanation: the black line shows the pivot point. The price above the pivot point indicates long positions; and when it is below the pivot point, it indicates short positions. The red lines show the support levels and the green line indicates the resistance levels. These levels can be used to enter and exit trades.
Resistance levels: 153.20, 154.00, and 154.50.
Support levels: 151.55, 151.00, and 150.45
Technical analysis of USD/CHF for January 17, 2018
2018-01-17

All our downside targets which we predicted in yesterday's analysis have been hit. The pair extended its losses last night and is heading downward, without showing any reversal signal. The process of lower highs and lows remains intact, which should confirm a negative outlook. In addition, the relative strength index is bearish below its neutrality area at 50.
To conclude, as long as 0.9660 is resistance, likely decline to 0.9570 and 0.9550 in extension.
Chart Explanation: The black line shows the pivot point. The present price above the pivot point indicates a bullish position, and the price below the pivot point indicates a short position. The red lines show the support levels and the green line indicates the resistance levels. These levels can be used to enter and exit trades.
Strategy: Sell, stop loss at 0.9660, take profit at 0.950.
Resistance levels: 0.9700, 0.9725, and 0.9770
Support levels: 0.9570, 0.9550, and 0.9520.
Technical analysis of USD/JPY for January 17, 2018
2018-01-17

Our first downside target which we predicted in the previous analysis has been hit. The pair is capped by a declining trend line since Jan. 8, which confirmed a bearish outlook. The 20-period moving average is playing a resistance role. The relative strength index is also capped by a descending trend line since Jan. 16.
To sum up, below 111.20, look for a further drop with targets at 110.45 and 110.00 in extension.
Alternatively, if the price moves in the opposite direction, a long position is recommended above 111.20 with a target of 111.45.
Chart Explanation: The black line shows the pivot point. The current price above the pivot point indicates a bullish position, while the price below the pivot point is a signal for a short position. The red lines show the support levels and the green line indicates the resistance level. These levels can be used to enter and exit trades.
Strategy: SELL, stop loss at 111.20, take profit at 110.45.
Resistance levels: 111.45, 111.75, and 112.05
Support levels: 110.45, 110.00, and 109.65.
Elliott wave analysis of EUR/JPY for January 17, 2018
2018-01-17

Wave summary:
No change in our view.
We are looking for a break below minor support at 134.95 to confirm that wave B has completed and wave C lower to 131.11 is developing. Short-term a re-test of the resistance at 136.10 could be seen, but this resistance is expected to cap the upside for a break below 134.95 confirming more downside pressure is developing.
R3: 136.64
R2: 136.32
R1: 136.10
Pivot: 135.25
S1: 134.95
S2: 134.80
S3: 134.35
Trading recommendation:
We are short EUR from 134.74 with stop placed at 136.75. Upon a break below 135.00 we will move our stop lower to 136.15.
Elliott wave analysis of EUR/NZD for January 17, 2018
2018-01-17

Wave summary:
EUR/NZD has now seen a nice five wave rally from the 1.6518 low. A short-term top should be near for a corrective decline in wave ii to at least 1.6800 and possibly even closer to 1.6680 before the next impulsive rally higher to 1.7479 on the way towards 1.7777.
A break below 1.6850 will confirm wave i has completed and wave ii is developing.
R3: 1.7025
R2: 1.6972
R1: 1.6937
Pivot: 1.6850
S1: 1.6765
S2: 1.6709
S3: 1.6690
Trading recommendation:
We are long EUR from 1.6670 and we will raise our stop to 1.6845. We took half profit at 1.6875 for a nice 205 pips profit and we will close to rest of the position at 1.6950.
Technical analysis of gold for January 17, 2018
2018-01-17
Gold price has pulled back from its recent highs at $1,344 as the bearish divergence signs suggested it would. It now remains to be seen how deep this pull back will be. Short-term trend remains bullish as long as price is above $1,309.

Red lines - bearish divergence signs
Green line - support
Short-term support is found at $1,325 and next at $1,316-$1,309. Price has most probably completed the entire rise from $1,237. It is time for a correction. Important levels to watch out for apart from $1,309 are at $1,280 and $1,250.

Magenta line - resistance
Blue line - support
On a weekly basis, we have come very close to the long-term resistance of $1,250. A rejection here will be a bearish sign. However only a weekly close below $1,290 could push price towards $1,250 where the Ichimoku cloud support is found or even towards the blue long-term trend line support at $1,210.
Green line - support
Short-term support is found at $1,325 and next at $1,316-$1,309. Price has most probably completed the entire rise from $1,237. It is time for a correction. Important levels to watch out for apart from $1,309 are at $1,280 and $1,250.
Magenta line - resistance
Blue line - support
On a weekly basis, we have come very close to the long-term resistance of $1,250. A rejection here will be a bearish sign. However only a weekly close below $1,290 could push price towards $1,250 where the Ichimoku cloud support is found or even towards the blue long-term trend line support at $1,210.
Get Bonus No Deposite in your Trading Account now and add this currency pair to your forex portfolio, enjoy your trading with us!


No comments:
Post a Comment