
2018-02-14

Monthly Outlook
In January 2015, the EUR/USD pair moved below the major demand levels near 1.2050-1.2100 (multiple previous bottoms set in July 2012 and June 2010). Hence, a long-term bearish target was projected toward 0.9450.
In March 2015, EUR/USD bears challenged the monthly demand level around 1.0500, which had been previously reached in August 1997.
In the longer term, the level of 0.9450 remains a projected target if any monthly candlestick achieves bearish closure below the depicted monthly demand level of 1.0500.
However, the EUR/USD pair has been trapped within the depicted consolidation range (1.0500-1.1450) until the current bullish breakout was executed above 1.1450 and recently above 1.2075.
Another bullish breakout above 1.2250 was expressed on the chart. This hinders the bearish momentum allowing bullish advancement to occur towards 1.2750.
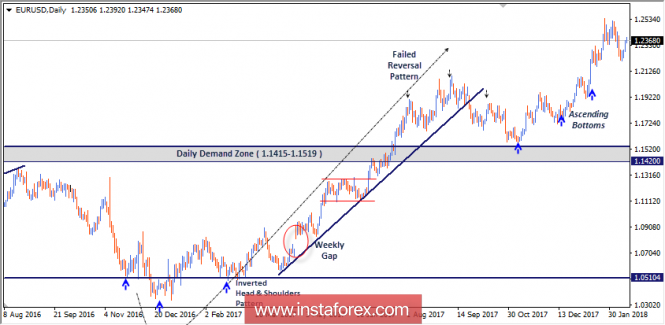
Daily Outlook
In September, a bearish target for the depicted Head and Shoulders pattern was projected towards 1.1350. However, the market failed to apply significant bearish pressure against the mentioned zone (1.1415-1.1520).
Instead, in November, evident bullish recovery was manifested around the price zone of 1.1520-1.1415.
This hindered further bearish decline which allowed the current bullish momentum to occur towards the price level of 1.2100 which failed to pause the ongoing bullish momentum as well.
Daily persistence above 1.2470-1.2500 is needed to confirm a recent bullish flag continuation pattern with projected targets towards 1.2750.
However, a recent bearish pullback was being expressed below the price level of 1.2350. This may extend towards 1.2070 if a bearish breakdown of the level of 1.2200 is achieved on a daily basis.
NZD/USD Intraday technical levels and trading recommendations for February 14, 2018
2018-02-14

Daily Outlook
In July 2017, an atypical Head and Shoulders pattern was expressed on the depicted chart which indicated upcoming bearish reversal.
As expected, the price level of 0.7050 failed to offer enough bullish support for the NZD/USD pair. That's why, further bearish decline was expected towards 0.6800 (Reversal pattern bearish target).
Evident signs of bullish recovery was expressed around the depicted low (0.6780). An inverted Head and Shoulders pattern was expressed around these price levels.
The price zone of 0.7140-0.7250 (prominent Supply-Zone) failed to pause the ongoing bullish momentum. Instead, a bullish breakout above 0.7250 was expressed on January 11.
That's why, the current bullish movement extended towards the price levels of 0.7320 and 0.7390.
A quick bullish movement was expected towards the depicted supply zone (0.7320-0.7390) where evident bearish rejection and a valid SELL entry were expected.
On February 2, a bearish engulfing daily candlestick was expressed. This enhances the bearish scenario initially towards the price levels of 0.7230 - 0.7165 where recent bullish recovery was expressed.
Bearish fixation below 0.7160 is needed to allow a further decline towards 0.7090.
On the other hand, the price zone (0.7320-0.7390) remains a significant supply zone to be watched for possible bearish rejection and another SELL entry. Stop Loss should be placed above 0.7400.
Technical analysis of NZD/USD for February 14, 2018
2018-02-14

Our first upside target which we predicted in yesterday's analysis has been hit. NZD/USD is expected to trade with a bullish outlook above 0.7285. The pair is supported by an upward trend line since February 8, which confirmed a bullish outlook. The relative strength index is above its neutrality level at 50. A support base at 0.7265 has formed and has allowed for a temporary stabilization.
Hence, above 0.7285, look for a further advance with targets at 0.7350 and 0.7380 in extension.
The black line shows the pivot point. Currently, the price is above the pivot point, which is a signal for long positions. If it remains below the pivot point, it will indicate short positions. The red lines show the support levels, while the green line indicates the resistance levels. These levels can be used to enter and exit trades.
Resistance levels: 0.7325, 0.7355, and 0.7385.
Support levels: 0.7225, 0.7200, and 0.7175.
Technical analysis of GBP/JPY for February 14, 2018
2018-02-14

Our first target which we predicted in previous analysis has been hit. The pair retreated and broke below the 20-period moving average after failing to penetrate above the key resistance at 149.85. The relative strength index is below its neutrality level at 50 and lacks upward momentum.
Hence, as long as 149.85 holds on the upside, look for a new drop with targets at 148.40 and 147.80 in extension.
Alternatively, if the price moves in the direction opposite to the forecast, a long position is recommended to be above 149.85 with the target at 150.80.
Strategy: SELL, Stop loss at 149.85, Take profit at 148.40
Chart Explanation: the black line shows the pivot point. The price above the pivot point indicates long positions; and when it is below the pivot point, it indicates short positions. The red lines show the support levels, and the green line indicates the resistance levels. These levels can be used to enter and exit trades.
Resistance levels: 150.80, 152.10, and 153.00
Support levels: 148.40, 147.80, and 147.00.
Analysis of Gold for February 14, 2018
2018-02-14
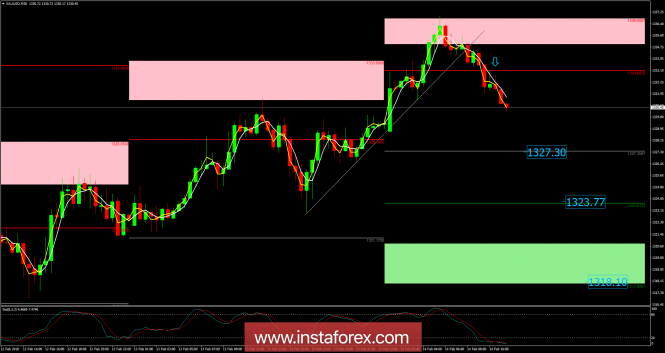
Recently, the Gold has been trading upwards. The price tested the level of $1,336.97. Anyway, according to the 30M time - frame, I found that price has broke the upward trednline, which is sign that buying looks risky. I also found a successful rejection of pivot resistance 2 at the prrice of $1,336.80. My advice is to watch for potential selling opportunities. The downward targets are set at the price of $1,327.30, $1,323.75 and at the price of $1,318.10.
Resistance levels:
R1: $1,333.08
R2: $1.336.80
R3: $1,342.53
Support levels:
S1: $1,323.75
S2: $1,318.10
S3: $1,314.20
Trading recommendations for today: watch for potential selling opportunities.
USD/JPY analysis fo February 14, 2018
2018-02-14

Recently, the USD/JPY pair has been trading downwards. The price tested the level of 106.85. According to the 30M time - frame, I found a successful breakout of support at the price of 107.40, which is a sign that sellers are in control. I also found an overbought condition on the stochastic oscillator, which is another sign of weakness. My advice is to watch for potential selling opportunities. The downward targets are set at the price of 106.65 and at the price of 105.85.
Resistance levels:
R1: 108.60
R2: 109.37
R3: 109.95
Support levels:
S1: 107.22
S2: 106.62
S3: 105.85
Trading recommendations for today: watch for potential selling opportunities.
Technical analysis of NZD/USD for February 14, 20182018-02-14

Overview:
The NZD/USD pair is still trading upwards above the level of 0.7213 on the H4 chart. Today, the first resistance level is seen at 0.7359 followed by 0.7394, while the daily support 1 is seen at 0.7213 (38.2% Fibonacci retracement). According to the previous events, the NZD/USD pair is still moving between the levels of 0.7255 and 0.7359; so we expect a range of 104 pips. Furthermore, if the trend is able to break out through the pivot point at 0.7298, it should see the pair climbing towards the first resistance (0.7359) to test it. Therefore, buy above the level of 0.7298 with the first target at 0.7359 in order to test the daily resistance 1 and further to 0.7394. Also, it might be noted that the level of 0.7394 is a good place to take profit. On the other hand, in case a reversal takes place, and the NZD/USD pair breaks through the support level of 0.7213, a further decline to 0.7157 can occur which would indicate a bearish market.
Technical analysis of USD/CHF for February 14, 2018
2018-02-14

USD/CHF is expected to trade with a bearish outlook as far as 0.9355 is resistance. Despite the recent rebound, the pair is still trading below the declining 50-period moving average, which is playing a resistance role. Even though a continuation of the technical rebound cannot be ruled out, its extent should be limited.
Therefore, as long as 0.9355 is not surpassed, look for a new decline with targets at 0.9300 and 0.9275 in extension.
Chart Explanation: The black line shows the pivot point. The present price above the pivot point indicates a bullish position, and the price below the pivot point indicates a short position. The red lines show the support levels, and the green line indicates the resistance levels. These levels can be used to enter and exit trades.
Strategy: SELL, stop loss at 0.9355, take profit at 0.9300.
Resistance levels: 0.9400, 0.9440, and 0.9480
Support levels: 0.9300, 0.9275, and 0.9240.
Technical analysis of USD/CHF for February 14, 2018
2018-02-14

Overview:
The USD/CHF pair will continue to rise from the level of 0.9300. The support is found at the level of 0.9255, which represents the double bottom level on the H1 and H4 charts. The price is likely to form a double bottom. Today, the major support is seen at 0.9255, while immediate resistance is seen at 0.9399. Accordingly, the USD/CHF pair is showing signs of strength following a breakout of a high at 0.9399. So, buy above the level of 0.9300 with the first target at 0.9399 in order to test the daily resistance 1 and move further to 0.9444. Also, the level of 0.9444 is a good place to take profit because it will form a double top. Amid the previous events, the pair is still in an uptrend; for that we expect the USD/CHF pair to climb from 0.9300 to 0.9444 today. At the same time, in case a reversal takes place and the USD/CHF pair breaks through the support level of 0.9300, a further decline to 0.9255 can occur, which would indicate a bearish market.

Technical analysis of USD/JPY for February 14, 2018
2018-02-14

All our targets which we predicted in yesterday's analysis have been hit. The pair is rebounding from a low of 107.39 seen yesterday (February 13) but remains capped by the key resistance at 108.20. Though the relative strength index has climbed to the neutrality level at 50, showing a lack of downward momentum for the pair, intraday bearishness is still maintained by the descending 50-period moving average.
In case the current rebound loses steam failing to push the pair through the key resistance at 107.85, a return to 106.80 is expected.
Alternatively, if the price moves in the opposite direction, a long position is recommended to be above 107.85 with a target of 108.20.
Chart Explanation: The black line shows the pivot point. The current price above the pivot point indicates a bullish position, while the price below the pivot point is a signal for a short position. The red lines show the support levels, and the green line indicates the resistance level. These levels can be used to enter and exit trades.
Strategy: SELL, stop loss at 107.85, take profit at 106.80.
Resistance levels: 108.20, 108.5, and 108.85
Support levels: 10.30, 107.05, and 106.75.
Get Bonus No Deposite in your Trading Account now and add this currency pair to your forex portfolio, enjoy your trading with us!


No comments:
Post a Comment