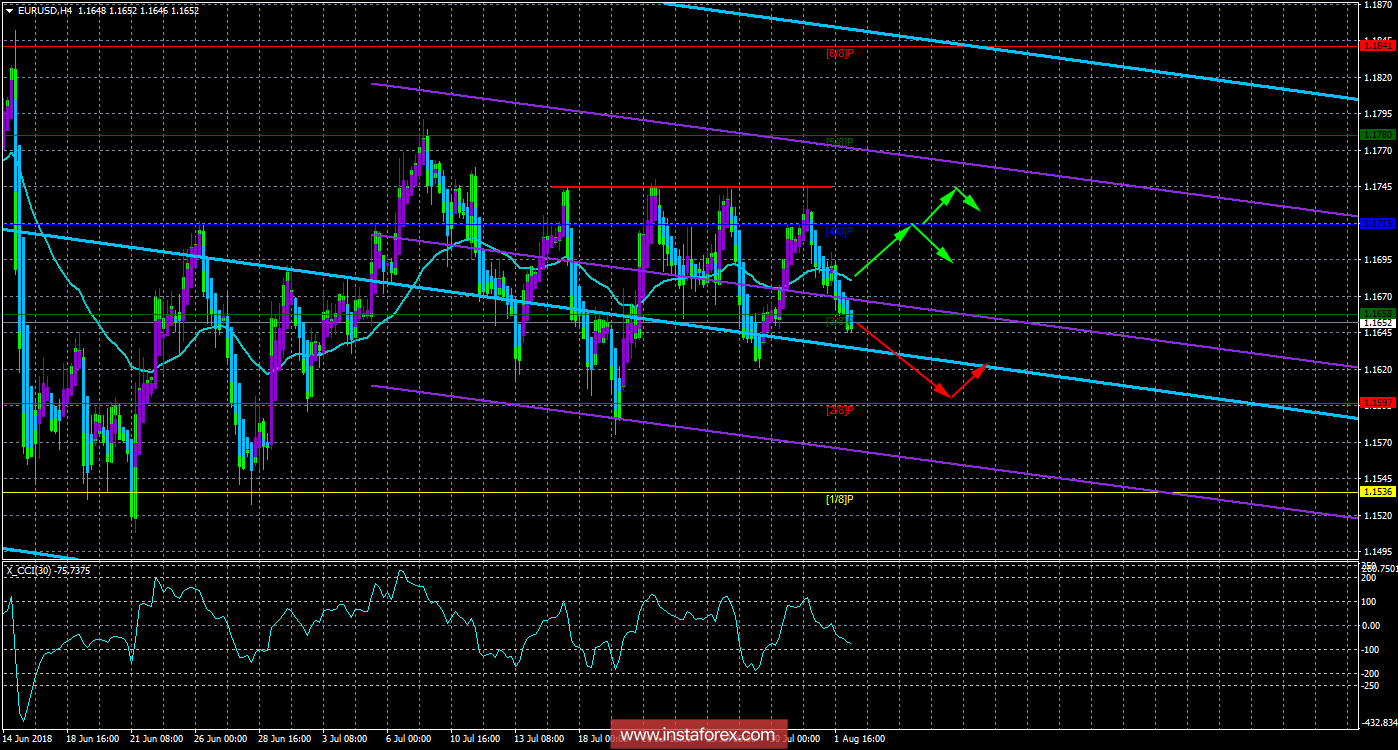
4-hour timeframe:

Technical data: The senior channel of linear regression: direction - down. The younger channel of linear regression: direction - down. Moving average (20, smoothed) - down. СCI: -75.7375
The currency pair EUR / USD on August 1 continued a slight downward movement, as indicated by the blue bars of the indicator Heikin Ashi. The Fed meeting was extremely boring. The key rate of the Fed remained unchanged in the range of 1.75% - 2.00%, which, in principle, was expected. In the accompanying statement of the regulator, there were good growth rates of the economy and a stable state of the labor market. Thus, nothing that could stir up the markets and make traders act more actively did not sound. Most experts agree that the rate will be raised at the next meeting of the Fed. The probability of this at the moment is about 90%. Thus, the "swing" in the market, at least on the EUR / USD instrument, may persist in the coming days. In the near future, the pair may fall to the level of 1.1620, about which a turn may occur upward. Traders, however, have to wait for new information from Trump, Draghi and new macroeconomic reports from the US and Europe, which today are not scheduled for any (important). Thus, today the volatility of the instrument may remain low and only the Bank of England can introduce some disharmony in the current state of things.
Nearest support levels:
S1 - 1.1597
S2 - 1.1536
S3 - 1.1475
Nearest resistance levels:
R1 = 1.1658
R2 = 1.1719
R3 = 1.1780
Trading recommendations: The currency pair EUR / USD was fixed below the moving average line. Thus, today it is recommended to stay in short positions or open new ones with the targets of 1.1620 and 1.1597. Near the level of 1.1620 there can be a technical turn of the pair.
It is recommended to open a buy order not earlier than consolidating the bulls above the moving average line with the targets of 1,1719 and 1,1745. In this case, for some time, the initiative will go to the bulls, but in general, the "swing" on the instrument is preserved.
In addition to the technical picture, one should also take into account the fundamental data and the time of their release.
Explanations for illustrations: The upper channel of linear regression is the blue lines of unidirectional motion. The lowest linear regression channel is the violet lines of unidirectional motion. CCI - the blue line in the indicator window. Moving average (20; smoothed) - the blue line on the price chart. Levels of Murray - multi-colored horizontal stripes. Heikin Ashi is an indicator that color bars in blue or purple.


No comments:
Post a Comment