Forex analysis review |
- Analysis of Gold for March 18, 2019
- Bitcoin analysis for March 18, 2019
- March 18, 2019 : EUR/USD Bearish opportunity around upper border of trend channel.
- March 18, 2019 : GBP/USD Intraday technical levels and trade recommendations.
- Technical analysis of AUD/USD for March 18, 2019
- Technical analysis of EUR/USD for March 18, 2019
- Analysis of EUR/USD divergence for March 18: pair is ready to continue moderate growth
- Analysis of GBP / USD divergence for March 18. Market sentiment on GBP unclear
- Trading Plan for 03/18/2019
- Burning Forecast 03/18/2019
- Market activity slows down before FOMC meeting
- Technical analysis for EUR/USD for March 18, 2019
- Technical analysis for Gold for March 18, 2019
- Elliott Wave analysis of Ethereum for 18/03/2019
- Elliott Wave analysis of Bitcoin for 18/03/2019
- Technical analysis of EUR/USD for 18/03/2019
- Technical analysis of GBP/USD for 18/03/2019
- Trading plan for EUR/USD for March 18, 2019
- Technical analysis: Intraday Levels For EUR/USD, Mar 18, 2019
- Technical analysis: Intraday levels for USD/JPY, Mar 18, 2019
- NZD/CAD approaching resistance, potential drop!
- USD/CHF approaching support, potential bounce!
- BITCOIN Analysis for March 18, 2019
- Fundamental Analysis of EUR/USD for March 18, 2019
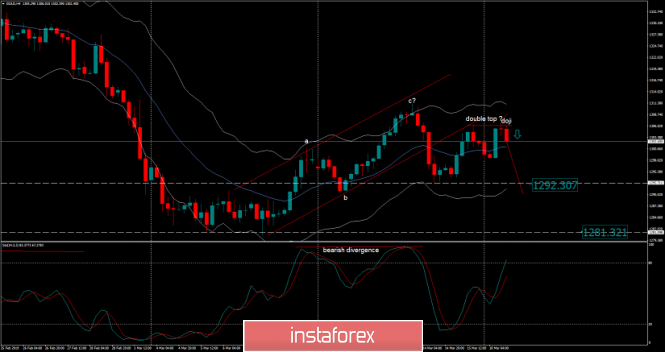
| Analysis of Gold for March 18, 2019 Posted: 18 Mar 2019 10:08 AM PDT Gold has been trading sideways at the price of $1.302.00. Potential double top formation is in creation.
According to the H4 timeframe, we have found potential end of the upward correction (abc flat) in the background. It signals the opportunity for the bearish trend to continue. There is also a potential double top formed at the price of $1.306.00 and the doji candle on the test suggesting no demand for the Gold. We expect the price to test the swing low at $1.292.30 and $1.281.30. The key short-term resistance is at the price of $1.310.00. Trading recommendation: we are bearish on the gold from $1.302.00 with the targets at $1.292.30 and $1.281.30. A stop loss order is to be placed at $1.311.00. The material has been provided by InstaForex Company - www.instaforex.com |
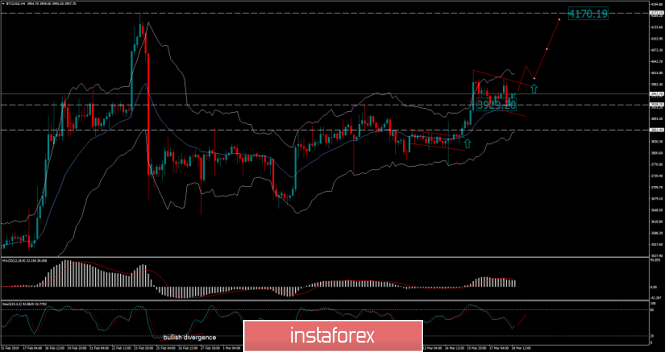
| Bitcoin analysis for March 18, 2019 Posted: 18 Mar 2019 09:59 AM PDT Bitcoin has been trading sideways at the price of $3.956. Our first target is reached at $3.929, and we expect the second target to be hit as well.
BTC is in consolidation phase (potential bullish flag pattern), and we anticipate the upward trend to continue. Stochastic oscillator is ready for an upswing. This is a good sign of an ongoing trend. Short-term resistance is seen at the price of $4.020 and $4.170. Key intraday support is seen at the price of $3.928. Trading recommendation: We are bullish on BTC from 3.870, and we plan to add new position on the breakout of $4.000. Stop loss order is to be placed at $3.770, and take profit order is to be set at $4.170. The material has been provided by InstaForex Company - www.instaforex.com |
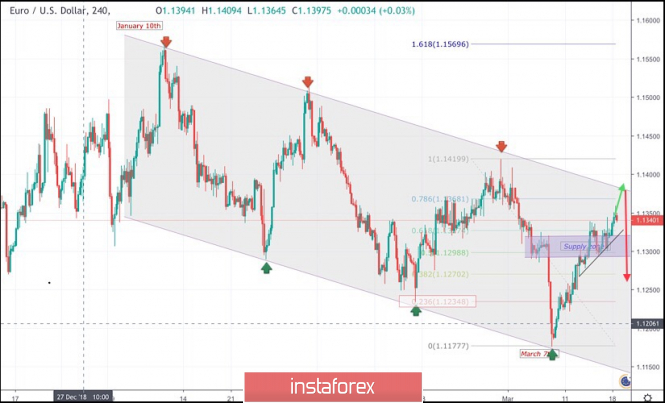
| March 18, 2019 : EUR/USD Bearish opportunity around upper border of trend channel. Posted: 18 Mar 2019 08:42 AM PDT
On January 10th, the market initiated the depicted bearish channel around 1.1570. The bearish channel's upper limit managed to push price towards 1.1290 then 1.1235 before the EUR/USD pair could come again to meet the channel's upper limit around 1.1420. Bullish fixation above 1.1430 was needed to enhance a further bullish movement towards 1.1520. However, the market has been demonstrated obvious bearish rejection around 1.1430 That's why, the recent bearish movement was demonstrated towards 1.1175 (channel's lower limit) where significant bullish recovery was demonstrated on March 7th. Bullish persistence above 1.1270 (Fibonacci 38.2%) enhanced further bullish advancement towards 1.1290-1.1315 (the depicted supply zone) where temporary bearish rejection was demonstrated. Last week, the EUR/USD pair demonstrated a temporary bullish breakout above 1.1315 which was followed by a period of indecision/hesitation that brought the pair again within the depicted supply zone. This week, another bullish breakout attempt is being executed above 1.1327 (61.8% Fibonacci level). This probably enhance a further bullish movement towards 1.1370 and 1.1390 where the upper limit of the depicted movement channel is located. On the other hand, bearish breakout below the price level of 1.1270 (38.2% Fibonacci) will probably liberate a quick bearish retraction towards 1.1160 again where the lower limit of the movement channel can be tested again. Trade recommendations : Conservative traders should wait for the current bullish pullback to pursue towards 1.1390-1.1400 for a valid SELL signal. T/P levels to be located around 1.1330, 1.1290 and 1.1220. S/L to be located above 1.1450. The material has been provided by InstaForex Company - www.instaforex.com |
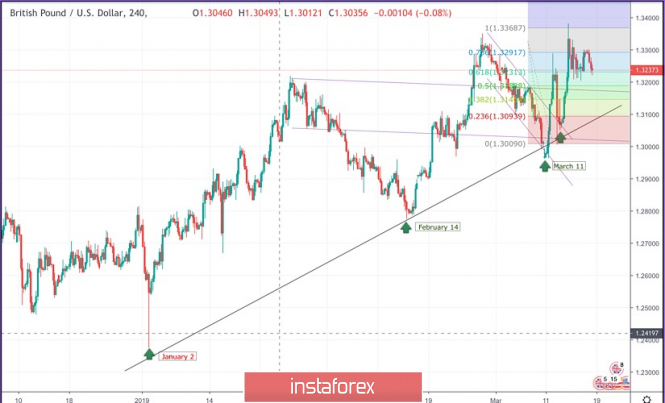
| March 18, 2019 : GBP/USD Intraday technical levels and trade recommendations. Posted: 18 Mar 2019 08:11 AM PDT
On January 2nd, the market initiated the depicted uptrend line around 1.2380. This uptrend line managed to push price towards 1.3200 before the GBP/USD pair came to meet the uptrend again around 1.2775 on February 14. Another bullish wave was demonstrated towards 1.3350 before the bearish pullback brought the pair towards the uptrend again on March 11. A weekly gap pushed the pair slightly below the trend line (almost reaching 1.2960) . However, significant bullish recovery was demonstrated rendering the mentioned bearish gap as a false bearish breakout. Moreover, a short-term bearish channel was broken to the upside following the mentioned bullish recovery on March 11 rendering the short-term outlook as bullish. As expected, bullish persistence above 1.3060 allowed the GBPUSD pair to pursue the bullish momentum towards 1.3130, 1.3200 then 1.3300 where significant bearish rejection is being demonstrated For the current bullish outlook to remain valid, bullish persistence above 1.3230 ( 61.8% Fibonacci expansion level ) is mandatory. Otherwise, the current bullish scenario would be invalidated. Moreover, bullish persistence above 1.3290 (78.6% Fibonacci expansion level) and 1.3368 ( 100% Fibonacci expansion level) is needed to pursue towards 1.3550-1.3580 (Bullish flag projection target). On the other hand , bearish breakout below 1.3180 (50% Fibonacci Exp. level) invalidates this bullish setup rendering the short-term outlook bearish towards 1.3070-1.3050 where the depicted uptrend line comes to meet the GBPUSD pair to be tested once more. The material has been provided by InstaForex Company - www.instaforex.com |
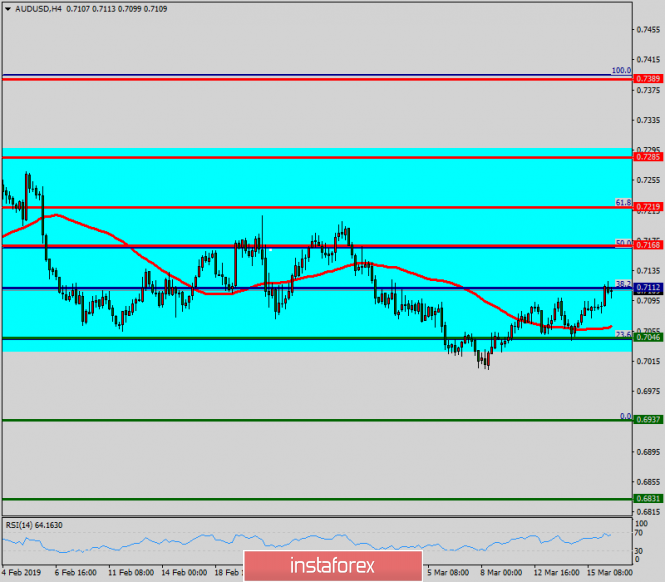
| Technical analysis of AUD/USD for March 18, 2019 Posted: 18 Mar 2019 04:45 AM PDT |
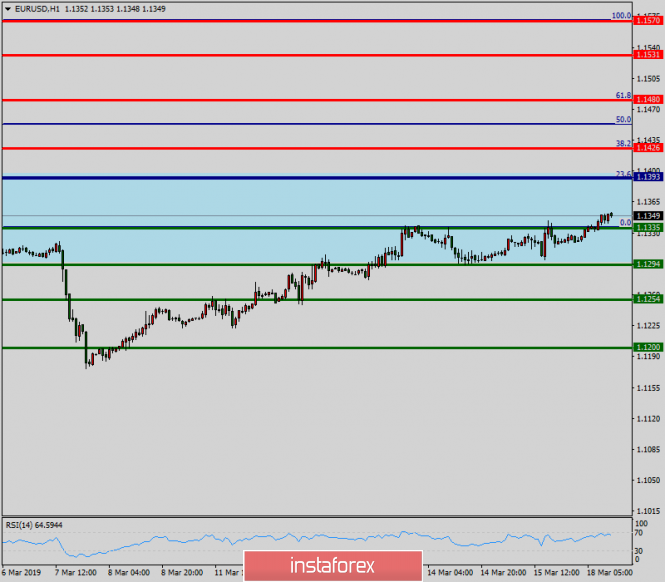
| Technical analysis of EUR/USD for March 18, 2019 Posted: 18 Mar 2019 03:54 AM PDT The EUR/USD pair is trading around the daily pivot point (1.1393). It continued to move downwards from the level of 1.1393 to the bottom around 1.1335. This week, the first resistance level is seen at 1.1393 followed by 1.1426, while the first daily support is seen at 1.1335. Furthermore, the moving average (100) starts signaling a downward trend; therefore, the market is indicating a bearish opportunity below 1.1393. So, it will be good to sell at 1.1393 with the first target of 1.1335. The downtrend is also expected to continue towards 1.1294. The strong daily support is seen at the 1.1254 level. According to the previous events, we anticipate the EUR/USD pair to trade between 1.1393 and 1.1254 in coming hours. The price area of 1.1393 remains a significant resistance zone. Thus, the trend remains bearish as long as the level of 1.1393 is not broken. On the contrary, in case a reversal takes place, and the EUR/USD pair breaks through the resistance level of 1.1393, then a stop loss should be placed at 1.1453. The material has been provided by InstaForex Company - www.instaforex.com |
| Analysis of EUR/USD divergence for March 18: pair is ready to continue moderate growth Posted: 18 Mar 2019 03:30 AM PDT 4h As seen on the 24-hour chart, the pair closed above the retracement level of 127.2% (1.1285). Thus, growth is expected to continue towards the retracement level of 100.0% (1.1553). Currently, there is no emerging divergence on the chart. If the pair closes below the Fibo level of 127.2%, it can be a sign of a reversal in favor of the American currency. Therefore, we can expect resumption of the downward trend towards the retracement level of 161.8% (1.0941). The Fibo grid is based on extremes of November 7, 2017 and February 16, 2018. Trading recommendations: Buy deals on the EUR/USD pair can be opened with the target at 1.1394 if the pair closes above 1.1351. The stop loss should be placed below the retracement level of 61.8%. Sell deals on the EUR/USD pair can be carried out with the target of 1.1299 if the pair rebounds from the level of 1.1351. The stop loss should be placed above the Fibo level of 61.8%. The material has been provided by InstaForex Company - www.instaforex.com |
| Analysis of GBP / USD divergence for March 18. Market sentiment on GBP unclear Posted: 18 Mar 2019 03:30 AM PDT 4h On the hourly chart, the pair rebounded again from the retracement level of 38.2% (1.3220) and closed above the Fibo level of 23.6% which is 1.3228. As a result on March 18, the price may continue its growth, heading for the next retracement level of 0.0% which is 1.3380. If case the pair holds under the Fibo level of 23.6%, it will work in favor of the US dollar. So, the pair will resume its decline towards the retracement level of 38.2%. None of the indicators signals looming divergences on the 1-hour presented. The Fibo grid is built on the grounds of the extremums from March 11, 2019, and March 13, 2019. Trading advice: Buy deals on GBP/USD can be opened with the target at 1.3380 and the stop-loss order below the level of 23.6% since the pair has completed the closure above the level of 1.3281 (hourly chart). Sell deals on GBP/USD can be opened with the target at 1.3220 and the stop-loss order above the level of 23.6% if the pair trades firmly below the correction level of 1.3281 (hourly chart). The material has been provided by InstaForex Company - www.instaforex.com |
| Posted: 18 Mar 2019 03:22 AM PDT Overall: focus on the Fed. The Brexit issue temporarily leaves the headlines since Britain's exit from the EU will be postponed for quite a while. The top event of the new week is the Fed's decision on its monetary policy scheduled for Wednesday. Everyone expects a soft statement by the Fed supporting the European currencies to grow. We buy euros from 1.1350 with the targets up to 1.2000. Alternative option: sell from 1.1175. |
| Posted: 18 Mar 2019 01:29 AM PDT Last week, the EUR/USD pair showed quite clearly that technically the price were capped from moving further downward. The break below 1.1200 turned out to be false. Buyers prevented the price fall and nudged the price under the upper limit of the range. Investors do not view the Brexit agreement between the UK and the EU as a worrying factor. British Prime Minister May is making efforts to push for another vote. Investors are certain that Brexit will be postponed. Now market participants are speculating whether Brexit will be delayed for three months or much longer. The main event of the week is a policy meeting of the Federal Reserve scheduled for Wednesday. There is no doubt that the US central bank will confirm its dovish rhetoric. We are ready to buy the euro from 1.1350. Alternative: With a complete trend reversal downward, we can sell from 1.1175. |
| Market activity slows down before FOMC meeting Posted: 18 Mar 2019 01:05 AM PDT The key event of this week, the US Federal Reserve's meeting on Wednesday, is not likely to bring any significant news to the market. The economic background looks unsustainable, while the data from the labor market turned out ot be mixed. Thus, there is no reason to expect the optimistic sentiment under current conditions. On Friday, the US Treasury published a regular report on the inflow of foreign capital for the period including January. The overall balance is at a minimum of July 2016. Notably, the outflow began once Trump's administration initiated a trade war with China. There is a massive exit of foreign investors from the US stock market while the indices are maintained close to the highs at the expense of domestic reserves. However, one serious event is enough to question the stability of the entire pyramid. The euro has a weak bullish trend on Monday. It is still not strong enough to predict the price to go above 1.1360-65. The pair is likely to trade within the range with the support at 1.1290/1300. Market players are not expected to make any serious moves before the new data is out. Currently, they are waiting for the FOMC meeting. GBPUSD Theresa May's proposal to extend the deadline for Brexit to June 30, 2019, may ultimately favor all interested parties. This postponement will allow the elections to the European Parliament to be held under usual conditions, while the likelyhood of a no-deal Brexit will be lowered, so the investments stop reducing. Uncertainty remains, yet its negative impact on the pound will lower allowing it to make an attempt for further increase. The pound can take advantage of lesser tension with a high likelihood of testing the recent high of 1.3350. At the same time, strong movements are unlikely until March 20. The pair will be trading sideways until any news regarding the US dollar appears. The material has been provided by InstaForex Company - www.instaforex.com |
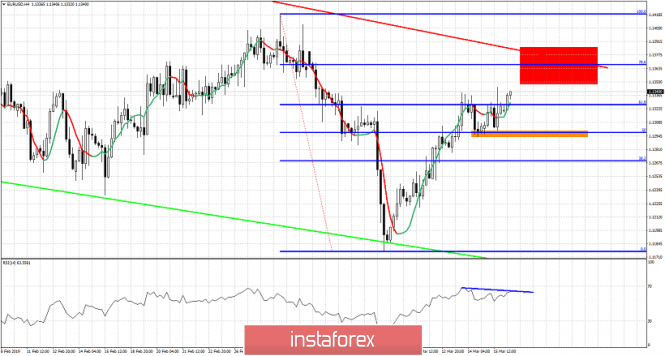
| Technical analysis for EUR/USD for March 18, 2019 Posted: 18 Mar 2019 12:11 AM PDT EUR/USD continues to respect support at 1.1290-1.13 and that is why the pair is making higher highs. There are some bearish divergence signs by the RSI but short-term trend remains bullish as long as price is above 1.13 and we could see 1.1380-1.1390 next for a test of the major resistance at 1.14.
Red rectangle - next bounce target Red line - major resistance trend line Green line- support trend line Orange rectangle - support and short-term trend change level EUR/USD was consolidating for a couple of days above 1.13 and is now making higher highs. Support at 1.13 is very important for the short and medium-term. Holding above it will open the way for a test of the red major resistance trend line at 1.14. The red rectangle shows where our next target is as long as price holds above 1.13. Breaking support at 1.1290-1.13 will open the way for a move below 1.12. The material has been provided by InstaForex Company - www.instaforex.com |
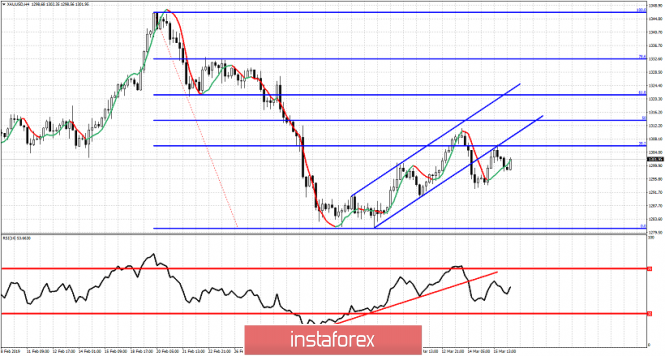
| Technical analysis for Gold for March 18, 2019 Posted: 18 Mar 2019 12:06 AM PDT Gold price is trading around important pivot level of $1,300. As long as price is above it there are many chances we see another run higher towards $1,322. Staying below $1,300 will open the way for another sell off towards $1,250.
Red line - RSI support trend line Gold price broke out and below the bullish channel. This is the first reversal sign. Price bounced back up towards the lower channel boundary and got rejected. This is the second bearish sign. The RSI broke the support trend line. This is the third bearish sign. However, all these are for now just warnings of another sell-off to come. To confirm this bearish scenario bears need to see more signs of weakness. Support is at $1,292 and next at $1,280. Resistance is at $1,312. Bears need to see $1,292 fail to hold for a push towards the major support at $1,280. Breaking below $1,292 will increase dramatically the chances of breaking below $1,280 for a move towards $1,250-60. Breaking above $1,312 will open the way for a move towards $1,322-32. The material has been provided by InstaForex Company - www.instaforex.com |
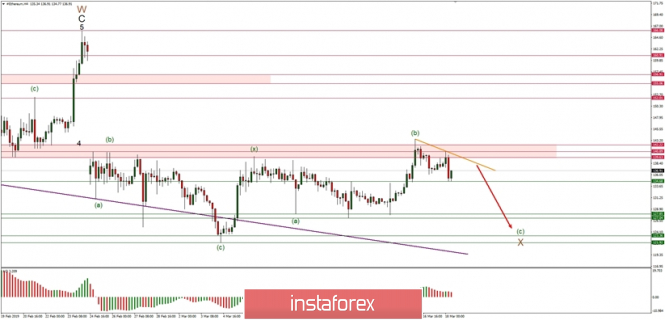
| Elliott Wave analysis of Ethereum for 18/03/2019 Posted: 18 Mar 2019 12:00 AM PDT Technical market overview: The ETH/USD pair has failed to rally above the technical resistance zone located between the levels of 139.63 - 142.22 despite the new local high was made at the level of 143.51. The top for the wave (b) has been made and the bears took control over the market. The first technical support at the level of 134.68 has already been tested, but this is not the end of the down move as the wave (c) is still being made. The next target is seen at the level of 127.85. Weekly Pivot Points: WR3 - 162.50 WR2 - 153.11 WR1 - 146.18 Weekly Pivot - 134.66 WS1 - 129.36 WS2 - 120.05 WS3 - 112.99 Trading recommendations: The bearish wave progression to the downside has still not been completed, so only sell orders should be placed as close as possible to the level of 140.89 with a target seen at the level of 134.89 and if this level is violated - at 127.85.
|
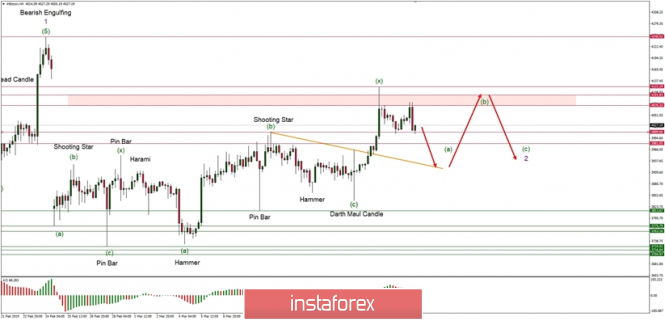
| Elliott Wave analysis of Bitcoin for 18/03/2019 Posted: 18 Mar 2019 12:00 AM PDT Battle of 61% Fibonacci retracement is still present Technical market overview: The BTC/USD pair has made a new local high at the level of $4,122 and then suddenly moved down towards the technical resistance located between the levels of $4,076 - $4,101. The bulls were too weak to move higher again. Hence, the price dropped towards the technical support at the level of $4,009. If this level is violated then the low for the wave (a) will be completed and the market will start the local wave (b) and (c). When those two waves are done, the whole corrective cycle in wave 2 will be completed. Weekly Pivot Points: WR3 - $4,456 WR2 - $4,282 WR1 - $4,180 Weekly Pivot - $4,000 WS1 - $3,897 WS2 - $3,712 WS3 - $3,614 Trading recommendations: Due to the unfinished corrective cycle in the wave (a) (b) and (c) the sell orders should be placed as close as possible to the level of $4,076 with a protective stop loss above the level of $4,112.
|
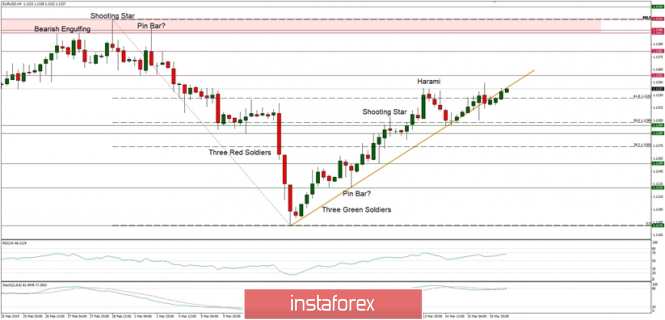
| Technical analysis of EUR/USD for 18/03/2019 Posted: 17 Mar 2019 11:41 PM PDT Technical market overview: The EUR/USD pair has been moving inside of the horizontal zone just above the 61% Fibonacci retracement at the level of 1.1326, bouncing from 50% Fibonacci retracement at the level of 1.1298 to the local resistance at the level of 1.1344. The market conditions are now overbought and there is a bearish divergence forming in this time frame between the price and the momentum indicator, so the bulls might be losing this battle despite the positive and quite strong RSI. The next technical resistance is seen at the level of 1.1353 and the nearest important support is seen at the level of 1.1294 and then at 1.1284. Please notice, that the recent move up from the level of 1.1176 is considered to be a corrective bounce in a downtrend. Weekly Pivot Points: WR3 - 1.1502 WR2 - 1.1422 WR1 - 1.1372 Weekly Pivot - 1.1287 WS1 - 1.1251 WS2 - 1.1168 WS3 - 1.1131 Trading recommendations: The market is still trading around the level of 61% Fibo, so the battle is still going on and due to the fact that this is a corrective bounce in the downtrend, the bias should be to the downside and only sell orders should be opened. The entry level should be as close as possible to the level of 1.1353 with a tight protective stop loss and the first take profit level is seen at 1.1249.
|
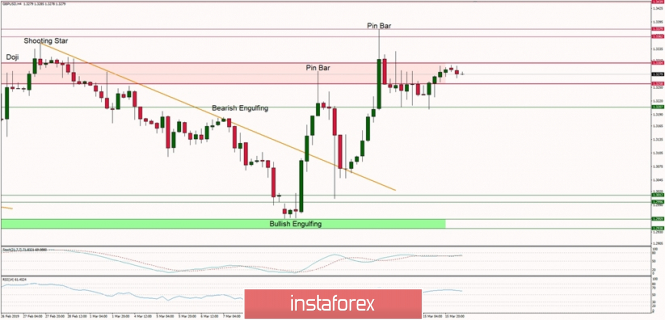
| Technical analysis of GBP/USD for 18/03/2019 Posted: 17 Mar 2019 11:21 PM PDT Technical market overview: The GBP/USD pair is still moving inside of the narrow zone located between the levels of 1.3207 - 1.3304 as the horizontal correction continues after a wide swing we witnessed last week. There is no important price or candlestick pattern present currently in this market that would indicate a possible breakout in either direction. The longer time frame trend remains bullish, so the bias is still to the upside and the main technical resistance is seen at the levels of 1.3362 and 1.3379. Weekly Pivot Points: WR3 - 1.3917 WR2 - 1.3636 WR1 - 1.3473 Weekly Pivot - 1.3224 WS1 - 1.3055 WS2 - 1.2794 WS3 - 1.2638 Trading recommendations: The market is still consolidation, so it will be better to wait for a trading setup after the consolidation will terminate. The best one would be a breakout in either direction, but due to the fact that the trend is still up, traders should prefer to buy in the local corrections and wait for the market to resume the up move. Only a sustained breakout below the level of 1.2959 would invalidate the short-term bullish bias and deepen the correction.
|
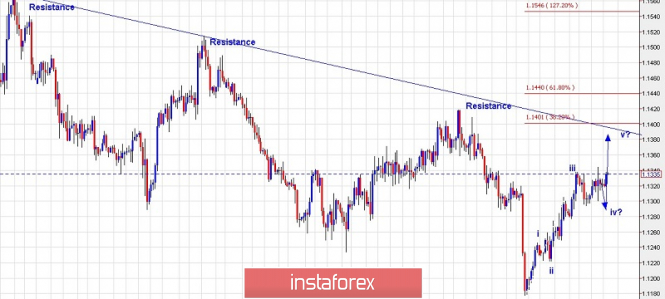
| Trading plan for EUR/USD for March 18, 2019 Posted: 17 Mar 2019 10:00 PM PDT
Technical outlook: The 4H chart presents a bull trend for the EUR/USD pair over the next several weeks. Asit is depicted on the chart, EUR/USD seems to be on its way to cross an impulse wave from 1.1175 through the 1.1400/20 levels respectively. A lower degree wave structure shows waves i, ii, and iii. It might be in place and the wave iv is likely to unfold as a complex corrective structure. It is likely to approach the 1.1300 levels and go forward. Ideally, the wave iv should terminate above the 1.1245/50 levels. Then with a final push higher towards 1.1400/20 it will complete the impulse wave that has been potentially formed since March 07, 2019. When the immediate price resistance is withdrawn, the wave structure will be in a bull trend. We should buy amid dips thereafter. Trading plan: Aggressive traders, remain long with a stop loss order at the 1.1250 levels, targeting 1.1420 Conservative traders, remain flat for now. Good luck! The material has been provided by InstaForex Company - www.instaforex.com |
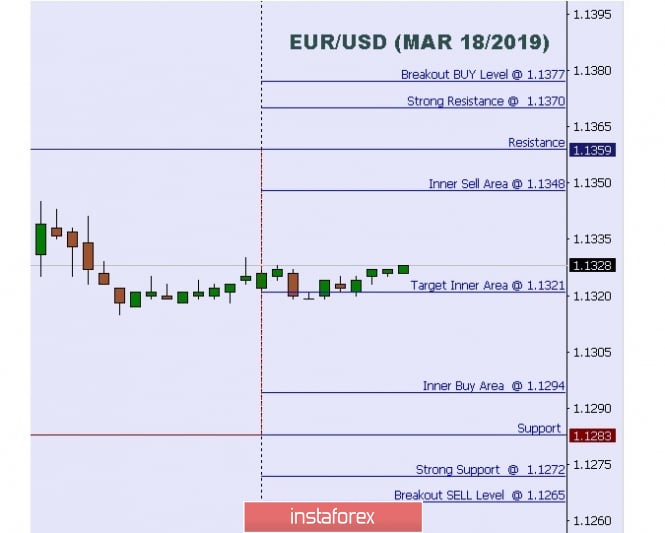
| Technical analysis: Intraday Levels For EUR/USD, Mar 18, 2019 Posted: 17 Mar 2019 07:52 PM PDT
When the European market opens, some economic data will be released such as German Buba Monthly Report and Trade Balance. The US will also publish the economic data such as NAHB Housing Market Index, so amid the reports, the EUR/USD pair will move with low to medium volatility during this day. TODAY'S TECHNICAL LEVELS: Breakout BUY Level: 1.1377. Strong Resistance: 1.1370. Original Resistance: 1.1359. Inner Sell Area: 1.1348. Target Inner Area: 1.1321. Inner Buy Area: 1.1294. Original Support: 1.1283. Strong Support: 1.1272. Breakout SELL Level: 1.1265. (Disclaimer) The material has been provided by InstaForex Company - www.instaforex.com |
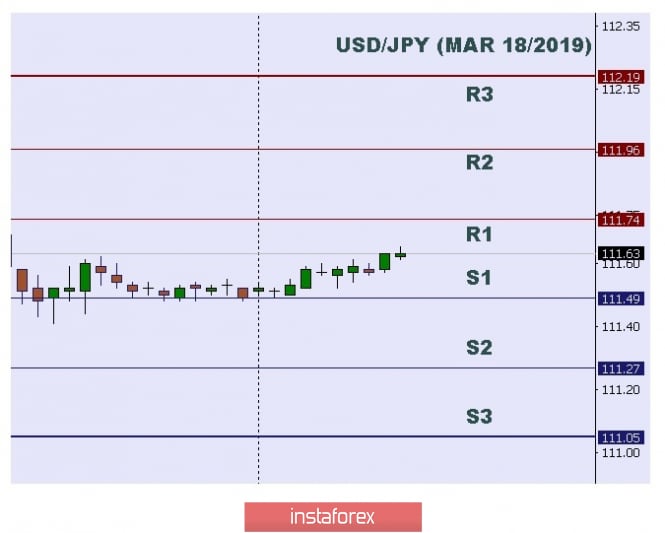
| Technical analysis: Intraday levels for USD/JPY, Mar 18, 2019 Posted: 17 Mar 2019 07:50 PM PDT
In Asia, Japan will release the Revised Industrial Production m/m and Trade Balance and the US will publish some economic data such as NAHB Housing Market Index. So there is a probability the USD/JPY pair will move with low to medium volatility during this day. TODAY'S TECHNICAL LEVELS: Resistance. 3: 112.19. Resistance. 2: 111.96. Resistance. 1: 111.74. Support. 1: 111.49. Support. 2: 111.27. Support. 3: 111.05. (Disclaimer) The material has been provided by InstaForex Company - www.instaforex.com |
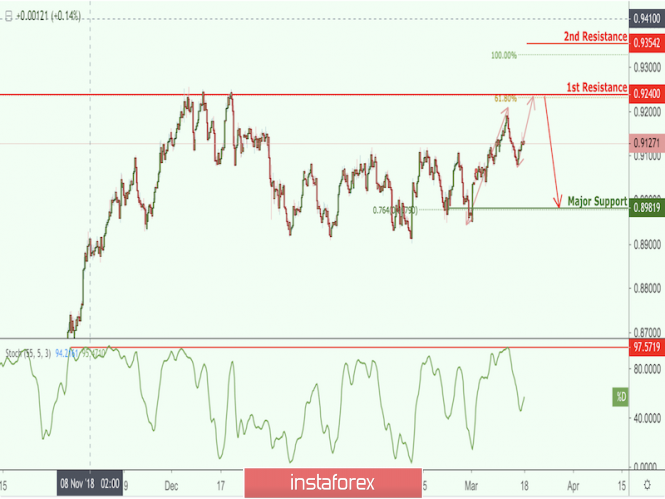
| NZD/CAD approaching resistance, potential drop! Posted: 17 Mar 2019 06:40 PM PDT NZD/CAD is approaching our first resistance at 0.9240 (horizontal swing high resistance, 76.4% Fibonacci retracement, 61.8% Fibonacci extension) where a strong drop might occur below this level pushing the price down to our major support at 0.8981 (horizontal swing low support, 76.4% Fibonacci retracement). Stochastic (55,5,3) is also nearing our first resistance where we might see a corresponding drop in price. Trading CFDs on margin carries high risk. Losses can exceed the initial investment, so please ensure you fully understand the risks.
|
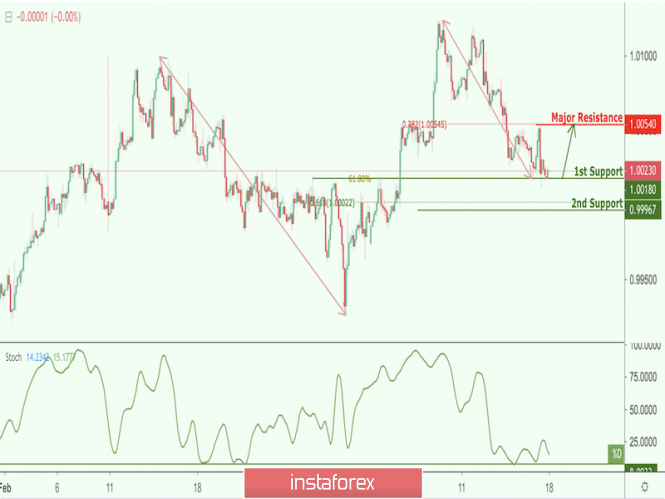
| USD/CHF approaching support, potential bounce! Posted: 17 Mar 2019 06:38 PM PDT USD/CHF is approaching our first support at 1.0018 (horizontal pullback support, 61.8% Fibonacci extension) where a strong bounce might occur to our major resistance at 1.0054 (38.2% Fibonacci retracement). Stochastic (34,5,3) is also nearing support where we might see a corresponding rise in price. Trading CFDs on margin carries high risk. Losses can exceed the initial investment, so please ensure you fully understand the risks.
|
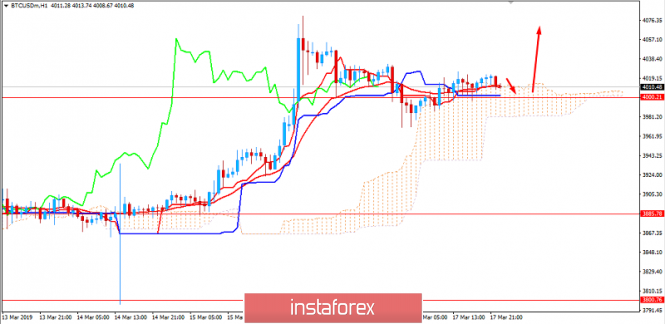
| BITCOIN Analysis for March 18, 2019 Posted: 17 Mar 2019 04:11 PM PDT Bitcoin has recently managed to close above the $4,000 price area with a daily close which is currently consolidating and correcting itself at the edge of the $4,000 area after a certain retrace along the way. The price is currently being held by the dynamic support area of Kumo Cloud, while also being carried by the dynamic levels such as the 20 EMA line, Tenkan, and Kijun. Though the price is progressing with an impulsive to flat wave progression, it is expected to push higher towards $4,250 with an impulsive bullish momentum after the price corrects itself further at the current position. As the price remains above the $3,800-80 area with a daily close, further bullish pressure is expected. SUPPORT: 3,500-600, 3,800-80, 4,000 RESISTANCE: 4,250, 4,500 BIAS: BULLISH MOMENTUM: VOLATILE
|
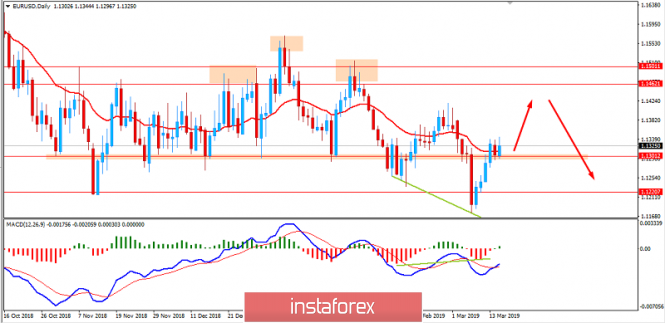
| Fundamental Analysis of EUR/USD for March 18, 2019 Posted: 17 Mar 2019 04:04 PM PDT EUR has recently managed to gain quite sustainable momentum after the fallback below the 1.1200 area. Despite the slowdown of the eurozone economy, such momentum-based gains over EUR are expected to lead to certain bullish pressure. The ECB has recently cut its 2019 growth forecast to their lowest levle since 2017 which is expected to affect the long-run momentum of the EUR gains, while certain short-term gains are observed. Today, the EUR Trade Balance report is going to be published which is expected to increase to 17.2B from the previous figure of 15.6B along with German Buba Monthly Report. Moreover, on Thursday, the ECB Economic Bulletin and EU Economic Summit are going to be held which would be just a week ahead of the Brexit decision on March 29. On the other hand, the Fed having unchanged bias for the interest rates indicates good strength of the economy as it is progressing as planned. The Fed has been quite optimistic with the economic growth, though a certain rate hike may lead the rate towards 3.00% to 3.50% by the end of this year. Today, the NAHB Housing Market Index report is going to be published which is expected to increase to 63 from the previous figure of 62. Ahead of the FOMC Funds Rate report to be published on Wednesday, which is expected to be unchanged at 2.50%, USD is anticipated to lose certain momentum before regaining it after the rate hike decision along with the FOMC Economic Projections and the FOMC Statement. As of the current scenario, EUR struggling with the slowdown is expected to regain short-term momentum despite having decreasing inflation, worse economic reports, sudden economic shocks, and the Brexit effect. USD having optimistic approach amid the FOMC report may lead to impulsive non-volatile gains over EUR which may result in the price reduction in the coming days. Now let us look at the technical view. The price is currently residing above the 1.1300 area after certain counter trend bullish momentum of the last week. The price is now expected to push higher towards the 1.1450 area before pushing lower towards 1.1300 and then towards the 1.1050 support area. As the price remains below the 1.1500 area, the bearish bias is expected to continue.
|
| You are subscribed to email updates from Forex analysis review. To stop receiving these emails, you may unsubscribe now. | Email delivery powered by Google |
| Google, 1600 Amphitheatre Parkway, Mountain View, CA 94043, United States | |

No comments:
Post a Comment