
Forex analysis review |
- While investors are hunting for profitability, the dollar will grow
- The dollar is going up in anticipation of the trade agreement of China and the United States
- Weekly review from March 4 to March 9, 2019 for the GBP / USD pair
- What to buy, if not the dollar?
- GBP/USD: plan for the US session on March 4. The pound continues its slow downward correction
- EUR/USD: plan for the US session on March 4. Euro buyers give way to important levels of support
- EUR/USD: the scandal around Huawei and the dovish intentions of the ECB
- EUR/USD. March 4th. Results of the day. The end of the trade war has a positive effect on the US dollar
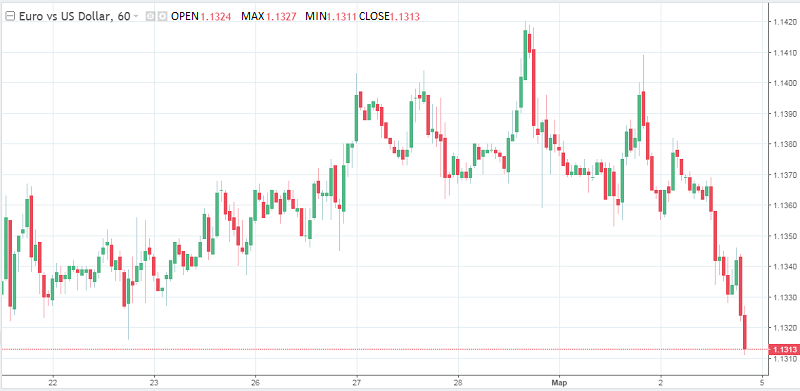
- Weekly review of the foreign exchange market from 03/04/2019
- Bitcoin analysis for March 04, 2019
- EUR/USD analysis for March 04, 2019
- March 4, 2019 : GBP/USD is retracing towards its newly-established Demand-Zone.
- BITCOIN Analysis for March 4, 2019
- March 4, 2019: EUR/USD is still holding some bullish gains around the lower limit of its channel.
- Analysis of Gold for March 04, 2019
- Pound will pass the test
- USD / CAD: bad news ahead of Bank of Canada meeting
- Technical analysis of AUD/USD for March 04, 2019
- Fractal analysis of major currency pairs on March 4
- Technical analysis of USD/CAD for March 04, 2019
- Analysis of the divergence of EUR / USD for March 4. The pair is prone to falling, but down does not allow the level of
- Euro and pound weaken
- EURUSD: Fundamental indicators of the American economy are declining, but there is no reason for excitement
- Burning forecast 03/04/2019
- Wave analysis of EUR / USD for March 4. The pair is still preparing to decline
| While investors are hunting for profitability, the dollar will grow Posted: 04 Mar 2019 07:31 PM PST The dollar began on Monday with growth against major currencies amid growing weakness of the euro, encouraging hedge funds to increase their rates. While the Fed took a pause in its multi-year rate increase cycle of rate hikes, the higher US government bond yields against counterparties which means that the advantage over interest rates remains firm in the United States, especially against the backdrop of declining fears about the prospects of the global economy. Markets still believe that the growth of bond yields is more than enough to compensate for the pause in policy tightening. The only thing that is doubtful about the further growth of the dollar is world trade. The increase in profitability occurred against the background of falling volatility, especially in foreign exchange markets, where participants are actively looking for opportunities to trade, including loans in low-yielding currencies such as the yen or the euro, and the purchase of high-yielding currencies, such as the dollar. Hedge funds have increased their long rates in dollars, and the latest position data shows that net positions rose to $ 27.24 billion in the week ending March 1. This year, hopes that some of the world's large central banks will raise interest rates since it have weakened in recent weeks amid weak economic data. Some analysts are now expecting a new batch of cheap loans for banks from the ECB, which will increase the dollar rate. The material has been provided by InstaForex Company - www.instaforex.com |
| The dollar is going up in anticipation of the trade agreement of China and the United States Posted: 04 Mar 2019 06:13 PM PST Earlier this week, the US dollar rises in price amid reports that after a protracted trade conflict, the United States and China approached the signing of a trade agreement. On Sunday, March 3, the media wrote that the US authorities may cancel most of the duties on Chinese goods, because at the end of March, the US President, Donald Trump and and Chinese President, Xi Jinping could sign the final trade agreement between the countries. Last week, against the background of progress in trade negotiations, Trump also appealed to the Chinese authorities in order to cancel all duties on agricultural products from the United States. As of 5:00 pm Moscow time, the US dollar index, which shows the strength of the US currency relative to a basket of six major currencies, increased by 0.07% to 96.518, having reached the highest level since February 22 during today's trading. At the same time, participants in the global currency market ignored a statement by US President Donald Trump, who noted that the recent tightening of the monetary policy of the Fed led to the strengthening of the dollar, which prevents us from doing business with other countries. The material has been provided by InstaForex Company - www.instaforex.com |
| Weekly review from March 4 to March 9, 2019 for the GBP / USD pair Posted: 04 Mar 2019 05:23 PM PST Trend analysis (Fig. 1). This week, the price will move up with the first target of 1.3406- a rolling 50.0% level (blue dashed line).
Fig. 2 (weekly schedule). Comprehensive analysis: - indicator analysis - up; - Fibonacci levels - up; - volumes - up; - candlestick analysis - up; - trend analysis - up; - Bollinger lines - down; - monthly schedule - up. The conclusion from the complex analysis - upward movement. The overall result of the calculation of the GBP/USD currency pair candle on the weekly chart: the price of the week is likely to have an upward trend with the absence of the first lower shadow of the weekly white candle (Monday – up) and the absence of the second upper shadow (Friday – up). In the coming week, the price will move up with the first target of 1.3406 - a sliding level of 50.0% (blue dashed line). The material has been provided by InstaForex Company - www.instaforex.com |
| What to buy, if not the dollar? Posted: 04 Mar 2019 03:40 PM PST Donald Trump resumed criticism of Jerome Powell, calling him a gentleman who likes to raise rates, and attacks on the strong dollar. In general, Trump is not against a strong national currency, but not so much as it would harm American business. "Can you imagine if we left interest rates where they were where would the dollar be now! And why raise them, if inflation practically does not grow," the White House protested. Served on a silver platter, the markets were swallowed whole. This is not the first time this has happened, but perhaps the situation is quite different now. If you think about it, then in the March portion of Trump's criticism you can find a logical explanation. In addition, concrete actions may be behind the new rage. So, net exports last year deducted 0.2 pp from GDP, which did not allow the economy to grow by the 3% that was promised by the president. The foreign trade deficit increased by the end of 2018 to $914 billion from $859 billion, updating the record set in 2006 to $905 billion. During Trump's presidency, the figure widened by 16%. Of course, this is a disappointment for a person who tried to reduce it at the expense of import duties. Even if the main reason for the increase in the negative trade balance was the fiscal stimulus, which allowed to increase imports, but the Fed's tightening led to the breakthrough of the dollar and pulled the plug to U.S. exporters. As for Donald Trump's statement regarding the lack of inflation, it can be called controversial. Despite the fact that last year the index of spending on personal consumption increased by 1.75%, the eighth consecutive year that it has not reached the goal of 2%, the base PCE in December accelerated growth by 0.19% on a monthly basis, and this is the best dynamics since May. In terms of annual rates, the rate rose at the highest rate in seven years (1.94%). Trump's dissatisfaction with the Fed's work forced hedge funds to doubt the correctness of their decisions. Speculators are returning to the dollar after a large-scale sales in December-January, Citi reported after the analysis. It may sound a bit ironic, but Trump's tweet and public post is not an empty phrase. Perhaps his statements should be taken as a hint at the future movement of the markets. For example, taking the office of president, he criticized a strong dollar, which after a while set a record low in price, the EURUSD pair gained more than 10%. His attacks on OPEC were one of the main reasons for the decline in oil prices last year. Then he attacked the Fed, after which the regulator changed its position. There is no doubt that the actions of the central bank's leadership were influenced by the December collapse of markets, but Trump also played a role in the pressure on Powell. The president of the United States goes ahead in achieving his goals. Despite not being able to bring the GDP to the target of 3% and extremely high foreign trade deficit, we must admit that the economy did not have enough to reach the goal. In addition, protectionism forced the United States and China to sit down at the negotiating table, and the parties are now ready to conclude an agreement, one of the points of which is likely to be the reduction of tariffs on imports of US agricultural products. But on the other hand - if you sell the dollar, then what to buy instead? There is no alternative. The growth of the European core inflation in February, which is even stronger than February, to 1% yoy increases the likelihood of the dovish rhetoric of the ECB head at the March meeting and creates downward pressure on the EURUSD rate. The bears have prepared for an attack, which will increase the risk of lowering quotes to the lower end of the consolidation range of 1.125. |
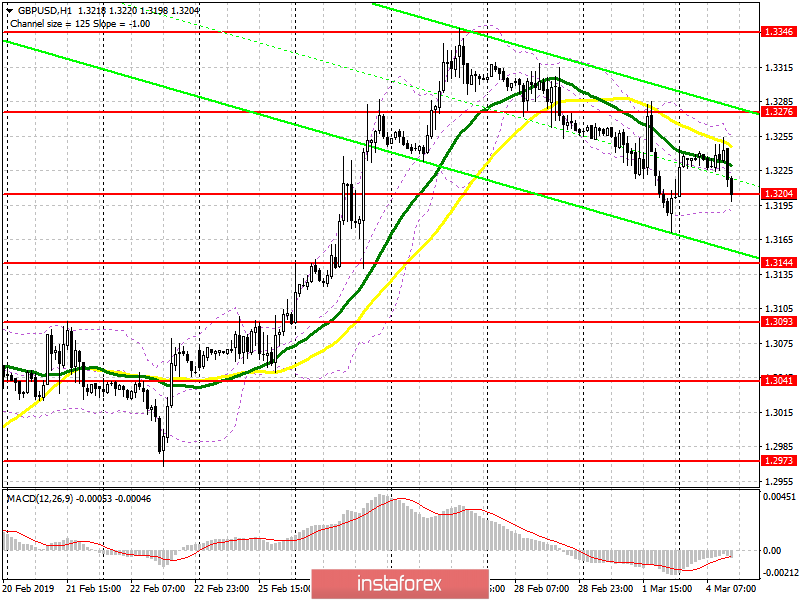
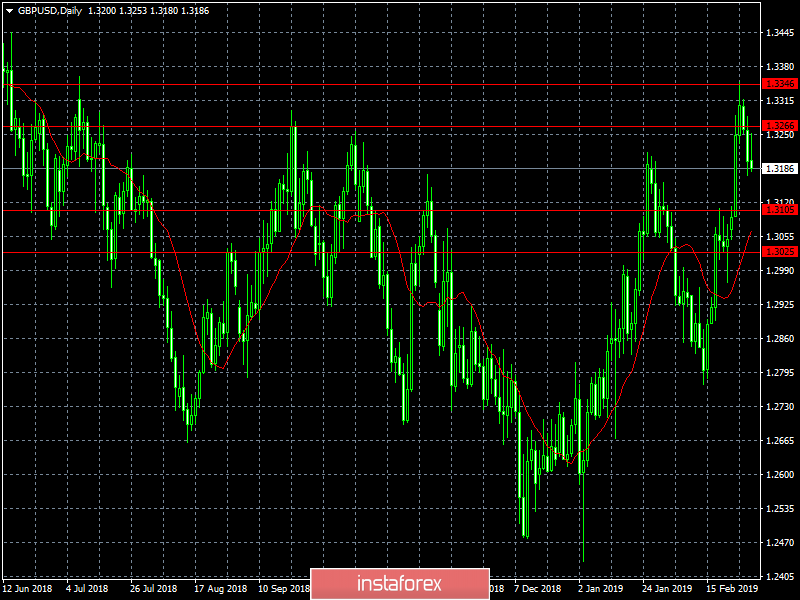
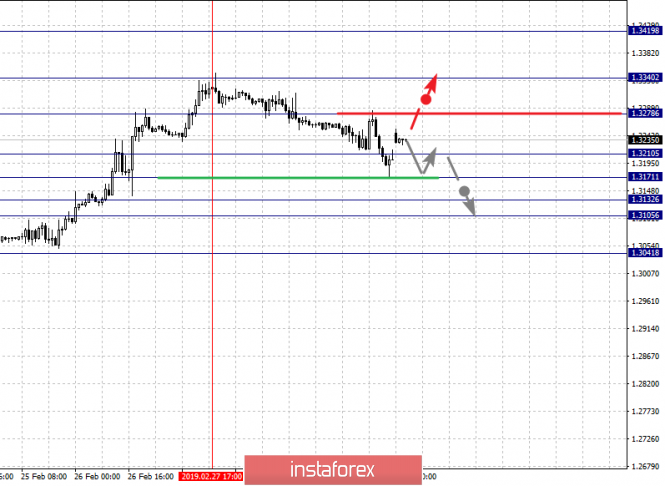
| GBP/USD: plan for the US session on March 4. The pound continues its slow downward correction Posted: 04 Mar 2019 03:13 PM PST To open long positions on GBP/USD you need: Buyers are trying to form a false breakdown in the support area of 1.3204, which I paid attention to in my morning review. However, it is best to open larger long positions to rebound from a low of 1.3144. The main task of the bulls is the return and breakthrough of resistance at 1.3276, which will lead the pound to new highs in the area of 1.3346 and 1.3386, where I recommend to lock in profits. To open short positions on GBP/USD you need: An unsuccessful attempt at growth in the area of a resistance of 1.3276 in the first half of the day was a clear signal to sell the pound. The main task for the second half of the day is to consolidate below the support of 1.3204, which will lead to a larger sale to the area of a low of 1.3144, where I recommend taking profits. In case the GBP/USD increases, short positions can be opened immediately to rebound from a high of 1.3276 and a larger resistance area of 1.3346. Indicator signals: Moving averages Trade is conducted below the 30-day and 50-medium moving averages, which indicates a bearish market correction. Bollinger bands The volatility of the Bollinger Bands indicator is very low, which does not give signals on entering the market. Description of indicators
|
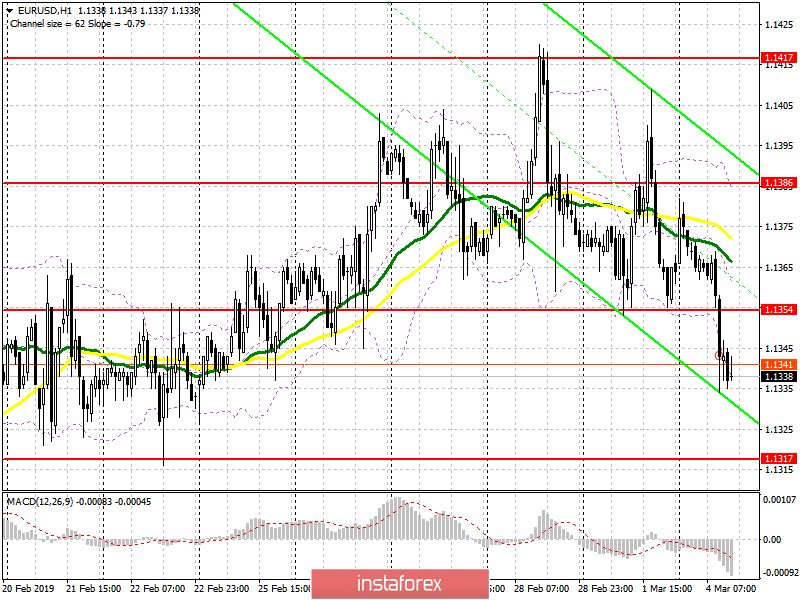
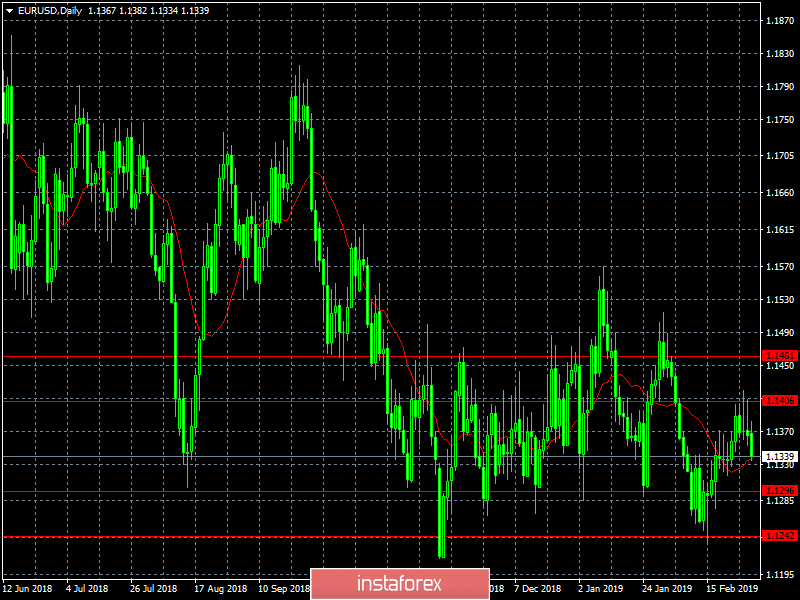
| EUR/USD: plan for the US session on March 4. Euro buyers give way to important levels of support Posted: 04 Mar 2019 03:04 PM PST To open long positions on EURUSD you need: Euro buyers did not manage to stay above the support of 1.1354 in the first half of the day, as a result of which the pair continued its decline. At the moment, it is best to return to long positions to rebound from a large level of 1.1317, to which EUR/USD is currently aiming for. However, the main task for the second half of the day will be a return and consolidation above the resistance of 1.1354, which will lead to a larger upward correction in the area of 1.1386, where I recommend taking profits. To open short positions on EURUSD you need: Eurozone producer prices coincided with the expectations of economists, which led to a further downward correction and the breakdown of support at 1.1354. As long as trading will be conducted below this range, pressure on the euro will continue, and in case of an upward correction, the formation of a false breakdown on this range will be an additional signal to sell EUR/USD with a target of 1.1317, where I recommend taking profits today. If the growth scenario is higher than the resistance of 1.1354, you can sell the euro to rebound from the level of 1.1386. Indicator signals: Moving averages Trade remains below the 30-day and 50-medium moving averages, indicating a bearish nature of the market. Bollinger bands The breakout of the lower limit of the Bollinger Bands indicator led to a new wave in selling the euro. In the afternoon, growth may be limited by the average indicator limit in the area of 1.1360. Description of indicators
|
| EUR/USD: the scandal around Huawei and the dovish intentions of the ECB Posted: 04 Mar 2019 03:03 PM PST The half-empty economic calendar of Monday forces EUR/USD traders to shift the focus of their attention to external fundamental factors that somehow affect the dynamics of the currency market. News feeds are full of headlines about the prospects of Brexit, Huawei's intentions to sue the US government, as well as the "dovish" intentions of representatives of the European Central Bank. Such a motley fundamental background provoked quite a strong volatility on the pair, on the wave of which EUR/USD bears lowered the price to the level of 1.1310. However, this price momentum is unlikely to determine the downward trend - the pair continues to trade in a wide-range flat without leaving the 13th figure. Such a rather meaningless "chatter" can last until Thursday or Friday, when the key events of this week take place - the ECB meeting and the publication of NonFarms. But Monday shows uncertainty for both bulls and bears of EUR/USD. This situation was observed throughout the previous week: buyers stormed the 14th figure several times, but after a few hours they lost ground. As a result, the pair completed the five-day trading session almost at the opening level. Today bears again tried to seize the initiative. Despite the relatively strong momentum, it is necessary to take one fact into account: to reverse the situation in their favor, the bears need not only return the price to the 12th figure, but also gain a foothold below the mark of 1.1260 (the lower line of the Bollinger Bands indicator on the daily chart). In this case, the pair will be under strong pressure and the technical picture, and the notorious "domino effect." But while the price is above this target, we can only talk about a situational decline, which is due to the temporary strengthening of the US currency. The dollar received a very unexpected support amid the growing scandal over Huawei Chief Financial Officer Meng Wanzhou, to which the US authorities accuse of industrial espionage and fraud. In December last year, she was detained in Canada, and since then the issue of her extradition to the United States has been resolved, where she should be formally charged. China strongly opposed the extradition, disagreeing with the allegations. Beijing believes that Washington is engaged in nothing but " political persecution of high-tech enterprises." It is likely that this situation would be ignored by the market under any other conditions, but now the US-China deal that will end the multi-month trade war is at stake. Experts fear that if the financial director is extradited, relations between the countries will deteriorate again. In general, the situation is far from de-escalation: on Friday, the Canadian government approved the extradition of Wanzhou, and now the final word is on the Minister of Justice of Canada, who also serves as the country's attorney general. He must review the case and determine whether the actions incriminated to her are considered to be criminal - both in the US and in Canada. According to Canadian law, the extradition of Huawei's CFO is possible only if the Minister of Justice responds positively to this question. The current situation has strengthened the anti-risk sentiment in the market, after which the US dollar strengthened against a basket of major currencies. Speaking directly about the euro/dollar pair, there is additional pressure from vague prospects of Brexit, as well as rumors that the European Central Bank may reduce its forecasts of economic growth at its March meeting, which will be held this Thursday. Recent comments by ECB members say that the regulator will take an extremely "dovish" stance. First, the tentative date for the rate hike is likely to be postponed to next year. Second, the central bank may discuss a new round of LTRO at its March meeting. The previous TLTRO program ends in the middle of next year, but the banking sector will need liquidity this year, so, according to many experts, the long-term financing program will be resumed this year. Members of the regulator discussed this topic in December (to no avail), but bypassed this issue in January, thus providing indirect support to the European currency. Judging by the rhetoric of the central bank members (in particular, Coeure and Praet), the ECB may announce a new round of LTRO this Thursday. Such prospects put strong pressure on the single currency, while the dollar feels quite confident in the wake of new unrest regarding US-China relations. Despite such a "black and white" fundamental background, the overall situation remains uncertain. The Federal Reserve also takes a soft position, and the situation in the US economy is also ambiguous. Therefore, bears are likely to not break through the key support level of 1.1260 (the lower line of the Bollinger Bands on the daily chart), and this fact will return the pair to the "usual" price area of 1.1340-1.1380. The material has been provided by InstaForex Company - www.instaforex.com |
| Posted: 04 Mar 2019 03:03 PM PST 4-hour timeframe The amplitude of the last 5 days (high-low): 41p - 58p - 42p - 61p - 56p. Average amplitude for the last 5 days: 52p (48p). On Monday, March 4th, the EUR/USD currency pair shows a rather strong downward movement. It seems that traders were filled with rather modest purchases of the European currency and once again came to the conclusion that there were no compelling reasons for mid-term and long-term purchases of the euro. Today there was not a single important macroeconomic report published in the eurozone or the United States. There were no speeches by Trump or other top US or EU leaders. However, today there is information that the United States and China are close to signing a trade agreement that will end the trade war. It is noted that China will reduce tariffs on agricultural products, chemical and automotive, and the United States will lift most of the sanctions on Chinese goods, which were introduced last year. Also among the agreements is a deal on China's purchase of natural gas from one of the US companies. The agreement is expected to be signed before the end of March. Against this background, the US dollar may show growth, since, by and large, this indicates Donald Trump's victory. The leader of the United States has achieved the conditions necessary for his country, without sacrificing anything. From a technical point of view, a new "dead cross" has been formed, and if the pair succeeds in overcoming the lower border of the Ichimoku cloud and the support level of 1.1321, then the pair will get an additional opportunity to move down. Theoretically, the ECB meeting on Wednesday and the press conference could save the euro from a prolonged fall, but the chances that representatives of the regulator will be hawkish are extremely small. Trading recommendations: The EUR/USD pair has started a downward movement. Therefore, at the moment it is recommended to consider short positions with a target of 1.1277. And in the event of a reversal of the MACD indicator upwards, manually reduce the sell orders. Purchase orders will again become relevant no earlier than when the price consolidates above the Kijun-sen critical line. In this case, the actual target for the longs will be the resistance level of 1.1414. In addition to the technical picture should also take into account the fundamental data and the time of their release. Explanation of illustration: Ichimoku Indicator: Tenkan-sen-red line. Kijun-sen – blue line. Senkou span a – light brown dotted line. Senkou span B – light purple dotted line. Chikou span – green line. Bollinger Bands Indicator: 3 yellow lines. MACD: A red line and a histogram with white bars in the indicator window. The material has been provided by InstaForex Company - www.instaforex.com |
| Weekly review of the foreign exchange market from 03/04/2019 Posted: 04 Mar 2019 03:03 PM PST The dollar has been losing its position for two weeks in a row and this is largely due to the ill-fated Brexit. Theresa May announced the postponement of the date of the next vote on an agreement with the European Union, for it is clear to everyone that the House of Commons will once again reject it. After all, the text of the agreement remained unchanged. So the prime minister decided to set a date for voting on the activation of the fiftieth article of the Treaty of Lisbon, in order to slightly postpone the date of Brexit itself. This is done as an attempt in order to have time to agree with Brussels on the border between Ireland and Northern Ireland, as well as customs duties. Honestly, it is unlikely that she will succeed. Of course, Brexit will be postponed, even European politicians have already said so. But if in two years the parties have not moved from a dead point on this issue, and the Europeans themselves assert that they will not make any changes to the current version of the agreement, then even if it is postponed, the result will be the same. But the very hope that everything will end well, inspires investors with optimism, which has a beneficial effect on the pound. True, we should not think that Theresa May is the only one who should be blamed for the weakening of the dollar. Jerome Powell also made his contribution, and he said something in the walls of Congress that he would rather be silent. The head of the Federal Reserve System assured the congressmen that the American economy is doing very good, but the risks come from the trading partners of the United States, whose economies are going through not the best of times and are slowing rapidly. In his opinion, this already threatens the pace of American economy's development. And although he did not speak about the refinancing rate, it becomes clear from his words that the regulator is preparing the public for a possible easing of monetary policy. But it's not worth thinking about further raising the refinancing rate. However, Jerome Powell made similar statements before preliminary data on the United States GDP for the fourth quarter were published, which showed a slowdown in economic growth from 3.4% to 2.6%. So it is the American economy that is slowing down. It is also worth noting that the number of new buildings has dropped by less than 11.2%, and wholesale inventories have grown by 1.1%. But the last time the reserves were reduced only in November 2017. Thus, US data clearly did not inspire optimism, unlike the European statistics, which showed an increase in inflation from 1.4% to 1.5%, and the stability of the unemployment rate. The British statistics were more likely positive, since consumer lending amounted to 1.1 billion pounds, from 0.7 billion pounds in the previous month, and the number of approved mortgage applications increased from 64,468 to 66,766. this is Nationwide data on housing prices, whose growth rates accelerated from 0.1% to 0.4%. In other words, even without Theresa May and Jerome Powell, the dollar had enough reasons to weaken. Nevertheless, if you look at the forecasts, the dollar has a great opportunity to recoup, because the only thing that comes out this week in the United States is the report of the Ministry of Labor. And if you look only at the number of new jobs, the picture is not the most joyful, as they should be 185 thousand against 304 thousand in the previous month. However, the unemployment rate itself should fall from 4.0% to 3.9%, and, more importantly, average hourly wage growth could accelerate from 3.2% to 3.3%. Given the incredible importance of the content of the report, we should expect a rather optimistic response to its publication. But the single European currency has nothing special to answer. Of course, the growth rate of producer prices remained unchanged, and did not slow down as expected. Also, the growth rate of retail sales should accelerate from 0.8% to 1.2%. A meeting of the Board of the European Central Bank will take place this week. The report of the US Department of labor will be released the day before. Naturally, there will be no changes in monetary policy. But no one will wait for an answer to the question about the timing of the refinancing rate increase. Given the apparent slowdown in the European economy, as well as the Federal Reserve System's refusal to further tighten its monetary policy, the Office of Mario Draghi will take a break at best and will rather hint at possible policy easing options. Naturally, investors, who at the end of last year gave hope for an early increase in the refinancing rate, when the European Central Bank closed the quantitative easing program, will be seriously disappointed. this will inevitably affect the single European currency and it will have to decline to 1.1250. The situation is similar at its core in the UK. Although it will do without a meeting of the Bank of England, but the pound loses support from politicians. After all, voting in the House of Commons will take place only next week. The loudest statements have already been made last week. So the pound remains one-on-one with its macroeconomic statistics, which immediately began to disappoint, as the index of business activity in the construction industry fell from 50.6 to 49.5. But we are talking about the real estate market, which is one of the main criteria for determining the investment attractiveness of the United Kingdom. We are still waiting for the decline in the index of business activity in the service sector from 50.1 to 49.9. It is worth noting that both indexes fell below 50 points, which is characterized by a high probability of the economy slipping into recession. Also, data on industrial production can show an improvement in the situation, because a decline of 0.9% should slow down by a decline of 0.4%. Nevertheless, it is still a decline in industrial production. So there is no reason for optimism over the pound, and it will have to go down to 1.3025. |
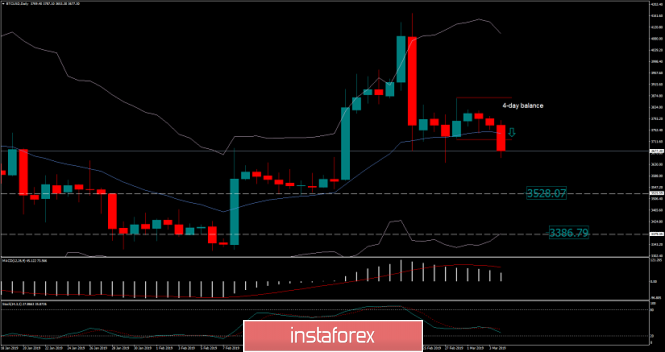
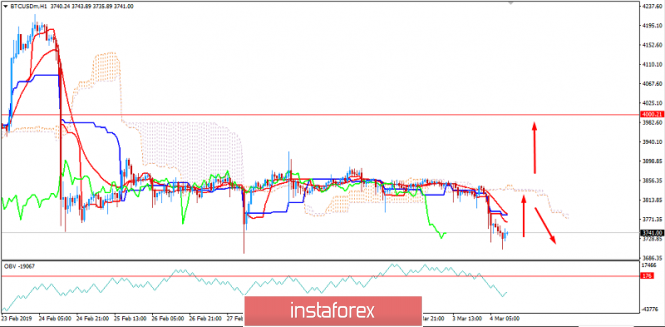
| Bitcoin analysis for March 04, 2019 Posted: 04 Mar 2019 05:13 AM PST Bearish breakout of the 4-day balance support at $3.718.
We find the bearish breakout of the 4-day balance, which is a sign that sellers are in control and that we may expect further decline on the BTC. Support levels are seen at $3.528 and $3.386. Key short-term resistance level is seen at $3.862. Trading recommendation: We are short BTC from $3.680 with targets at $3.528 and $3.386. Protective stop is placed at $3.865. The material has been provided by InstaForex Company - www.instaforex.com |
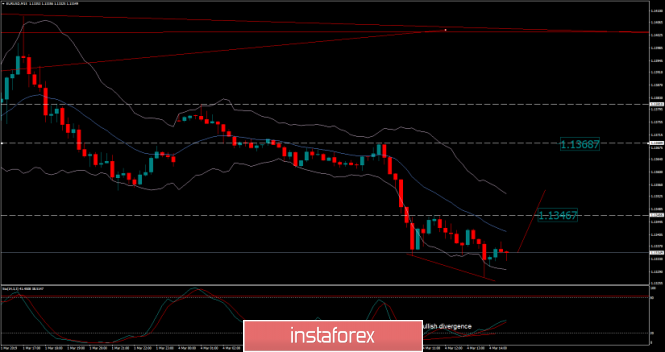
| EUR/USD analysis for March 04, 2019 Posted: 04 Mar 2019 05:04 AM PST EUR/USD has been trading downwards but the intraday bullish divergence is in creation. Careful with selling positions.
The level of 1.1327 provided intraday support. According to the M15 time – frame, we found that bullish divergence on the stochastic oscillator in creation, which is sign that selling at this stage looks risky.Intraday resistance levels are set at 1.1346, 1.1368 and 1.1380. Even if the price breaks the support at 1.1327, we wouldn't recommend you going short on intraday prospective due to potential oversold condition. Trading recommendation: We are neutral on EUR/USD with the intraday risk for the downside. Anyway, if we see the breakout of the resistance at 1.1346, we will buy with small position and put targets at 1.1368 and 1.1380. The material has been provided by InstaForex Company - www.instaforex.com |
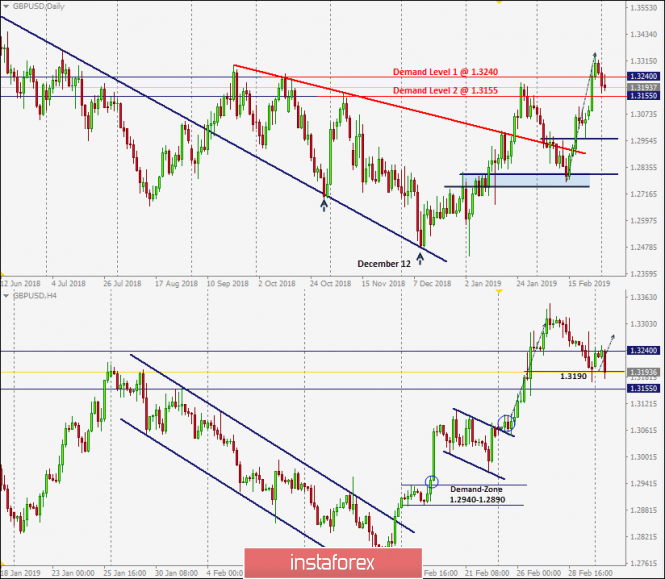
| March 4, 2019 : GBP/USD is retracing towards its newly-established Demand-Zone. Posted: 04 Mar 2019 04:57 AM PST
On December 12, the previously-dominating bearish momentum came to an end when the GBP/USD pair visited the price levels of 1.2500 where the backside of the broken daily uptrend was located. Since then, the current bullish swing has been taking place until January 28 when the GBP/USD pair was almost approaching the supply level of 1.3240 where the recent bearish pullback was initiated. Shortly after, the GBP/USD pair lost its bullish persistence above 1.3155. Hence, the short-term scenario turned bearish towards 1.2920 (38.2% Fibonacci) then 1.2820-1.2800 (50% Fibonacci level) within the depicted H4 bearish channel. On February 15, significant bullish recovery was demonstrated around 1.2800-1.2820 (Fibonacci 50% level) resulting in a Bullish Engulfing daily candlestick. This initiated the current bullish breakout above the depicted H4 bearish channel. Quick bullish movement was demonstrated towards 1.3155, 1.3240 and 1.3300. Early signs of bearish reversal/retracement were demonstrated around the price level of 1.3317. Bearish pullback was expected to extend down towards 1.3240 and 1.3200 where price action should be watched cautiously for bullish positions. Bullish persistence above the newly-established depicted demand-zone (1.3240-1.3190) is mandatory to allow further bullish advancement. Any bearish breakdown below 1.3190 invalidates the short-term bullish scenario allowing a quick bearish movement to occur towards 1.3150 (lower limit of the demand zone) and 1.3060 where the recent bullish breakout was initiated. Trade Recommendations: Conservative traders can watch for the current bearish pullback around 1.3190 for a valid low-risk BUY entry. S/L to be located below 1.3150. T/P levels to be located around 1.3240 and 1.3317 initially. The material has been provided by InstaForex Company - www.instaforex.com |
| BITCOIN Analysis for March 4, 2019 Posted: 04 Mar 2019 04:37 AM PST After a series of corrections and indecision below $4,000 with a daily close, Bitcoin is currently trading below $3,800. Like most of the cryptocurrencies, Bitcoin has been struggling to sustain the bullish momentum being surrounded by pessimism along the way. The price is currently showing certain bearish rejection off the $3,700 area from where it is expected to rise higher towards $3,800 where the Kumo Cloud resistance lies. A break above $3,800 will lead the price to $4,000 in the future. Though the price has been quite impulsive with the recent bearish momentum, being above $3,500-600 support area with a daily close, the bullish bias is expected to push the price higher. SUPPORT: 3,500, 3,600 RESISTANCE: 4,000, 4,250 BIAS: BULLISH MOMENTUM: VOLATILE
|
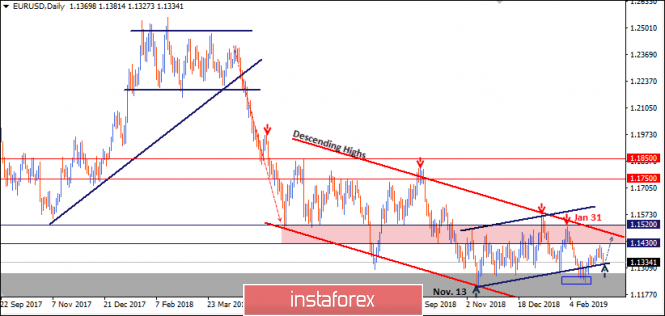
| March 4, 2019: EUR/USD is still holding some bullish gains around the lower limit of its channel. Posted: 04 Mar 2019 04:33 AM PST
On November 13, the EUR/USD pair demonstrated recent bullish recovery around 1.1220-1.1250 where the current bullish movement above the depicted short-term bullish channel (In BLUE) was initiated. Bullish fixation above 1.1430 was needed to enhance further bullish movement towards 1.1520. However, the market has been demonstrating obvious bearish rejection around 1.1430 few times so far. The EUR/USD pair has lost its bullish momentum since January 31 when a bearish engulfing candlestick was demonstrated around 1.1514 where another descending high was established then. This allowed the current bearish movement to occur towards 1.1300-1.1270 where the lower limit of the depicted DAILY channel came to meet the pair. Since February 20, the EUR/USD pair has been demonstrating weak bullish recovery with sideway consolidations around the depicted price zone (1.1300-1.1270). Last week, significant bullish recovery emerged on Tuesday. However, on Thursday, the pair failed to fixate above 1.1400 with early signs of bearish rejection. This indicated a high probability of bearish reversal towards 1.1300-1.1330 where the lower limit of the depicted movement channel is located. Please note that a bearish flag pattern may become confirmed if bearish persistence below 1.1250 is achieved on the daily basis. Pattern target is projected towards 1.1000. Trade Recommendations: A valid BUY entry can be offered around the current price levels of 1.1300-1.1330. T/P levels to be located around 1.1360 and 1.1420. S/L to be located below 1.1275. The material has been provided by InstaForex Company - www.instaforex.com |
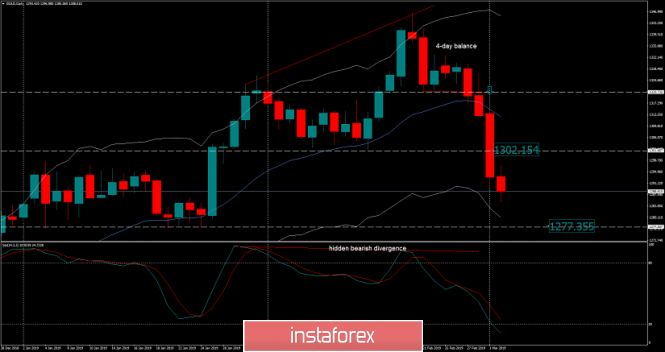
| Analysis of Gold for March 04, 2019 Posted: 04 Mar 2019 04:31 AM PST Gold continues trading downwards as we expected. There is strong downward momentum.
Our first downward target at the price of $1,302.00 has been reached. The bearish momentum is caused by the fake breakout of the resistance level at $1,325.00 and the breakout of the 4-day balance support at $1,320.00. Gold is heading to test our second target at the price of $1,277.35. Trading recommendation: We closed half of our bearish positions at $1,302.00 and the target for the second half is set at $1,277.35. SL was moved to $1,302.15. The material has been provided by InstaForex Company - www.instaforex.com |
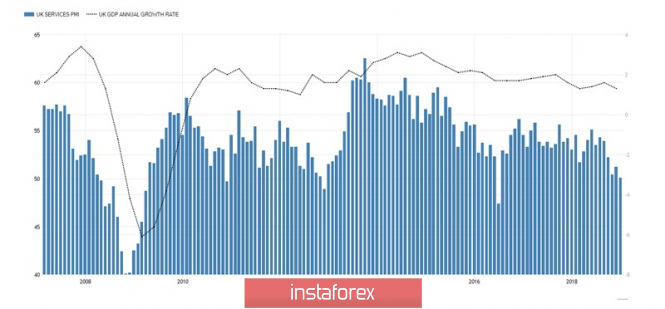
| Posted: 04 Mar 2019 03:42 AM PST This has been issued the best week so far. For the last month, the pound, leading the G10 race, was forced to slow down due to weak statistics on business activity in the manufacturing sector. In February, British companies actively reduced their employees and increased stocks, fearing Brexit's indiscriminate behavior. As a result of which, the purchasing managers index slowed down from 52.6 to 52. This is the weakest indicator over the past four months and its second worst since voting on the country's membership in The EU in the summer of 2016. The economy of Foggy Albion is in a fever, but the sterling who is fixated on improving the political landscape pays little attention to this. Rumors that Theresa May will propose for the Parliament to extend the Article 50 of the Lisbon Treaty are pulling the GBP / USD up. Investors sincerely hope that this will lead either to a soft Brexit, or to a repeated referendum. The result of the latter could be the preservation by Britain of a place in the European Union. However, public opinion polls show that the balance of power is currently about the same (53% for staying in the EU, 47% against) in the summer of 2016 on the eve of the first vote. The pound leads for a falling volatility ( a three-month implied indicator fell to its lowest level since mid-autumn) and bullish forecasts of large banks. So, Deutsche Bank believes that the current GBP / USD rally is fully justified. Investors are laying in quotes for a couple waiting for the date of the divorce to be postponed from March 29 to a later period. Goldman Sachs says that there is a closure of positions to hedge the risk of disorderly Brexit. Few people currently believe that the sterling will collapse to $ 1.15. In the worst case, where it leads to to $ 1.24, UBS recommends buying it. At the same time, it is necessary to understand that now the pound is growing on rumors. However, if parliamentarians prolong Article 50 of the European Union Code, uncertainty will again fall on Britain, which in recent years has led to a decline in business activity and a slowdown in GDP. In this regard, the March 5 release of the services PMI is a risk factor for bulls on GBP / USD. If it were not for the negative from the economy, the pair, according to MUFG, would have already taken off to 1.36-1.37. PMI Dynamics in Services and GDP in Britain
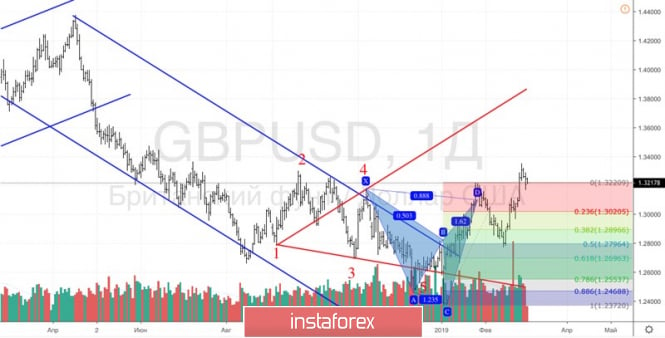
Support for buyers GBP / USD was provided by the US administration. Donald Trump once again criticized Jerome Powell, calling him a gentleman who likes to raise rates and a strong dollar. According to the president, a strong currency blocks the oxygen for doing business abroad for American companies. Although the markets have rather calmly reacted to verbal interventions, it is rumored that the plans of the owner of the White House will be implemented with other people's help. Technically, on the daily GBP / USD chart, the implementation of the 5-0 pattern takes place. A rollback to 50% of the CD wave allowed to form longs. And at present, the pair are moving north to the target using the "Wolfe Wave" model. They correspond to marks of 1.35 and 1.39. GBP / USD daily graph
|
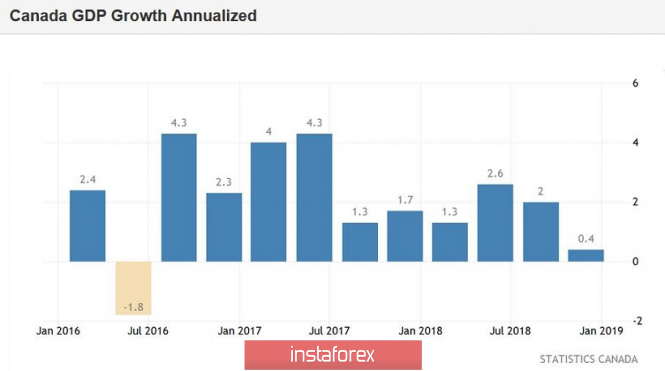
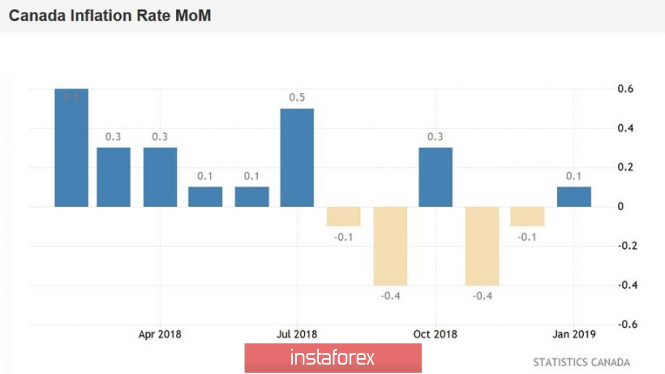
| USD / CAD: bad news ahead of Bank of Canada meeting Posted: 04 Mar 2019 03:23 AM PST On Friday, the Canadian dollar lost all positions. In just a few hours, it weakened by almost 200 points against the US currency. The Canadian was barely able to gain a foothold in the middle of the 31st figure. Disappointing statistics pushed the currency out of the multi-day range, after which the pair usd / cad reached the level of 1.3305. This week, the northern dynamics of the pair may get its continuation, since the March meeting of the Bank of Canada will take place on Wednesday. However, the Canadian plays out the expected results of the meeting for now. Given the weakness of the latest macroeconomic reports, it is not difficult to predict the tone of the regulator's statements. Friday data on GDP growth in Canada only confirmed this fact, only adding to the general negative picture of a fundamental nature. The volatile reaction of the market is fully justified because the growth of the Canadian economy has actually stopped. On a monthly basis, GDP for the second month in a row is in the negative area (-0.1%). If we talk about quarterly terms, in the last quarter of last year, the key indicator grew by only one tenth of a percent compared to the third quarter. The dynamics of GDP, calculated on an annualized basis (it is believed that such an assessment is closer to the US estimate of growth rates), is also disappointing. Instead of the expected growth of up to 1%, the real numbers were much lower - 0.4%.
It is worth noting that such a weak result is due not only to the decline in the oil market at the end of last year (although this factor is one of the key factors). The structure of the indicators suggests that the Canadian economy has slowed down due to lower growth in the housing market and a general decline in consumer confidence. For example, the average cost of housing over the past year has decreased by almost six percent, in particular due to lower demand and more stringent and complex rules for obtaining mortgage. The remaining structural elements of GDP also show negative dynamics: for example, the volume of investment in the Canadian economy decreased by 2.7%, investment in real estate - by 3.9%, and new projects - by 5.5%. The dynamics of the industrial sector are also disappointing, especially against the background of an uncertain situation in the oil market. A significant drop in consumer activity is also a serious problem. In January, the core retail sales index remained in the negative area again (for the third month in a row), while the increase in the full-time employment rate slowed down significantly, while part-time employment was gaining momentum. This is reflected in the dynamics of wage growth in the country, and the dynamics of household spending has been falling for the second quarter in a row. This dynamic inevitably leads to a weakening of price pressure. The January consumer price index rose only to 0.1% on a monthly basis (with a weak growth forecast to 0.2%) and decreased to 1.4% in annual terms (this is the weakest growth rate since October 2017). Core inflation also showed a negative trend, falling from 1.7% to 1.5% (g / g). The most significant decrease in electricity prices in January - immediately by 6.9% compared with the previous year.
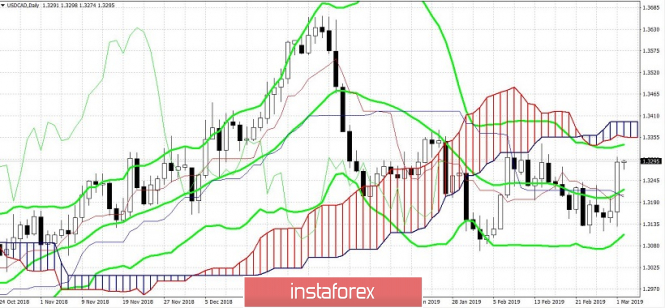
Thus, almost all macroeconomic indicators - both the most important and secondary - show a slowdown or stagnation. A kind of quintessence was the Friday release of data on the growth of Canadian GDP. Now, there can be no doubt: the Bank of Canada on Wednesday, firstly, will take a waiting position and keep the parameters of monetary policy in its previous form; secondly, he will voice "dovish" rhetoric, announcing a long pause in the matter of raising rates. By and large, the head of the Central Bank Stephen Poloz at the end of February already hinted at such a decision, but the extremely weak growth of the Canadian economy can strengthen the "bearish" mood among the members of the regulator. By the way, there are more and more rumors on the market that members of the Canadian regulator will follow their American counterparts and will wait until the end of the year. Despite such an unambiguous fundamental background for a pair of usd / cad, the technical picture does not say anything definite. The Ichimoku Kinko Hyo indicator is "silent", hinting only at a possible corrective decline by the fact that the pair is under the Kumo cloud. At the same time, the price is located between the middle and upper lines of the Bollinger Bands indicator on the daily chart, holding back the downward movement by the support level, which is located on the middle line of the indicator and corresponds to 1.3225. The resistance level is the upper line of the Bollinger Bands and the price is 1.3340.
Summarizing what has been said, one can come to the conclusion that from the point of view of the foundation, the priority remains over the north, especially on the eve of the March meeting of the Bank of Canada. A pair of usd / cad can be ignored even the temporary weakening of the greenback, which was under pressure after Trump's speech during the weekend. The American president again criticized the Fed's policy and complained about the high dollar rate. These factors, according to Trump, are constraining factors for the growth of the US economy. The dollar index at the opening of the trading week slipped a bit, but rather quickly recovered. The fact is that it is not the first time when Trump voiced such rhetoric, but this criticism does not have any practical significance (in the context of the dismissal of the Fed head or other cardinal decisions). Given this fact, the market actually ignored the impulsive words of the American president. In other words, a pair of usd / cad has every chance to go into the area of the 33rd figure and test the first resistance level of 1.3340. The material has been provided by InstaForex Company - www.instaforex.com |
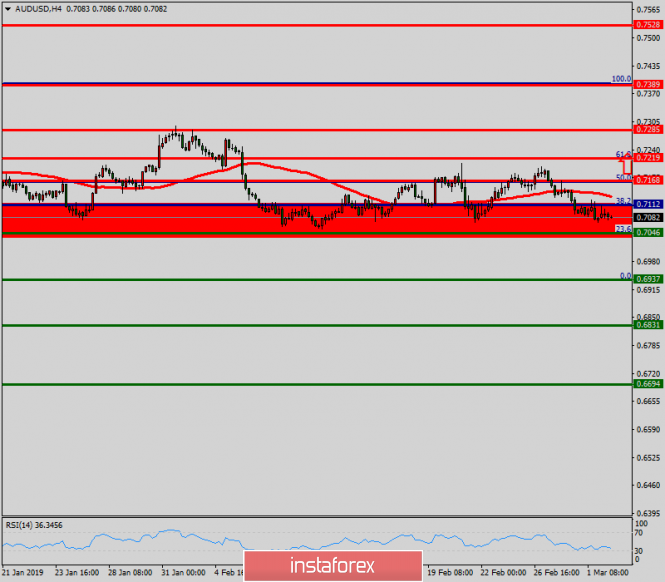
| Technical analysis of AUD/USD for March 04, 2019 Posted: 04 Mar 2019 02:53 AM PST |
| Fractal analysis of major currency pairs on March 4 Posted: 04 Mar 2019 02:33 AM PST Dear colleagues, For the Euro / Dollar pair, we mainly expect a downward movement, which should occur after the breakdown of 1.1360. For the pair Pound / Dollar, the price is in deep correction and forms the potential from the bottom of February 27. The pair Dollar / Franc price forms the initial conditions for the top of February 28. The development of which is expected after the breakdown of 1.0022. The pair Dollar / Yen is following the development of the upward cycle of February 27. The development of the impulse is expected after the breakdown 112.23. For the Euro / Yen pair, we follow the upward cycle from February 22. We expect further uptrend after the breakdown of 127.61. On the Pound / Yen pair, the main development of the upward trend from February 22 is expected after the passage of the noise range 147.75 - 148.21, the level 146.80 key support. For at Forecast March 4: Analytical review of H1-scale currency pairs:
The for Euro / Dollar pair, the key a levels on the H1 scale are: 1.1455, 1.1442, 1.1423, 1.1406, 1.1376, 1.1360, 1.1333 and 1.1322. Here the price is in equilibrium. Short-term upward movement is expected in the corridor 1.1406 - 1.1423. The breakdown of the last value should be accompanied by a pronounced upward movement. Here, the target is 1.1442. The potential value for the top is considered the level of 1.1455, after reaching this level which we expect consolidation, as well as a rollback to the correction. Short-term downward movement is possible in the corridor 1.1376 - 1.1360. The breakdown of the latter value will lead to a prolonged correction. Here, the target is 1.1333. The range 1.1333 - 1.1322 is a key support for the upward structure. The main trend is the equilibrium state. Trading recommendations: Buy 1.1406 Take profit: 1.1421 Buy 1.1424 Take profit: 1.1441 Sell: 1.1374 Take profit: 1.1361 Sell: 1.1358 Take profit: 1.1335
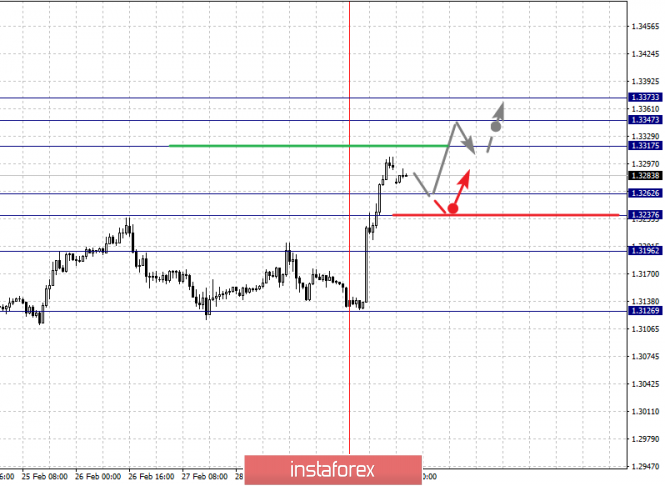
The for Pound / Dollar pair, the key a levels on the H1 scale are 1.3419, 1.3340, 1.3278, 1.3210, 1.3171, 1.3132, 1.3105 and 1.3041. Here, the price is in deep correction with the uptrend and forms the potential from the bottom of February 27. Short-term downward movement is expected in the corridor 1.3210 - 1.3171. The breakdown of the latter value will allow us to expect to move to level 1.3132, in the corridor 1.3132 - 1.3105 consolidation. The potential value for the bottom is considered the level of 1.3041. After reaching this level, we expect a rollback to the top. Level 1.3278 is a key support for the downward structure of February 27. Its price passage will have to form a local ascending structure. In this case, the first target is 1.3340. As a potential value for the top, we consider the level 1.3419. The main trend is the upward cycle of February 14, the stage of deep correction. Trading recommendations: Buy: 1.3278 Take profit: 1.3340 Buy: 1.3342 Take profit: 1.3417 Sell: 1.3210 Take profit: 1.3172 Sell: 1.3169 Take profit: 1.3132
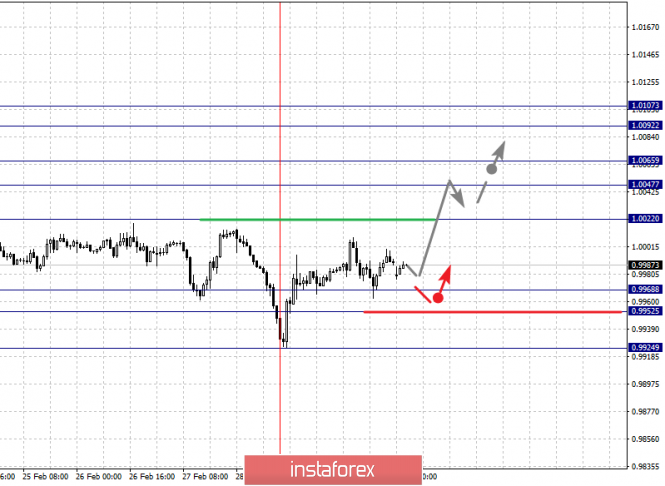
The for Dollar / by Frank pair, the key a levels on the H1 scale are: 1.0107, 1.0092, 1.0065, 1.0047, 1.0022, 0.9968, 0.9952 and 0.9924. Here, we follow the formation of the initial conditions for the top of February 28. The continuation of the upward movement we expect after the breakdown 1.0022. In this case, the target is 1.0047. In the corridor 1.0047 - 1.0065, a short-term upward movement is shown, as well as consolidation. The breakdown of the level of 1.0065 should be accompanied by a pronounced upward movement. Here the goal is 1.0092. The potential value for the top is considered the level of 1.0107, upon reaching which we expect consolidation, as well as a rollback to the top. Short-term downward movement is possible in the corridor 0.9968 - 0.9952. The breakdown of the latter value will lead to movement to the first potential target - 0.9924. The main trend - the formation of the ascending structure of February 28. Trading recommendations: Buy: 1.0022 Take profit: 1.0047 Buy: 1.0065 Take profit: 1.0090 Sell: 0.9968 Take profit: 0.9953 Sell: 0.9950 Take profit: 0.9925
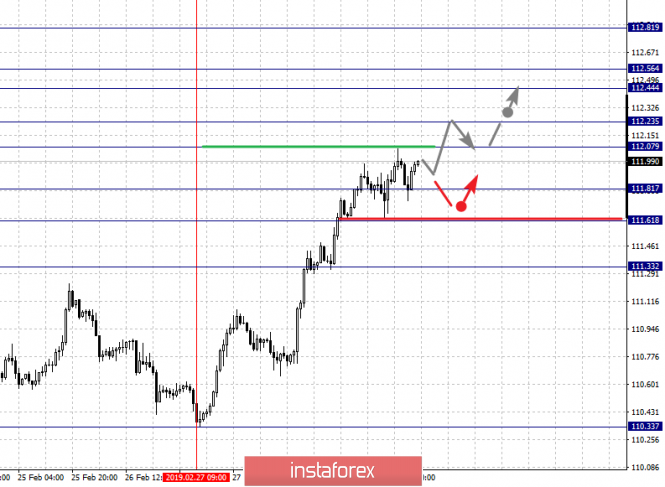
The for Dollar / to Yen pair, the key on the scale a levels are: 112.81, 112.56, 112.44, 112.23, 112.07, 111.81, 111.61 and 111.33. Here, we continue to monitor the ascending structure of February 27. Short-term upward movement is expected in the range of 112.07 - 112.23. The breakdown of the last value should be accompanied by a pronounced upward movement. Here, the goal is 112.44 in the corridor 112.44 - 112.56 consolidation of the price. The potential value for the top is considered the level of 112.81. After reaching this level, we expect a departure to a correction. Short-term downward movement is possible in the corridor 111.81 - 111.61. The breakdown of the latter value will lead to a prolonged correction. Here, the target is 111.33. This level is a key support for the upward structure of February 27. The main trend: the upward cycle of February 27. Trading recommendations: Buy: 112.07 Take profit: 112.21 Buy: 112.25 Take profit: 112.44 Sell: 111.80 Take profit: 111.63 Sell: 111.58 Take profit: 111.35
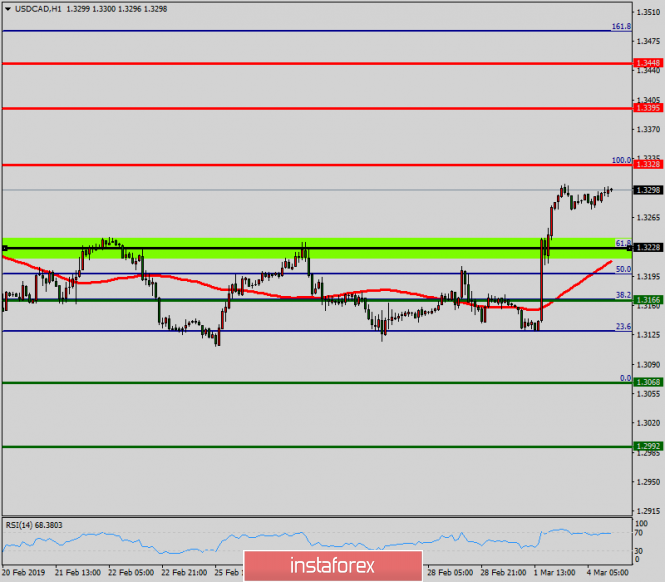
For the Canadian dollar / Dollar pair, the key a levels on the H1 scale are: 1.3373, 1.3347, 1.3317, 1.3262, 1.3237 and 1.3196. Here, after the cancellation of the potential for downward movement, we are following the formation of the initial conditions for the top of March 1. Movement up is expected after breakdown 1.3317. In this case, the goal is 1.3347. The potential value for the uptrend for now is considered the level of 1.3373. Before which, we expect the registration of the expressed initial conditions. Short-term downward movement is possible in the corridor 1.3262 - 1.3237. The breakdown of the latter value will lead to in-depth correction. Here, the goal is 1.3196. This level is a key support for the top. The main trend is the formation of the initial conditions for the ascending cycle of March 1. Trading recommendations: Buy: 1.3317 Take profit: 1.3345 Buy: 1.3347 Take profit: 1.3372 Sell: 1.3261 Take profit: 1.3238 Sell: 1.3235 Take profit: 1.3198
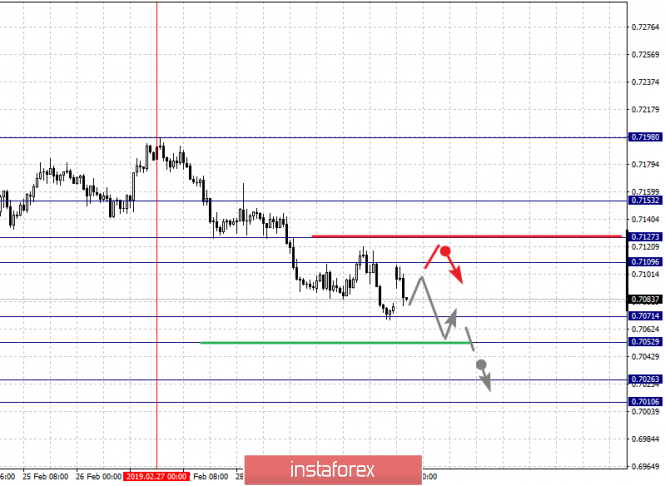
The for the Australian dollar / dollar pair, the key a levels on the H1 scale are : 0.7153, 0.7127, 0.7109, 0.7071, 0.7052, 0.7026 and 0.7010. Here, we are following the development of the downward cycle of February 27. Short-term downward movement is expected in the corridor 0.7071 - 0.7052. The breakdown of the last value should be accompanied by a pronounced downward movement. Here, the goal is 0.7026. The potential value for the bottom is considered the level of 0.7010, upon reaching which we expect a rollback to the top. Short-term upward movement is possible in the corridor 0.7109 - 0.7127. The breakdown of the latter value will lead to a deep correction. Here, the target is 0.7153. This level is a key support for the downward structure. The main trend is the downward cycle of February 27. Trading recommendations: Buy: 0.7109 Take profit: 0.7125 Buy: 0.7128 Take profit: 0.7152 Sell: 0.7070 Take profit: 0.7054 Sell: 0.7051 Take profit: 0.7026
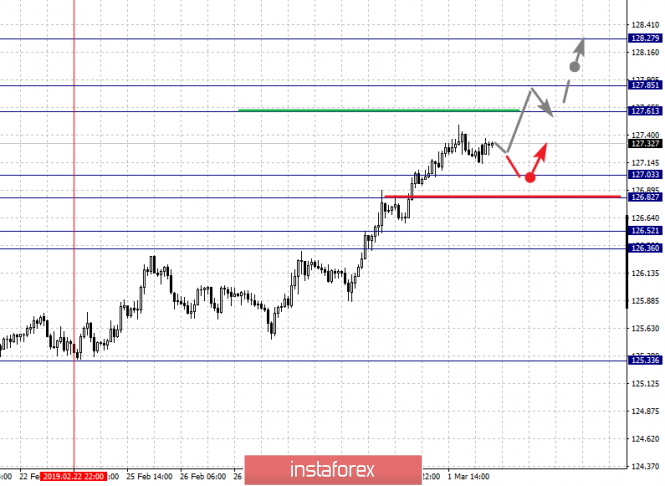
The for Euro / to Yen pair, the key a levels on the H1 scale are: 128.27, 127.85, 127.61, 127.03, 126.82, 126.52 and 126.36. Here, we continue to monitor the local ascending structure of February 22. A short-term upward movement is expected in the corridor 127.61 - 127.85. The breakdown of the last value will allow us to count on the movement towards a potential target - 128.27. From this level, we expect a departure to the correction. Short-term downward movement is expected in the corridor 127.03 - 126.82. The breakdown of the latter value will lead to in-depth movement. Here, the target is 126.52 with Range 126.52 - 126.36 noise, to 126.36. We expect the initial conditions for the downward cycle. The main trend is the local structure for the top of February 22. Trading recommendations: Buy: 127.61 Take profit: 127.82 Buy: 127.87 Take profit: 128.25 Sell: 127.03 Take profit: 126.84 Sell: 126.80 Take profit: 126.55
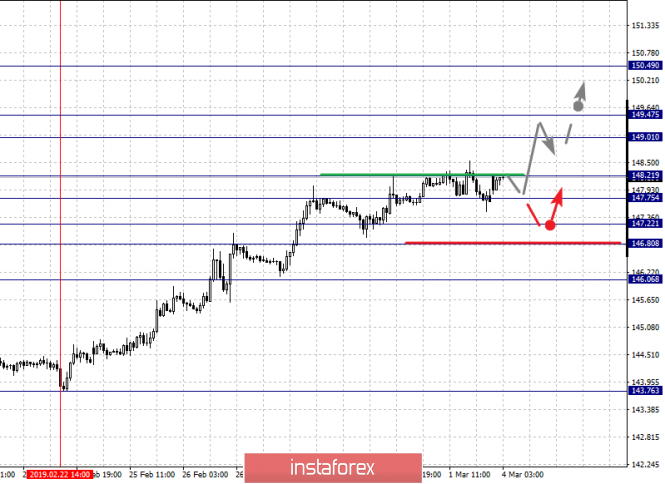
The for Pound / to Yen pair, the key a levels on the H1 scale are: 150.49, 149.47, 149.01, 148.21, 147.75, 147.22, 146.80 and 146.06. Here, we continue to monitor the ascending structure of February 22. Short-term upward movement is expected in the corridor 147.75 - 148.21. The breakdown of the latter value should be accompanied by a pronounced upward movement. Here, the target is 149.01 in the corridor 149.01 - 149.47 short-term upward movement, as well as consolidation. The potential value for the top is considered the level of 150.49, upon reaching which we expect a rollback downwards. Short-term downward movement is possible in the corridor 147.22 - 146.80. The breakdown of the latter value will lead to in-depth correction. Here, the target is 146.06. This level is a key support for the top. The main trend is the local structure for the top of February 22. Trading recommendations: Buy: 147.77 Take profit: 148.20 Buy: 148.25 Take profit: 149.00 Sell: 147.22 Take profit: 146.82 Sell: 146.78 Take profit: 146.10 The material has been provided by InstaForex Company - www.instaforex.com |
| Technical analysis of USD/CAD for March 04, 2019 Posted: 04 Mar 2019 02:14 AM PST The USD/CAD pair continues to move upwards from the level of 1.3228. Today, the first support level is currently seen at 1.3228, the price is moving in a bullish channel now. Furthermore, the price has been set above the strong support at the level of 1.3228, which coincides with the 61.8% Fibonacci retracement level. This support has been rejected three times confirming the veracity of an uptrend. According to the previous events, we expect the USD/CAD pair to trade between 1.3228 and 1.3328. So, the support stands at 1.3228, while daily resistance is found at 1.3328. Therefore, the market is likely to show signs of a bullish trend around the spot of 1.3228. In other words, buy orders are recommended above the spot of 1.3228 with the first target at the level of 1.3328; and continue towards 1.3295. However, if the USD/CAD pair fails to break through the resistance level of 1.3328 today, the market will decline further to 1.3166 -1.3200. The material has been provided by InstaForex Company - www.instaforex.com |
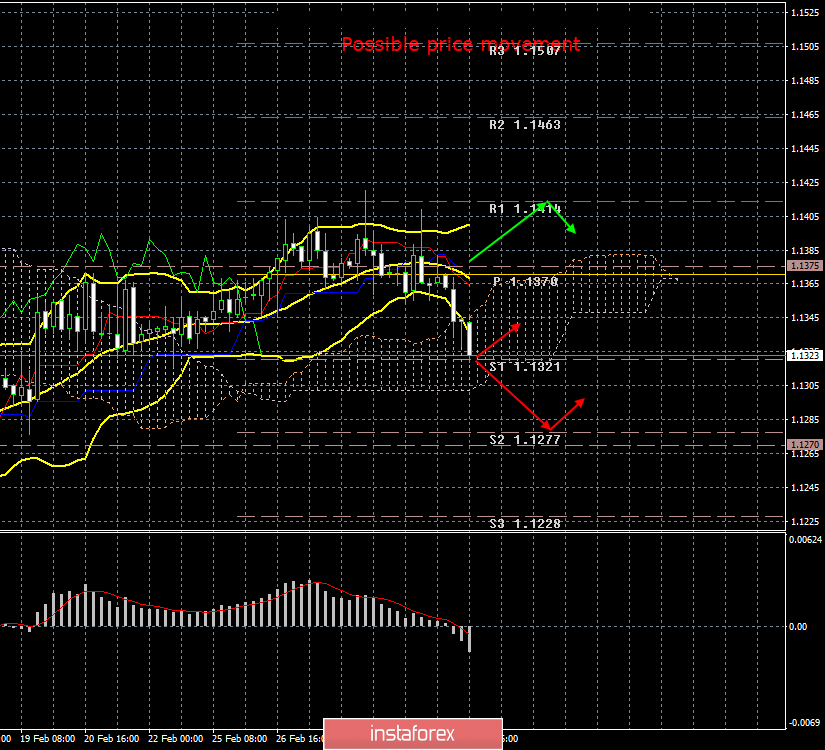
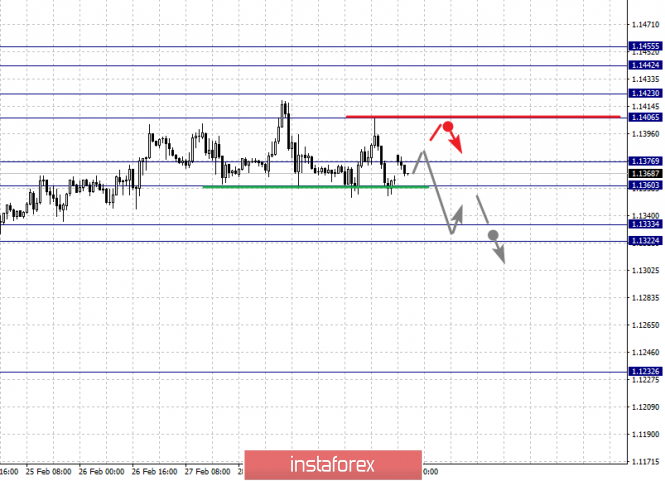
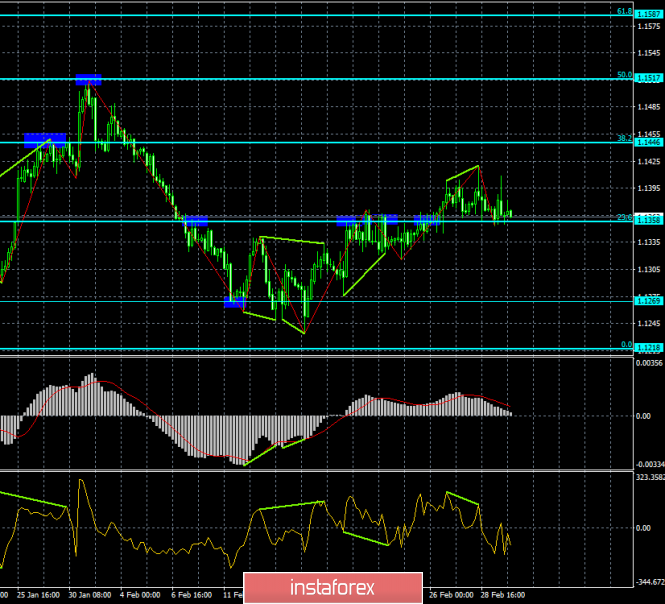
| Posted: 04 Mar 2019 02:04 AM PST 4h
On the 4-hour chart, the EUR / USD pair performed a new return to the correctional level of 23.6% - 1.1358. On March 4, the end of quotes from this level will allow to count on a turn in favor of the EU currency and the resumption of growth in the direction of the 38.2% correction level - 1.1446. There is not a single indicator on the current chart that has diverging effects today. Moreover, closing quotes below the Fibo level of 23.6% will increase the pair's chances of continuing falling towards 1.1269. The Fibo grid was built on extremums from September 24, 2018 and November 12, 2018. Daily On the 24-hour chart, the quotes of the pair reversed in favor of the US dollar and began a slow decline in the direction of the correction level 127.2% - 1.1285 after the formation of a bearish divergence. Closing the course of the pair below this level will allow traders to expect a continuation of the fall in the direction of the next Fibo level 161.8% - 1.0941. On the other hand, rebounding the pair from the level of 127.2% will work in favor of the euro currency and the resumption of growth in the direction of the correction level 100.0% - 1.1553. The Fibo net is built on extremums from November 7, 2017 and February 16, 2018. Recommendations to traders: Purchases of the EUR / USD pair can be carried out with the target of 1.1446, if the pair disconnects from the level of 1.1358, and the Stop Loss order is below the 23.6% level. But be careful, since there is a bearish divergence on the 24-hour chart. Sales of the EUR / USD pair can be made with the target of 1.1269, and with a Stop Loss order above the level of 1.1358, if the pair closes below the Fibo level of 23.6%. The material has been provided by InstaForex Company - www.instaforex.com |
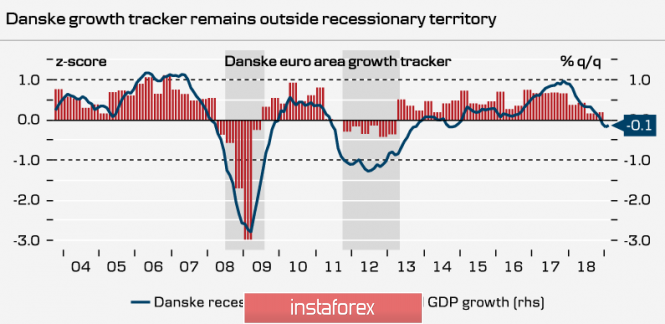
| Posted: 04 Mar 2019 01:58 AM PST Most of the macroeconomic indicators published on Friday in the eurozone coincided with forecasts, which did not give the euro an opportunity to go beyond the borders of the emerging range. The volume of retail sales in Germany in January at + 3.3% came as a surprise after a flop of -4.3% in December, taking into account Christmas and New Year's sales. The February PMI in the manufacturing sector was confirmed at 47.6p, a weak indicator, but there is no deterioration relative to preliminary data. Unemployment in the euro area remained at 7.8 %, while the deterioration forecast reached 7.9%. Preliminary inflation data coincided with the forecasts. Concerns about the approaching recession in the eurozone are intensifying. A wide range of economic and financial parameters indicates that the risk of slowing down is based on serious factors. DanskeBank issued a special review, which combined 12 major economic and 4 financial variables, which in historical data showed a good correlation with the economic cycle. The dynamics of the resulting indicator shows that a decrease in the value below -1 coincides with periods of recession.
At the moment, the indicator has a value of -0.1p, which means that, it has clearly not yet reached the recession zone; therefore, there is a chance to stop negative trends and return to the growth trajectory. According to DanskeBank, financial variables show clear regression trends, while economic ones remain close to long-term averages. This stroke may indicate a deep-seated problem that is now unfolding in front of all the major world central banks - by what financial and monetary methods to influence the economic situation, if the traditional instruments are almost exhausted. Today, Sentix will publish an investor confidence index in March, and Eurostat will report on producer prices in February. The general background for the euro remains neutral and the chances of going beyond the range formed on Friday are small. Support 1.1352, resistance 1.1396. Attempting to leave below support may strengthen bearish moods. In this case, support will move to 1.1315. GBPUSD The pound received some support on Friday after the publication of macroeconomic data. Reports on consumer and mortgage lending provided by the Bank of England in January indicate high consumer activity, which, in turn, will support price indices. The PMI index in the manufacturing sector in February was 52.0p which is slightly worse than 52.6p a month earlier, but still indicates expansion, not compression of the sector.
The USTR (US Trade Representation) has published the concept of the US approach to the upcoming trade negotiations with the UK after the latter left the EU. Noting the importance of trade relations between the first and fifth economies of the world, the United States will proceed from the fact that Great Britain will be freed from the restrictions under which it operated while in the EU, which means the entire volume of mutual trade of $ 230 billion will be revised. It is noted that "... numerous tariff and non-tariff barriers challenge US exporters in key sectors ...", that is, the US is openly and unequivocally preparing to revise the tariff policy in its favor. Leaving the EU, the UK will untie the hands of negotiators in the US who are ready to put forward a number of stringent requirements - full access to the British agricultural market, the elimination of phytosanitary barriers, which will support "... consumers, farmers, ranchers and workers in the US ..." . The British authorities will have to prepare for a noticeable deterioration in external economic conditions, and the pound in this situation may not realize the growth potential, which, as it is believed, has already been formed. The pound will be traded in the range in anticipation of the results of voting in the parliament on March 12-14. With a small margin of negative, the price will gradually move to support 1.3170, but it is unlikely to go lower. The material has been provided by InstaForex Company - www.instaforex.com |
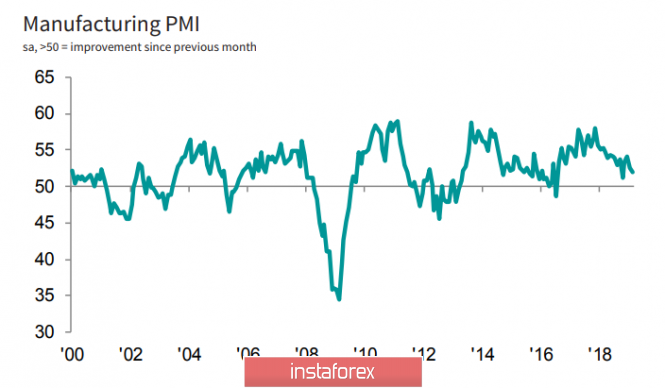
| Posted: 04 Mar 2019 12:35 AM PST The euro rose after weak reports on the US economy, but buyers of risky assets did not receive support from major players, which led to profit taking and a decrease in the trading instrument in the afternoon. A weak report on the spending of Americans indicates their more attentive attitude and some concern about the pace of economic growth. However, there is no reason to worry. According to the US Department of Commerce, personal expenses in December 2018 fell by 0.5% compared with the previous month. With income, the situation remains more favorable. The report indicates that personal income in January decreased by 0.1%, but in December 2018, the growth was 1.0%. Expenditure data in January was not provided due to the partial suspension of government work. Economists had expected spending to fall by 0.3% in December and revenue growth by 0.3% in January. Activity in the US manufacturing sector is slowing. According to IHS Market, the final PMI purchasing managers index for the manufacturing sector in February 2019 fell to 53.0 points against 54.9 points in January. Index values above 50 indicate an increase in activity. Economists had expected the index to be 54.0 points in February. In Market, it is noted that the decrease in the index may be temporary, as manufacturers say a steady improvement in the state of the sector. US consumer sentiment worsened at the end of February, and it is not surprising. As stated in the University of Michigan report, the final consumer sentiment index in February 2019 fell to 98.3 points from 95.5 points last month. Economists predicted that the index will be 95.8 points. The main decline in sentiment is associated with a partial suspension of the US government and volatility in the stock market. It should be noted that the overall level of trust remains quite positive. As for the technical picture of the EURUSD pair, it remained unchanged. Buyers still need a return to the resistance level of 1.1385, and sellers have a breakout and consolidation below the support of 1.1354. In the first scenario, you can wait for the update highs in the region of 1.1420 and 1.1460, while the second scenario will lead to an update of the minimum in areas 1.1320 and 1.1280. On Friday, the Canadian dollar collapsed against the US dollar after it became known that Canadian economy growth slowed down in the 4th quarter. This happened due to a sharp decline in investment, as well as a fall in household spending. According to the National Bureau of Statistics of Canada, the gross domestic product of Canada in the 4th quarter of 2018 grew by 0.4% year on year, amounting to 2.063 trillion Canadian dollars. Let me remind you that back in the 3rd quarter, GDP growth was 2.0%. Economists had expected GDP growth in the 4th quarter to be 1.0%. For the whole of 2018, Canada's GDP growth was 1.8% against 3.0% in 2017. The material has been provided by InstaForex Company - www.instaforex.com |
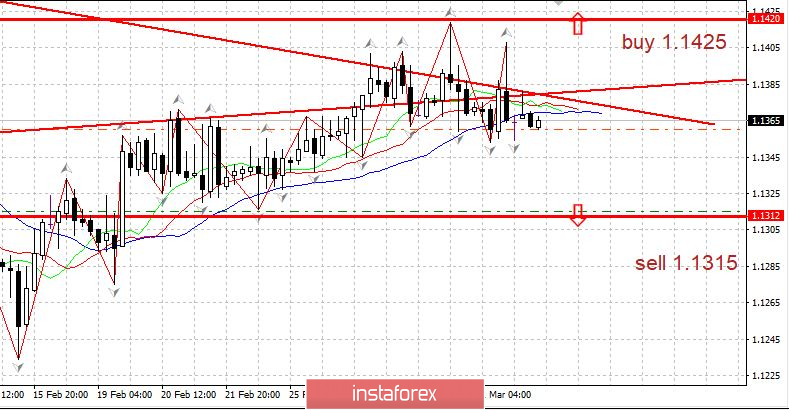
| Posted: 04 Mar 2019 12:28 AM PST Last week, the EURUSD rate failed to break through the boundaries of the long range and start movement. A new upper bound for the range is formed: level 1.1425 The main event for the euro in the new week is the ECB's meeting on monetary policy on Thursday, March 7. It will be enough for the ECB and its head Draghi to say a few words about the risk of inflation in the eurozone - and this could provide a beginning to a strong movement. In addition, the US labor market report on Wednesday (ADP) and Friday (NonFarm Payrolls) will be important. On Wednesday, the Fed will report on the state of the economy through the "Beige book". We are waiting for a break in the range and take positions in the direction of movement: Buy the euro from 1.1425. Alternative: sell the euro from 1.1315 and then sell the European currency from 1.1230. |
| Wave analysis of EUR / USD for March 4. The pair is still preparing to decline Posted: 04 Mar 2019 12:13 AM PST Wave counting analysis: On Friday, March 1, bidding ended for EUR / USD with a couple of bp decrease. Thus, the wave pattern does not require any additions or corrections. And, accordingly, it remains unchanged - wave 4 can be completed, and if this is the case, the decline in quotations will continue from the current positions within the framework of the future wave 5 of the downward trend. The news background on Friday is composed of several information. News from America about business activity indices did not form dollar buyers, but inflation in the EU did not make euro buyers happy. Immediately, two unsuccessful attempts to make a breakthrough level of 61.8% Fibonacci indirectly indicate the pair's readiness to decline. Sales targets: 1.1228 - 0.0% Fibonacci Shopping goals: 1.1408 - 61.8% Fibonacci 1.1448 - 76.4% Fibonacci General conclusions and trading recommendations: The pair allegedly completed building wave 4 near the Fibonacci level of 61.8%. Thus, I recommend small sales of the pair, based on building a downward wave 5 with targets located near the level of 1.1230, which corresponds to 0.0% Fibonacci, and a protective order above the level of 61.8%. Small - until wave 5 is developed. The material has been provided by InstaForex Company - www.instaforex.com |


| You are subscribed to email updates from Forex analysis review. To stop receiving these emails, you may unsubscribe now. | Email delivery powered by Google |
| Google, 1600 Amphitheatre Parkway, Mountain View, CA 94043, United States | |
No comments:
Post a Comment