
Forex analysis review |
- The rise and fall of the Canadian dollar: causes and conclusions
- USD/JPY approaching resistance, potential drop!
- EUR/USD approaching resistance, potential drop!
- NZD/USD approaching resistance, potential drop!
- April 17, 2019 : GBP/USD Intraday technical analysis and trade recommendations.
- April 17, 2019 : EUR/USD Intraday technical analysis and trade recommendations.
- EUR and GBP: Euro and pound decline after weak inflation reports coinciding with economists' forecasts
- GBP/USD: plan for the US session on April 17. Buyers of the pound are trying to keep the pair from falling
- EUR/USD: plan for the American session on April 17. Bulls hit a new resistance 1.1320
- Bitcoin is about to drop - Analysis for April 17,2019
- Gold analysis for April 17, 2019
- USD/JPY analysis for April 17, 2019
- EUR/USD: "upper classes" can not, and the "lower classes" do not want to?
- Technical analysis of AUD/USD for April 17, 2019
- Technical analysis of USD/CAD for April 17, 2019
- Fractal analysis of major currency pairs as of April 17
- Analysis of EUR/USD divergence for April 17. Divergences continue to support the euro
- Analysis of GBP/USD divergences for April 17th. The US dollar again takes the upper hand in the confrontation with the pound
- GBP/USD. April 17th. The trading system "Regression Channels". Traders are waiting for action from major players and inflation
- EUR/USD. April 17th. The trading system "Regression Channels"
- Gold fell into disgrace
- China's economy is surprising but it's too early to talk about recovery
- Wave analysis for GBP / USD pair on April 17. Britons tend to fall below the 30th figure
- Wave analysis for EUR / USD pair on April 17. Euro continues to win back against the dollar
- How do data from China affect different dollars differently?
| The rise and fall of the Canadian dollar: causes and conclusions Posted: 17 Apr 2019 08:04 PM PDT Today, the Canadian dollar was able to simultaneously disappoint both bears and bulls of the USD/CAD pair. After the release of data on the growth of inflation in Canada, the Looney unexpectedly showed a downward impulse and quite confidently, almost 100 points lower. As soon as traders adapted to the new conditions, the pair sharply turned 180 degrees and updated yesterday's high of literally in a few hours. As a rule, such price surges lead to certain losses even with the correct placement of stops. However, when analyzing previous events, we can conclude that the downward trend was doomed to failure although not so rapid. Take a look at the weekly timeframe of USD/CAD Looney has been trading in a wide price range 1.3270-1.3420 and more simply in the price range of 33-34 figures since the beginning of March. From the third of March, both buyers and bears intercept the initiative alternately, and, judging by the D1 schedule, the weekly schedule is observed. This is, of course, a coincidence but in this context, it is very significant. Today's price rebound suggests that traders are still not ready to go out of the boundary indicated above. Hence, as soon as the pair reached the level of 1.3270, the bears met with strong resistance after which the price literally returned to previous positions. It is noteworthy that both bears and bulls of the pair today have used fundamental factors as contradictory or disproportionate to their stated ambitions as information drivers. Thus, the USD/CAD reacted with a southern impulse at the start of the US session after the release of data on the growth of Canadian inflation. If we judge only based on the price chart, we can assume that inflation made a real breakthrough. Although in fact, almost all indicators came out at the forecast level. The consumer price index on a monthly basis remained at the level of February and grew to 0.7%. In annual terms, the figure rose to 1.9% which was expected by the experts. With basic inflation not everything is so smooth: the core index unexpectedly sank to 0.3% with a growth forecast of 0.7% on a monthly basis and it rose to 1.6% with a forecast of 1.3% in annual terms. Inflation did show a positive trend in almost all parameters but these figures were also expected by the market. The steady growth of the oil market for both Brent and WTI could not pass without a trace over the past few months. For example, gasoline in Canada increased by 11.6% in the month under study. In other words, the experts' forecasts were fully justified and today's results were widely expected. It is likely that in the future, Canadian inflation will be able to reverse the trend in favor of USD/CAD bears if it demonstrates a stable consistent growth. But even in this case, the market will consider the situation complex, starting with the state of the world or the Chinese economy and ending with the dynamics of the oil market. All of these factors should ultimately affect the determination of the Canadian regulator, who interrupted the monetary tightening cycle earlier this year. Let me remind you that at its last meeting, which was held in early March, the Bank of Canada retained the rate at 1.75%. This shows that it cannot say with certainty when the next round of increase will come. As noted in the Central Bank, the economic downturn, which began to grow at the end of last year. It turned out to be "stronger and more dynamic" than previously thought. There is the weakness of the real estate market and the reduction in consumer spending. Also noting a significant reduction in price pressure. Such rhetoric was voiced by the Canadian regulator a month ago but whether the Bank of Canada will change its position at the April meeting (which will take place in the week of April 24) is an open question. The answer to this question will allow traders to determine the vector of further movement of the USD/CAD pair in the long term. In this context, the reason for the upward pullback of USD/CAD looks very significant. The pair stopped the decline and grew by more than 100 points on only one report of the Energy Information Administration. According to the figures in this report, oil reserves in the United States fell by 1.4 million barrels after three weeks of growth in a row. On the one hand, this is rather unpleasant news for the oil market and commodity currencies, but on the other hand, even oil quotes reacted quite coolly to this release as Brent minimally decreased from $72.15 to $71.65 and WTI from $64.45 to $63.70. In other words, the USD/CAD traders used this report only as a formal reason to return the price to previous levels, especially when the pair touched the lower limit of the price range of 1.3270-1.3420. All of these suggests that the Loonie will soon be trading at this level until the April meeting of the Bank of Canada. The material has been provided by InstaForex Company - www.instaforex.com |
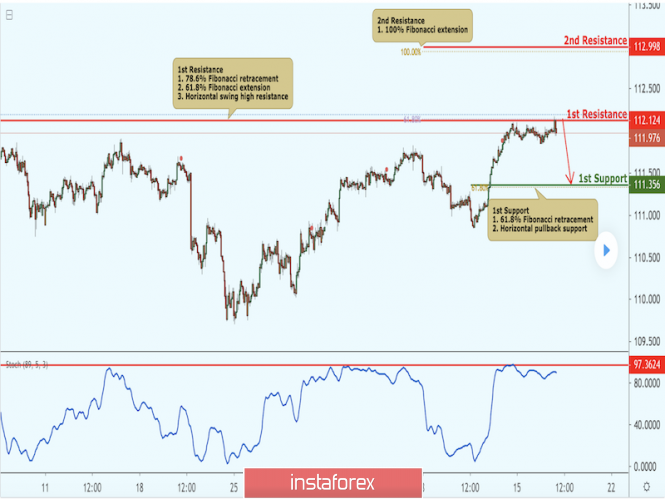
| USD/JPY approaching resistance, potential drop! Posted: 17 Apr 2019 06:56 PM PDT USDJPY is approaching our first resistance at 112.12 (horizontal swing high resistance, 76.4% Fibonacci retracement , 61.8% Fibonacci extension ) where a strong drop might occur below this level pushing price down to our major support at 111.35 (61.8% Fibonacci retracement ). Stochastic is also approaching resistance where we might see a corresponding drop in price. Trading CFDs on margin carries high risk. Losses can exceed the initial investment so please ensure you fully understand the risks.
|
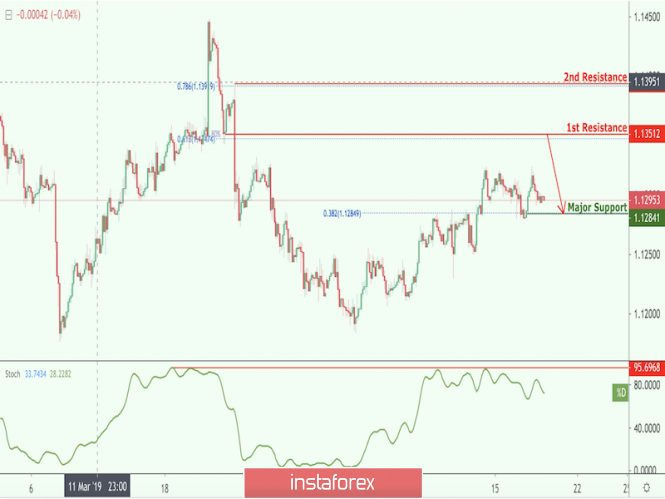
| EUR/USD approaching resistance, potential drop! Posted: 17 Apr 2019 06:55 PM PDT EURUSD is approaching our first resistance at 1.1351 (horizontal pullback resistance, 61.8% Fibonacci retracement , 61.8% Fibonacci extension ) where a strong drop might occur below this level to our first support level at 1.1284 (horizontal swing low support, 38.2% Fibonacci extension ). Stochastic is also approaching resistance where we might see a corresponding drop in price. Trading CFDs on margin carries high risk. Losses can exceed the initial investment so please ensure you fully understand the risks.
|
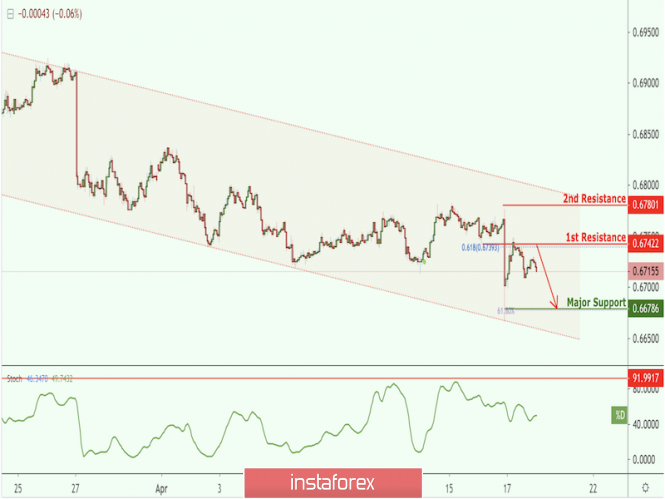
| NZD/USD approaching resistance, potential drop! Posted: 17 Apr 2019 06:52 PM PDT NZDUSD is approaching our first resistance at 0.6742 (horizontal overlap resistance, 61.8% Fibonacci retracement ) where a strong drop might occur below this level to our first support level at 0.6678 (horizontal swing low support, 61.8% Fibonacci extension ). Stochastic is also approaching resistance where we might see a corresponding drop in price. Trading CFDs on margin carries high risk. Losses can exceed the initial investment so please ensure you fully understand the risks.
|
| April 17, 2019 : GBP/USD Intraday technical analysis and trade recommendations. Posted: 17 Apr 2019 08:59 AM PDT
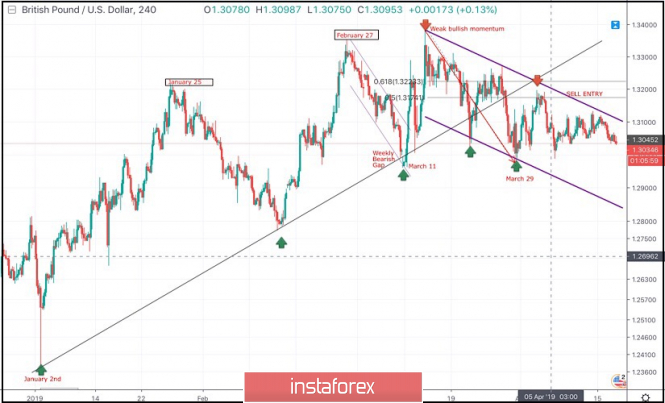
On January 2nd, the market initiated the depicted uptrend line around 1.2380. This uptrend managed to initiate two successive bullish waves towards 1.3200 (Jan. 25) then 1.3350 (Feb. 27) before the bearish pullback brought the GBPUSD pair towards the uptrend on March 8th. A weekly bearish gap pushed the pair below the uptrend line (almost reaching 1.2960) before the bullish breakout above short-term bearish channel was achieved on March 11. Shortly after, the GBPUSD pair demonstrated weak bullish momentum towards 1.3200 then 1.3360 where the GBPUSD failed to achieve a higher high above the previous top achieved on February 27. Instead, the depicted recent bearish channel was established. Significant bearish pressure was demonstrated towards 1.3150 - 1.3120 where the depicted uptrend line failed to provide any bullish support leading to obvious bearish breakdown. On March 29, the price levels of 1.2980 (the lower limit of the depicted movement channel) demonstrated significant bullish rejection. This brought the GBPUSD pair again towards the price zone of (1.3160-1.3180) where the upper limit of the depicted bearish channel as well as the backside of the depicted uptrend line came to meet the pair. Currently, the price zone of 1.3140-1.3170 corresponds to the upper limit of the depicted bearish channel where another bearish movement may be initiated. Bearish rejection is still anticipated around the mentioned price levels (1.3140-1.3170). Short-term outlook has turned into bearish towards 1.2920-1.2900 where the lower limit of the depicted channel is located. Trade Recommendations: Any bullish pullback towards 1.3150-1.3170 should be considered for another SELL entry. TP levels to be located around 1.3100, 1.3020 then 1.2950 - 1.2920. S/L to be located above 1.3190. The material has been provided by InstaForex Company - www.instaforex.com |
| April 17, 2019 : EUR/USD Intraday technical analysis and trade recommendations. Posted: 17 Apr 2019 08:50 AM PDT
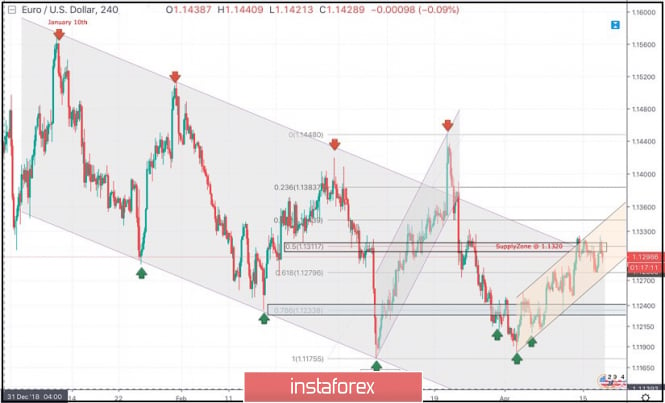
On January 10th, the market initiated the depicted bearish channel around 1.1570. Since then, the EURUSD pair has been moving within the depicted channel with slight bearish tendency. On March 7th, recent bearish movement was demonstrated towards 1.1175 (channel's lower limit) where significant bullish recovery was demonstrated. Bullish persistence above 1.1270 enhanced further bullish advancement towards 1.1290-1.1315 (the Highlighted-Zone) which failed to provide adequate bearish pressure. On March 18, a significant bullish attempt was executed above 1.1380 (the upper limit of the Highlighted-channel) demonstrating a false/temporary bullish breakout. On March 22, significant bearish pressure was demonstrated towards 1.1280 then 1.1220. Two weeks ago, a bullish Head and Shoulders reversal pattern was demonstrated around 1.1200. As expected, this enhanced further bullish advancement towards 1.1300-1.1315 (supply zone) where recent bearish rejection was being demonstrated. Short-term outlook turns to become bearish towards 1.1280 (61.8% Fibonacci) where price action should be watched cautiously. For Intraday traders, the price zone around 1.1280 stands as a prominent demand area to be watched for a possible BUY entry if enough bullish rejection is expressed. On the other hand, bearish breakdown below 1.1280 opens the way for further bearish decline towards 1.1250-1.1235. The material has been provided by InstaForex Company - www.instaforex.com |
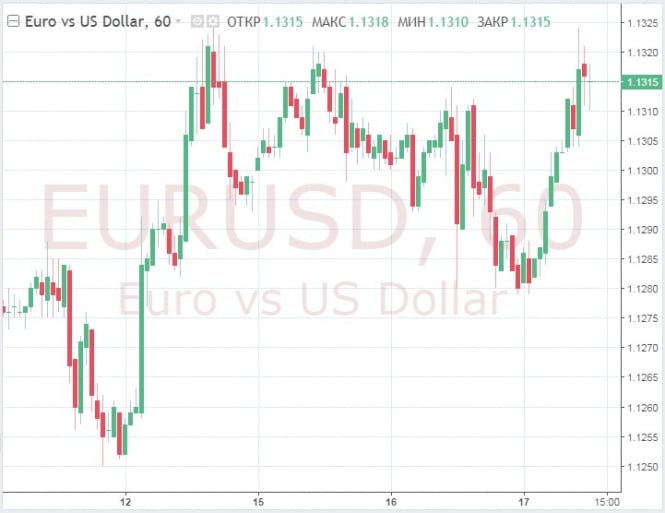
| Posted: 17 Apr 2019 08:01 AM PDT The positive balance of current account of payment balance of the eurozone has declined, but the positive balance of foreign trade in the eurozone increased. Such data were presented today in the morning. The report on inflation in the eurozone traders ignored, as it coincided with the forecasts of economists. As indicated in the report of the European Central Bank, the surplus of the current account of the balance of payments in the eurozone in February of this year fell to 27 billion euros against 37 billion euros in January. In February 2018, the eurozone's current account surplus was 32 billion euros. The decline is directly related to the slowdown in world trade. On the contrary, the eurozone's foreign trade surplus increased in February. However, is is too early to rejoice. Growth was achieved by reducing imports rather than increasing exports. According to the statistical agency Eurostat, foreign trade surplus in February 2019 increased to 19.5 billion euros from 17.4 billion euros in January. As noted above, imports of the eurozone declined by 2.7%, while exports only by 1.4%. Eurozone sales to other countries in February exceeded purchases by 17.9 billion euros, while in February the corresponding figure was 16.5 billion euros. Also today, a report on the consumer price index came out, which fully coincided with the forecasts of economists. According to Eurostat, the eurozone's annual consumer price inflation in March fell to 1.4% against the February value of 1.5%. The target level of the European Central Bank is slightly below 2.0%. In March compared with February of this year, prices rose by 1.0% and also coincided with forecasts. As for the technical picture of the EURUSD pair, growth was limited by the resistance around 1.1320, which now creates the main problems for buyers of risky assets. The bears will strive to return the trading instrument to the area of the lower border of the side channel 1.1280, from where you can again expect to resume demand. The British pound ignored the data presented on Wednesday from the National Bureau of Inflation Statistics. According to the report, the UK's annual CPI in March rose by 1.9%, as in February, indicating signs of stability. In March, compared with February, inflation rose by 0.2%. Today, a report was also submitted from the National Bureau of Statistics of the United Kingdom on housing prices, which rose by only 0.6% in February compared to the same period of the previous year. In January, growth was recorded immediately by 1.7%. Most of all, housing prices fell in London, where the decline was about 3.8% compared to the same period last year. It is worth noting that the decline in prices in London has been observed for 12 months in a row. |
| Posted: 17 Apr 2019 08:01 AM PDT To open long positions on GBP/USD, you need: Inflation data fully coincided with the forecasts of economists, which led to a slight decline in the pound in the morning. Consider long positions in GBP/USD is best after the return and consolidation above the resistance of 1.3064, which will update the upper limit of the wide side channel in the area of 1.3094 and the maximum test of 1.3118, where I recommend fixing the profit. In a scenario repeated waves of weakness, count on long positions after a false breakthrough in the field of 1.3032 or on the rebound from the low of 1.3010. To open short positions on GBP/USD, you need: The bears urgently need the formation of a false breakout in the resistance area of 1.3064, which will increase the pressure on the pair and lead to another test of large support of 1.3032, from which the pound rebounded four times. Only a break in this range will increase the pressure on GBP/USD, which will open a direct road to the area of the minimum 1.3010 and 1.2989, where I recommend making a profit. In a scenario of rising above 1.3064 in the second half of the day, count on a short position is better on the rebound from the resistance 1.3094. Indicator signals: Moving Averages Trading is below 30 and 50 moving averages, which indicates the bearish nature of the market. Bollinger bands In the scenario of reducing the pair, the lower limit of the Bollinger Bands indicator in the area of 1.3032 will act as a support, a breakthrough of which will lead to a sharp decrease in the pound. Breaking the middle border in the 1.3064 area may increase the demand for GBP / USD. Description of indicators
|
| EUR/USD: plan for the American session on April 17. Bulls hit a new resistance 1.1320 Posted: 17 Apr 2019 08:01 AM PDT To open long positions on EURUSD. you need: The data on inflation in the eurozone did not greatly impress traders, which did not allow euro buyers to break above the weekly maximum in the area of 1.1320. At the moment, the main goal is the formation of a false breakout in the support area of 1.1301, with a return and a repeated test of the maximum of 1.133, the breakthrough of which will continue the upward trend to the levels of 1.1336 and 1.1358, where I recommend taking profit. If EUR/USD falls in the afternoon under the support area of 1.1301, it is best to return to long positions to rebound from the lower border of the channel of 1.1280. To open short positions on EURUSD, you need: The bears did not let the pair above the resistance of 1.1315, which I paid attention to in the morning forecast, forming a new area of 1.133. While trading is below this level, the pressure on EUR/USD will remain, and the breakthrough of the middle of the channel 1.1301 will involve new sellers in the market, which will lead to an update of the lower border of the side channel in the area of 1.1280, where I recommend fixing the profit. In the scenario of growth above the level of 1.1333 in the second half of the day, it is best to return to short positions after the update of the highs of 1.1336 and 1.1358. Indicator signals: Moving Averages Trading is conducted in the region of 30 and 50 medium moving, which indicates the lateral nature of the market with a slight bullish advantage. Bollinger bands In the event of a decline in the euro in the afternoon, support will be provided by the average Bollinger Bands indicator around 1.1293, against which it will lead to a larger wave of euro decline. Description of indicators
|
| Bitcoin is about to drop - Analysis for April 17,2019 Posted: 17 Apr 2019 07:30 AM PDT Fundamental news: An official from the Romanian central bank has stated that cryptocurrency will not replace currency issued by central banks as it is not necessarily a currency. The news was published by local media outlet Business Review on April 16. This confirms that there is a lot of mixed opinions about the how the cryptos may develop and the price action confirms that indecision is present for months. Technical picture:
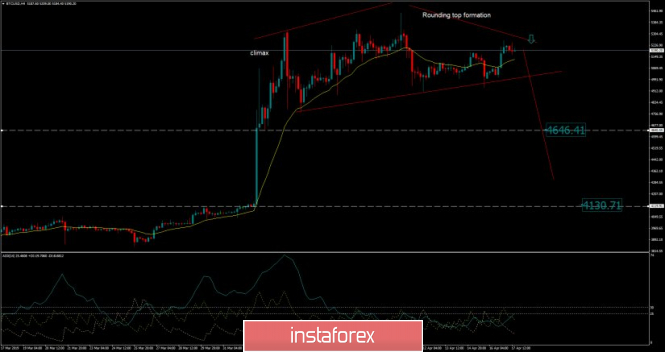
According to the H4 time-frame, we found that there is rounding top formation in creation, which is sign that BTC is under the distribution process. Probably some bigger traders are looking to sell larger amount so the distribution is underway. Support at the price of $4.900 is very important for swing traders since the breakout of this level may confirm downward movement. Key resistance is seen at the price of $5.445.
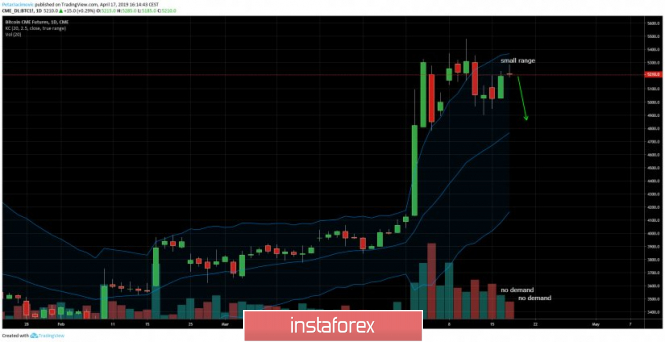
On the Futures market we found that after the strong push higher in the background and climatic action, there is the decreasing in the volume on the upside, which is sign that there is no big interest on the upside so selling may be a good option going further. Pay attention on the supports at $4.646 and $4.130, since these levels may be a very good levels to scale out our potential sell positions. The material has been provided by InstaForex Company - www.instaforex.com |
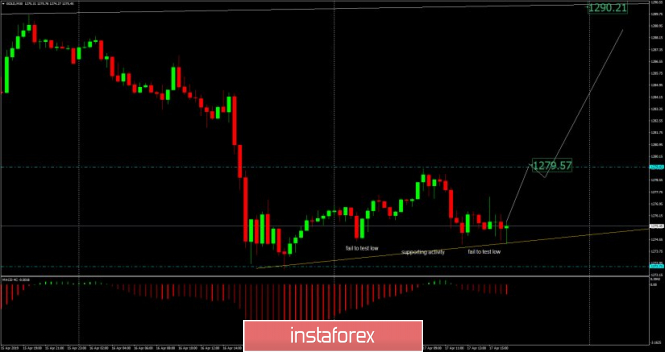
| Gold analysis for April 17, 2019 Posted: 17 Apr 2019 07:01 AM PDT Gold has been trading downwards. As we expected, the price tested the level of $1.272.70. We are expecting bullish correction since the past few days we saw the bearish trend days.
According to the M30 time-frame, we found that sellers got hard time to even test the yesterday's low at $1.272.70, which is sign that there is not big interest to sell further Gold. We found supporting activity today and stabilization in the price action (Gold found the balance), which is indication for the potential upward correction. Key support is set at the price of $1.272.70. Resistance levels are seen at the price of $1.279.00 and $1.290.00. Trading recommendation: We are bullish on the Gold from $1.275.00 and with targets at $1.279.60 and $1.290.20. Protective stop is placed below $1.272.00. The material has been provided by InstaForex Company - www.instaforex.com |
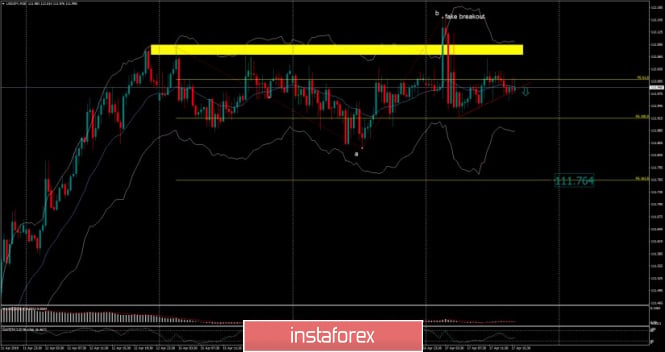
| USD/JPY analysis for April 17, 2019 Posted: 17 Apr 2019 06:31 AM PDT USD/JPY has been trading upwards. The price tested the level of 112.15 but It got rejected. We are still expecting downside on the USD/JPY
According to the M30 time-frame, we found that there is the fake breakout and strong reaction from sellers at the 2-day high at the price of 112.07, which is sign that buying looks very risky. Most recently, we found the intraday bearish flag pattern in creation, which confirms potential downward movement in the next period. Support levels are seen at the price of 111.84 and 111.76 Trading recommendation: We are short on the USD/JPY from 112.00 with target at the price of 111.76. Protective stop is placed at 112.20 The material has been provided by InstaForex Company - www.instaforex.com |
| EUR/USD: "upper classes" can not, and the "lower classes" do not want to? Posted: 17 Apr 2019 05:57 AM PDT The EUR/USD pair is still trading around the mark of 1.13. Another attempt by the "bears" to break through to the south was defeated, and the pair returned to a narrow range. A slight decrease occurred against the background of the strengthening of the American currency, and the subsequent recovery was due to the release of positive statistics from the Middle Kingdom. According to the National Bureau of Statistics of China, in the first quarter of this year, the country's GDP expanded by 6.4% year-on-year, whereas it was expected to grow by 6.3% previously. Stimulating the Chinese economy seems to produce results, and this favorably affects market sentiment. Meanwhile, things are not so rosy in the eurozone. The economy of the currency bloc is weakening, the US threatens to impose trade duties on goods supplied to America from the Old World, and the spread between 10-year German and American bonds is increasingly moving to negative territory. Last week, the President of the Bundesbank and a member of the board of the European Central Bank said that the growth rate of the eurozone's largest economy could slow down significantly in 2019. The German government for the second time in three months significantly lowered the assessment of the country's economic growth for this year. The new forecast suggests that German GDP this year will increase by only 0.5%, while in January growth was expected at 1%, and in the autumn of last year – by 1.8%. According to experts, from a fundamental point of view, it is still difficult to find reasons for maintaining the "bullish" position on the euro, and therefore there is no doubt that the bears will again try to take control of the situation. In this case, the probability of false breakdowns is high. "Yesterday, the ZEW business optimism data provided support for the EUR/USD pair, and today China statistics. However, the pair's growth is limited by pessimistic statements by the ECB. An important test is waiting for EUR/USD tomorrow – the April PMI indices of the Eurozone will be released. The weak performance can cause the pair's decline on 50-70 points" – the specialists of Danske Bank noted. The material has been provided by InstaForex Company - www.instaforex.com |
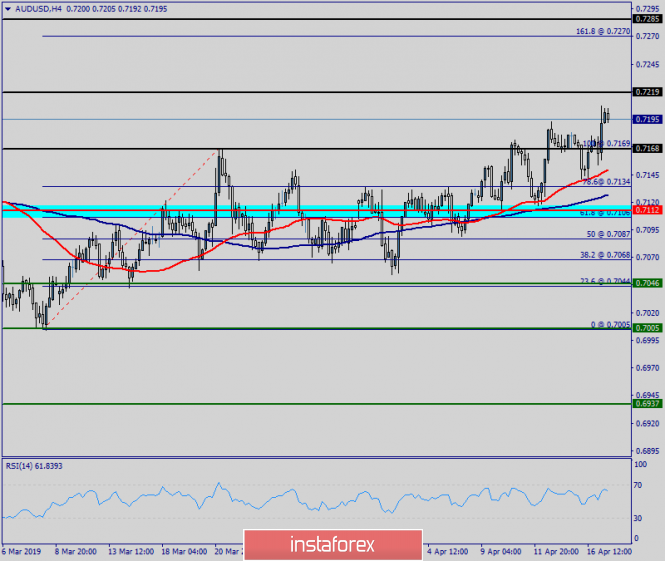
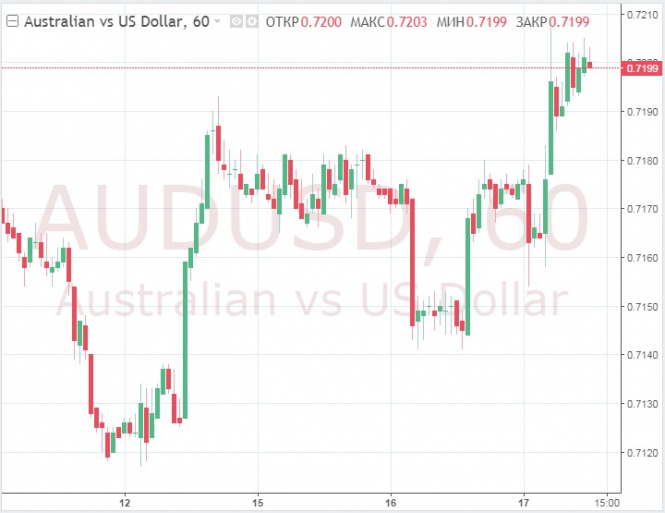
| Technical analysis of AUD/USD for April 17, 2019 Posted: 17 Apr 2019 05:53 AM PDT The AUD/USD pair is set above strong support at the levels of 0.7046 and 0.7168. This support has been rejected four times confirming the uptrend. Hence, the major support is seen at the level of 0.7046, because the trend is still showing strength above it. Accordingly, the pair is still in the uptrend in the area of 0.7046 and 0.7168. The AUD/USD pair is trading in the bullish trend from the last support line of 0.7112 towards thae first resistance level of 0.7168 in order to test it. This is confirmed by the RSI indicator signaling that we are still in the bullish trending market. Now, the pair is likely to begin an ascending movement to the point of 0.7168 and further to the level of 0.7290. The level of 0.7389 will act as the major resistance and the double top is already set at the point of 0.7389. At the same time, if there is a breakout at the support levels of 0.7112 and 0.7046, this scenario may be invalidated. Overall, however, we still prefer the bullish scenario. The material has been provided by InstaForex Company - www.instaforex.com |
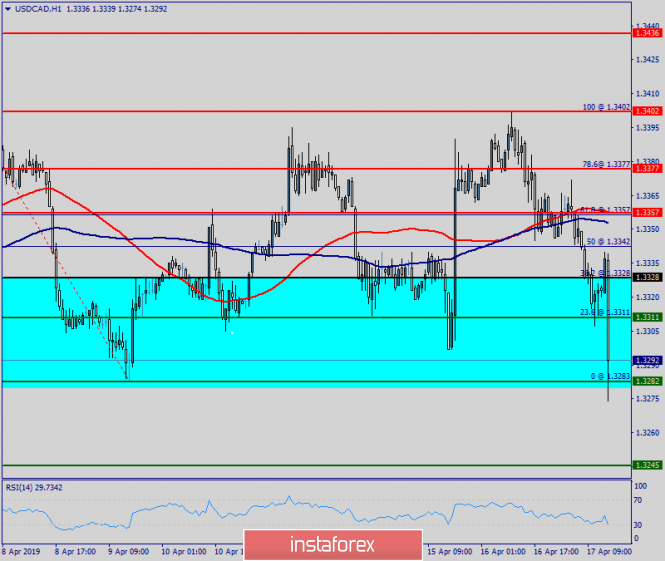
| Technical analysis of USD/CAD for April 17, 2019 Posted: 17 Apr 2019 05:50 AM PDT Overview: The USD/CAD pair continues to move upwards from the level of 1.3228. Yesterday, the pair rose from the level of 1.3228 (the level of 1.3228 coincides with a ratio of 38.2% Fibonacci retracement) to a top around 1.3357. Today, the first support level is seen at 1.3228 followed by 1.3311, while daily resistance 1 is seen at 1.3377. According to the previous events, the USD/CAD pair is still moving between the levels of 1.3228 and 1.3402; for that we expect a range of 174 pips (1.3402 - 1.3228). On the one-hour chart, immediate resistance is seen at 1.3357, which coincides with the double top. Currently, the price is moving in a bullish channel. This is confirmed by the RSI indicator signaling that we are still in a bullish trending market. The price is still above the moving average (100), Therefore, if the trend is able to break out through the first resistance level of 1.3357, we should see the pair climbing towards the daily resistance at the levels of 1.3377 and 1.3402. It would also be wise to consider where to place stop loss; this should be set below the second support of 1.3282. The material has been provided by InstaForex Company - www.instaforex.com |
| Fractal analysis of major currency pairs as of April 17 Posted: 17 Apr 2019 05:36 AM PDT Dear colleagues. For the currency pair Euro/Dollar, we expect the continuation of the upward cycle from April 2 after the breakdown of 1.1327 and the level of 1.1280 is the key support. For the currency pair Pound/Dollar, the price is in equilibrium: 1.3088 is the key resistance for the top, 1.3027 is the key resistance for the downward movement. For the currency pair Dollar/Franc, subsequent key targets were determined from the local upward structure on April 12. For the currency pair Dollar/Yen, we follow the development of the upward structure from April 10 and we expect the upward movement to continue after the breakdown of 112.17. For the currency pair Euro/Yen, we continue to monitor the upward structure of April 10; the level of 126.95 is the key resistance and the level of 126.18 is the key support. For the currency pair Pound/Yen, the price is in a deep correction from the upward structure and the level of 145.64 is the key support. Forecast for April 17: Analytical review of H1-scale currency pairs: For the currency pair Euro/Dollar, the key levels on the H1 scale are: 1.1370, 1.1352, 1.1327, 1.1291, 1.1280 and 1.1259. We continue to monitor the development of the upward structure from April 2.We expect the upward movement to continue after the breakdown of 1.1327. In this case, the target is 1.1352 and the potential value for the top is considered the level of 1.1370, after reaching which we expect consolidation in the range of 1.1370 – 1.1352, as well as a possible rollback to the correction. The short-term downward movement is possible in the area of 1.1291 – 1.1280 and the breakdown of the latter value will lead to a prolonged correction. The goal is 1.1259 and this level is the key support for the top. The main trend is the ascending structure of April 2. Trading recommendations: Buy 1.1328 Take profit: 1.1350 Buy 1.1354 Take profit: 1.1370 Sell: 1.1290 Take profit: 1.1280 Sell: 1.1278 Take profit: 1.1262 For the currency pair Pound/Dollar, the key levels on the H1 scale are: 1.3189, 1.3123, 1.3088, 1.3027, 1.2984, 1.2959, 1.2924 and 1.2876. The price entered the equilibrium state. The continuation of the downward movement is possible after the breakdown of 1.3027. In this case, the first target is 1.2984. The short-term downward movement is expected in the area of 1.2984 – 1.2959 and the breakdown of the latter value will lead to the movement to the level of 1.2924, near this value we expect consolidation. The potential value for the bottom is the level of 1.2876, from which we expect a correction. The short-term upward movement is possible in the area of 1.3088 – 1.3123 and the breakdown of the latter value will have to develop an upward trend. The first potential target is 1.3189. The main trend is the equilibrium situation. Trading recommendations: Buy: 1.3090 Take profit: 1.3120 Buy: 1.3124 Take profit: 1.3187 Sell: 1.3025 Take profit: 1.2987 Sell: 1.2984 Take profit: 1.2960 For the currency pair Dollar / Franc, the key levels on the H1 scale are: 1.0125, 1.0114, 1.0096, 1.0082, 1.0064, 1.0055 and 1.0041. We determined the subsequent goals for the top from the local structure on April 12. The short-term upward movement is possible in the area of 1.0082 – 1.0096 and the breakdown of the latter value should be accompanied by a pronounced upward movement. The target is 1.0114. The potential value for the top is considered the level of 1.0125, after reaching which we expect consolidation, as well as a rollback to the top. The short-term downward movement is possible in the area of 1.0064 – 1.0055 and the breakdown of the latter value will lead to a prolonged correction. The target is 1.0041 and this level is the key support for the top. The main trend – local upward structure from April 12. Trading recommendations: Buy: 1.0082 Take profit: 1.0094 Buy: 1.0098 Take profit: 1.0114 Sell: 1.0064 Take profit: 1.0055 Sell: 1.0053 Take profit: 1.0041 For the currency pair Dollar/Yen, the key levels on the scale of H1 are: 113.06, 112.88, 112.57, 112.34, 112.17, 111.87, 111.74 and 111.48. We follow the development of the ascending structure from April 10. The short-term upward movement is expected in the area of 112.17 – 112.34 and the breakdown of the latter value will lead to the movement to the level of 112.57, near which we expect consolidation. The breakdown of 112.60 should be accompanied by a pronounced upward movement. The goal is 112.88. The potential value for the top is the level of 113.06, upon reaching which we expect consolidation, as well as a rollback to the correction. The short-term downward movement is possible in the area of 111.87 – 111.74 and the breakdown of the latter value will lead to a prolonged correction. The target is 111.50 and this level is the key support for the upward structure. The main trend is the rising structure of April 10. Trading recommendations: Buy: 112.17 Take profit: 112.32 Buy: 112.36 Take profit: 112.55 Sell: 111.87 Take profit: 111.75 Sell: 111.72 Take profit: 111.55 For the currency pair Canadian Dollar/Dollar, the key levels on the H1 scale are: 1.3509, 1.3479, 1.3438, 1.3421, 1.3401, 1.3374, 1.3322, 1.3306 and 1.3283. The price is still close to the cancellation of the upward structure from April 9, which requires a breakdown of the level 1.3306. In this case, the first potential target is 1.3283. We expect a resumption of the upward movement after the breakdown of 1.3374. The first target is 1.3401 and the breakdown of which will allow us to count on the movement towards the level – 1.3421, near this level is the price consolidation. The passage of the price of the range of 1.3421 – 1.3438 should be accompanied by a pronounced upward movement. The goal is 1.3479, near this level consolidation. The potential value for the top believes the level of 1.3509 at which the expected roll back down. The main trend is the formation of the upward potential of April 9, the stage of deep correction. Trading recommendations: Buy: 1.3374 Take profit: 1.340 Buy: 1.3403 Take profit: 1.3420 Sell: 1.3322 Take profit: 1.3306 Sell: 1.3303 Take profit: 1.3285 For the currency pair Australian Dollar/Dollar, the key levels on the H1 scale are: 0.7268, 0.7250, 0.7220, 0.7209, 0.7186, 0.7173, 0.7157 and 0.7137. We follow the development of the ascending structure from April 11. We expect the upward movement to continue after the price passes the range of 0.7209 – 0.7220. In this case, the target is 0.7250. The potential value for the top is the level of 0.7268, upon reaching this value, we expect consolidation, as well as a rollback to the bottom. The short-term downward movement is possible in the range of 0.7186 - 0.7173 and the breakdown of the latter value will lead to an in-depth correction. The goal is 0.7157 and this level is the key support for the top Its price passage will have to form the initial conditions for the downward cycle. In this case, the goal is 0.7137 . The main trend is the local structure for the top of April 11. Trading recommendations: Buy: 0.7220 Take profit: 0.7250 Buy: 0.7252 Take profit: 0.7266 Sell: 0.7186 Take profit: 0.7173 Sell: 0.7170 Take profit: 0.7158 For the currency pair Euro/Yen, the key levels on the H1 scale are: 127.58, 127.16, 126.95, 126.77, 126.38, 126.18 and 125.89. We follow the development of the ascending structure from April 10. The short-term upward movement is expected in the area of 126.77 - 126.95, the breakdown of the latter value will lead to the movement to the level of 127.16, near which we expect consolidation. The potential value for the top is considered to be the level of 127.58, the movement to which is expected after the breakdown of 127.18. The short-term downward movement is possible in the area of 126.38 – 126.18 and the breakdown of the latter value will lead to a prolonged correction. In this case, the target is 125.90 and this level is a key support for the top. The main trend is the rising structure of April 10. Trading recommendations: Buy: 126.77 Take profit: 126.95 Buy: 126.97 Take profit: 127.16 Sell: 126.38 Take profit: 126.20 Sell: 126.14 Take profit: 125.90 For the currency pair Pound/Yen, the key levels on the H1 scale are: 147.80, 147.54, 147.13, 146.81, 146.54, 145.94, 145.64 and 145.23. The price is in the correction area from the upward structure on April 9 and the resumption of the upward movement is expected after the breakdown of 146.54. In this case, the first goal is 146.81. The breakdown of 146.81 will allow us to count on the movement to 147.13, near this level, the price consolidation. Breakout of the level of 147.13 must be accompanied by a strong upward movement, the potential target here – 147.80, reaching this level of consolidation is expected in the area of 147.54 – 147.80, as well as a pullback in a correction of the downward structure of April 14, here the first potential target is 145.23. The main trend is the ascending structure of April 9, the stage of deep correction. Trading recommendations: Buy: 146.54 Take profit: 146.80 Buy: 146.83 Take profit: 147.10 Sell: 145.94 Take profit: 145.66 Sell: 145.62 Take profit: 145.28 The material has been provided by InstaForex Company - www.instaforex.com |
| Analysis of EUR/USD divergence for April 17. Divergences continue to support the euro Posted: 17 Apr 2019 05:36 AM PDT 4h As seen on the 4-hour chart, the EUR/USD pair performed a rebound from the retracement level of 61.8% (1.1281) with the formation of a bullish divergence in the CCI indicator. As a result, the pair made a turn in favor of the European currency and began the process of growth in the direction of the Fibo level of 50.0% (1.1313). Closing the pair above the 50.0% level will work in favor of continuing growth of quotations in the direction of the next retracement level of 38.2% (1.1344). The rebound of the pair from the Fibo level of 50.0% will allow traders to expect a return to the retracement level of 61.8%. The Fibo grid was built on extremums from March 7, 2019, and March 20, 2019. Daily As seen in the 24-hour chart, the pair closed above the retracement level of 127.2% - 1.1285. However, the emerging divergence of the CCI indicator has not been canceled and still allows traders to expect a reversal in favor of the US currency and a resumption of decline in the direction of the Fibo level of 161.8% (1.0941). Closing the EUR/USD pair below the level of 127.2% will similarly increase the probability of the quotes falling. The Fibo grid was built on extremes from November 7, 2017, and February 16, 2018. Forecast for EUR/USD and trading recommendations: Buy deals on EUR/USD pair can be opened with targets at 1.1313 and 1.1344 as the pair completed the rebound from the retracement level of 61.8%. The stop loss order should be placed below the level of 1.1281. Sell deals on EUR/USD pair can be opened with the targets at 1.1281 and 1.1241 if the pair rebounds from the level of 50.0%. The stop loss order should be placed above the level of 1.1313. The material has been provided by InstaForex Company - www.instaforex.com |
| Posted: 17 Apr 2019 05:36 AM PDT 4h As seen on the 4-hour chart, the GBP/USD pair performed a reversal in favor of the American currency with some delay after the formation of a bearish divergence in the CCI indicator. As a result, on April 17, the process of falling in the direction of the retracement level of 61.8% (1.2969) began and continues. Today, the emerging divergence is not observed in any indicator. Rebounding the quotations of the pair from the Fibo level of 61.8% will make it possible to expect a reversal in favor of the British currency and some growth towards the retracement level of 76.4% (1.3094). The Fibo grid is built on extremums from September 20, 2018, and January 3, 2019. 1h As seen on the hourly chart, the GBP/USD pair fell to the retracement level of 23.6% (1.3045) and, after the formation of the bullish divergence of the CCI indicator, reversed in favor of the British currency and started the process of growth towards the retracement level of 38.2% (1.3088). The end of the quotations from the Fibo level of 38.2% will make it possible to expect a reversal in favor of the US dollar and a resumption of decline in the direction of the retracement level of 23.6%. The Fibo grid is built on extremes from March 27, 2019, and March 29, 2019. Forecast for GBP/USD and recommendations for traders: Buy deals on GBP/USD pair can be opened with a target at 1.3088 and a stop loss order under the retracement level of 23.6% since the pair has rebounded from the level of 1.3045 with the formation of bullish divergence (hourly chart). Sell deals on GBP/USD pair will be possible with the target at 1.2976 and a stop loss order above the level of 23.6% if the pair closes below the level of 1.3045 (hourly chart). The material has been provided by InstaForex Company - www.instaforex.com |
| Posted: 17 Apr 2019 05:36 AM PDT 4-hour timeframe Technical details: The upper linear regression channel: direction - up. The lower linear regression channel: direction - down. The moving average (20; smoothed) - down. CCI: -83.4516 The GBP/USD currency pair is trying to break out of the side channel, but the lower limit of this channel, limited by the Murray level of "3/8" - 1.3031, was not overcome yesterday. Thus, despite the downward tangible break of the pair, it remains in the flat with low volatility. The strong support level for the pair is now two – 1.3031 and 1.3000. If you look closely at the illustration, it is clear that the pair have been working on them 5 times lately. Thus, until these levels are overcome, the fall in the GBP/USD pair will be limited. In the UK, a report on inflation will also be published today. In accordance with the forecasts of experts, it is expected to accelerate in annual terms from 1.9% to 2.0%. This is positive news for the pound, but will it be taken into account by investors? Recently, the pound is frankly in one place, not very much reacting to the news. It seems that traders are very disappointed with the final decision on Brexit and do not know how to trade the pound sterling in the future. However, in any case, the market will sooner or later move from the dead point. This can be caused by large transactions in the foreign exchange market from large players not for profit. Such an event can provoke the formation of a new trend. Nearest support levels: S1 - 1.3031 S2 - 1.3000 S3 - 1.2970 Nearest resistance levels: R1 - 1.3062 R2 - 1.3092 R3 - 1.3123 Trading recommendations: The pair GBP/USD has fixed below the MA, however, its potential fall is limited by the levels of 1.3031 and 1.3000, the first of which has already been worked out and has not been overcome. Thus, a further decline is questionable, unless the report on inflation in the UK is frankly a failure. Buy-positions will formally become relevant after the pair is fixed above the moving average line with a short target of 1.3123 – this is the upper limit of the side channel. In addition to the technical picture should also take into account the fundamental data and the time of their release. Explanations for illustrations: The upper linear regression channel – blue line the unidirectional movement. The lower channel of the linear – purple line unidirectional movement. CCI is the blue line in the indicator regression window. The moving average (20; smoothed) is the blue line on the price chart. Murray levels - multi-colored horizontal stripes. Heiken Ashi is an indicator that colors bars in blue or purple. The material has been provided by InstaForex Company - www.instaforex.com |
| EUR/USD. April 17th. The trading system "Regression Channels" Posted: 17 Apr 2019 05:36 AM PDT 4-hour timeframe Technical details: The upper linear regression channel: direction - down. The lower linear regression channel: direction - down. Moving average (20; smoothed) - up. CCI: 80.3736 On Wednesday, April 17, the currency pair EUR/USD adjusted to the moving average line and rebounded from it, resuming the upward trend. Purple bars indicator Heiken Ashi signals about the upward movement and within the day. Thus, the pair managed to maintain an upward mood, despite the fact that the euro still does not have fundamental support. Today, the European Union will publish an inflation report for March. The consumer price index is expected to be 1.4% annually and 1.0% monthly. However, given the not the best state of the EU economy and a very likely trade war with the States, there is a reason to assume that the forecast value is unlikely to be exceeded. Thus, the euro is unlikely to receive fundamental support today. On the other hand, given the growth of the euro in recent days, it seems that the pair does not really need news support. Thus, moderate growth may continue. We also note that the Forex market is not very volatile right now, and this is especially true for the EUR/USD pair. Thus, the potential profit on purchase transactions will not be large. Thus, our forecast is to maintain the upward trend, traders are advised to follow the trend, but be prepared for the fact that it can change to a downward, as it is very unstable. Nearest support levels: S1 - 1.1292 S2 - 1.1261 S3 - 1.1230 Nearest resistance levels: R1 - 1.1322 R2 - 1.1353 R3 - 1.1383 Trading recommendations: The EUR/USD currency pair has completed another round of correction. Thus, it is now recommended to consider long positions with targets at 1.1322 and 1.1353. The publication of the report on inflation in the EU could trigger a new round of downward correction. It is recommended to open a sell position no earlier than fixing a pair below the moving with targets at 1.1261 and 1.1230. But the potential downward movement will still be limited to the level of 1.1200. In addition to the technical picture should also take into account the fundamental data and the time of their release. Explanations for illustrations: The upper linear regression channel – blue line unidirectional movement. The lower linear regression channel – purple line unidirectional movement. CCI - blue line in the indicator window. The moving average (20; smoothed) is the blue line on the price chart. Murray levels - multi-colored horizontal stripes. Heiken Ashi is an indicator that colors bars in blue or purple. The material has been provided by InstaForex Company - www.instaforex.com |
| Posted: 17 Apr 2019 05:01 AM PDT Reduced geopolitical tensions and a rise in global risk appetite contributed to a fall in gold prices by 5% from February highs levels. Stocks of the largest specialized fund, SPDR Gold Shares, were reduced to 752 tons, which is the minimum mark in six months. The precious metal was in disgrace against the background of the continuous growth of world stock indices and increases the yield of US Treasury bonds and the remarkable stability of the US dollar. Contrary to the intentions of the Fed to make a long pause in the process of normalizing monetary policy and a portion of disappointing macroeconomic statistics, the USD index is not eager to go for a correction. Events such as the prolongation of the transition period in the framework of Brexit until October 31, the good news from the US and China negotiations and strong data on China's GDP, retail sales and industrial production only fueled a global appetite for risk. In an environment where stocks are rising and volatility on Forex falls to its lowest level since 2015, safe haven assets fall into a wave of sales. Suffice to recall how the Japanese yen and the Swiss franc feel were ignored. Optimism from the eurozone and China allows investors to hand off treasury bonds which leads to a rebound in the yield of 10-year securities from the area of 16-month bottom. Unpleasant news for gold, which does not pay interest and in turn was not able to compete with debt obligations during the period of growth of interest rates on them. Dynamics of gold and yield of US Treasury bonds Not less than troubles are XAU / USD "bulls" who delivers the stability of the US dollar instead of falling against the background of the "dovish" rhetoric of the Fed and weak statistics on industrial production. The US currency stabilizes at current levels, adopting an increased probability of maintaining the federal funds rate at 2.5% in 2019 from 40% to 60%. The Chicago Fed Chairman Charles Evans believes that the Fed will tighten monetary policy in 2020 and 2021 and Deutsche Bank does not expect a recession over the next three years. If the US economy is still strong, what's the point of buying bonds? They get rid of them which leads to an increase in profitability and promotes sales of precious metals. What's next? In my opinion, the US dollar will be affected if China and the eurozone take the path of a V-shaped recovery, and trade wars stop. Euro and other world currencies will be able to go on the attack, which will lead to a correction in the USD index and return the bulls in XAU/USD to the game. I do not think that the rates of the global debt market will go far up. This requires a change in the worldview of central banks and to turn from "hawkish" to "dovish", and then from "dovish" to "hawkish" within six months is not so easy. Technically, the target of 161.8% for the subsidiary and maternal AB = CD patterns makes it possible to reveal a convergence zone of $1254-1262 per ounce, which is near where the gold is capable of finding the bottom. If the bulls manage to return quotes to the middle of the consolidation range of $1282-1310, the risks of restoring the uptrend will increase. Gold daily chart |
| China's economy is surprising but it's too early to talk about recovery Posted: 17 Apr 2019 04:44 AM PDT Headline for the World Markets and currencies is about the Chinese economy which becomes more accurate as it was unexpectedly successful in the first quarter Growth in a specific period amounted to 6.4 percent, despite the fact that a slowdown was expected. Industrial production jumped sharply, and consumer demand shows signs of improvement. However, it is too early to call what is happening as a sustainable trend. Many still expect "full recovery" only in the second half of 2019. More positive data is needed to talk about a full recovery. In addition, stronger than expected data is related to some extent to the large-scale stimulus. Stock markets and most currencies rose after data was published. Quarterly growth was supported by a sharp jump in industrial production, which grew by 8.5 percent year-on-year in March. There is every reason to believe that growth will remain stable here. Some experts explain the current growth in exports by seasonal factors but most likely it will continue in the second quarter. In spite of this, according to the poll by Reuters, analysts expect that China's growth this year will still slow to a nearly 30-year low of 6.2 percent, as weak demand at home and abroad. Also, the trade war continues to put pressure despite government support measures. |
| Wave analysis for GBP / USD pair on April 17. Britons tend to fall below the 30th figure Posted: 17 Apr 2019 04:35 AM PDT Wave counting analysis: On April 16, the GBP/USD pair lost about 50 bp. Thus, a confident and unambiguous breakthrough of the upper line of the narrowing triangle did not happen and the tool rushed to the lower line to the level of 0.0% Fibonacci. Considering the fact that in every succeeding peak within the triangle turned out to be lower than the previous one, I predict a successful attempt to break through the level of 0.0% for the pair with a further decrease in the instrument as part of building a downward trend segment. Uncertainty on Brexit negatively affected wave counting and market behavior but little by little the market will return to the usual trading and activity. Today, it has already become known that inflation in the UK in March was worse than expected at 1.9%, although it did not slow down. It turns out that the news background supports the option with a decrease to 1.2961 in the pair. Purchase targets: 1.3350 - 100.0% Fibonacci 1.3454 - 127.2% Fibonacci Sales targets: 1.2961 - 0.0% Fibonacci General conclusions and trading recommendations: The wave pattern still involves the formation of a downward trend and the markets still cannot withdraw the pair from the triangle. Hence, the trades are held with a small amplitude. Accordingly, I recommend expecting the pair to exit from the triangle to determine the market sentiment in the near future. Currently, I expect the fall of the sterling pound to the level of 1.2961. The material has been provided by InstaForex Company - www.instaforex.com |
| Wave analysis for EUR / USD pair on April 17. Euro continues to win back against the dollar Posted: 17 Apr 2019 04:23 AM PDT Wave counting analysis: On Tuesday, April 16, trading for EUR/USD pair ended with a decline of 20 bp. However, the tool resumed today. It is fully consistent with the current wave marking, which implies the construction of an upward wave c. The euro reached the Fibonacci level of 50.0% once again, and another unsuccessful attempt to break through this mark will lead to a new departure of quotations from the reached maximums. In general, the current wave counting involves the continuation of the construction of the ascending wave. The growth of the euro began today evening but the news background in the form of inflation in the European Union has nothing to do with it since this news came out just an hour ago. On this basis, the ultimate minimal target of a wave will be 1.1450 which looks more and more real. Sales targets: 1.1177 - 100.0% Fibonacci Purchase targets: 1.1448 - 100.0% Fibonacci 1.1476 - 76.4% on the highest Fibonacci grid General conclusions and trading recommendations: The pair presumably continues to build a wave. Thus, the trading strategy remains the same. I recommend buying the pair with targets located near the estimated levels of 1.1448 and 1.1476, which corresponds to 100.0% and 76.4% Fibonacci. Increase purchases should be done carefully and slowly. The news background for the pair is still neutral and does not hinder the development of an upward wave. The material has been provided by InstaForex Company - www.instaforex.com |
| How do data from China affect different dollars differently? Posted: 17 Apr 2019 03:30 AM PDT
The Australian dollar is rising on news from China. The currency has updated a two-month high after the PRC's economic growth rates have surpassed forecasts. Now investors have good reasons to believe that the worst is over for the world economy. The Australian's jump pleased traders who had recently searched for the right direction after a lull in the foreign exchange markets, while the euro and the dollar practically did not move, and the volatility remained suppressed. True, the Australian currency is pursued by the "pigeon" mood of the Reserve Bank of Australia, but even this did not prevent it from rising above $ 0.72 for the first time since February 21. The Chinese economy grew 6.4 percent in the first quarter. The Australian dollar is very sensitive to the economic situation of China, Australia's largest trading partner. Hereby confirming that it is actually important for the Australian dollar, and that for China. The currency rose, despite the fact that the recent comment of the RBA on rates has caused negative sentiment.
Another dollar - the American - met Chinese economic success with a decline. The "American", who often acts as a safe haven, weakened against the euro after the publication of data from China, which eased concerns about a slowdown in the global economy. The dollar index versus a basket of six major currencies also declined. The euro rose 0.4 percent to $ 1.1300. The single currency came under pressure after just four sources reported that some officials at the ECB considered the economic forecasts of the regulator too optimistic, since China's economic weakness and trade tensions persist.
|


| You are subscribed to email updates from Forex analysis review. To stop receiving these emails, you may unsubscribe now. | Email delivery powered by Google |
| Google, 1600 Amphitheatre Parkway, Mountain View, CA 94043, United States | |
No comments:
Post a Comment