
Forex analysis review |
- April 19, 2019 : GBP/USD Intraday technical analysis and trade recommendations.
- Bitcoin is about to drop - Analysis for April 19,2019
- April 19, 2019 : EUR/USD Intraday technical analysis and trade recommendations.
- USD/CAD analysis for April 19, 2019
- Analysis of Gold for April 19, 2019
- Technical analysis of AUD/USD for April 19, 2019
- Technical analysis of USD/CAD for April 19, 2019
- Technical analysis for EURUSD for April 19, 2019
- Technical analysis for Gold for April 19, 2019
- Elliott Wave analysis of ETH/USD for 19/04/2019
- Elliott Wave analysis of BTC/USD for 19/04/2019
- Technical analysis of GBP/USD for 19/04/2019
- Technical analysis of EUR/USD for 19/04/2019
- Trading plan for EUR/USD for April 19, 2019
- BITCOIN pullback below $5,250 to indicate counter-move? April 19, 2019
- Fundamental Analysis of EUR/GBP for April 19, 2019
- Fundamental Analysis of GBP/JPY for April 19, 2019
- Fundamental Analysis of AUD/JPY for April 19, 2019
| April 19, 2019 : GBP/USD Intraday technical analysis and trade recommendations. Posted: 19 Apr 2019 07:31 AM PDT
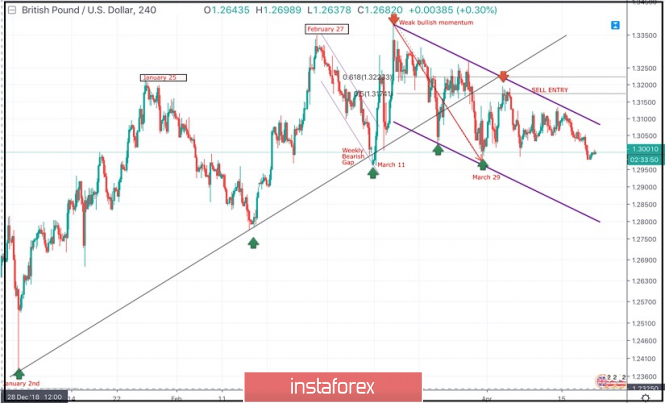
On January 2nd, the market initiated the depicted uptrend line around 1.2380. A weekly bearish gap pushed the pair below the uptrend line (almost reaching 1.2960) before the bullish breakout above short-term bearish channel was achieved on March 11. Shortly after, the GBPUSD pair demonstrated weak bullish momentum towards 1.3200 then 1.3360 where the GBPUSD failed to achieve a higher high above the previous top achieved on February 27. Instead, the depicted recent bearish channel was established. Significant bearish pressure was demonstrated towards 1.3150 - 1.3120 where the depicted uptrend line failed to provide any bullish support leading to obvious bearish breakdown. On March 29, the price levels of 1.2980 (the lower limit of the depicted movement channel) demonstrated significant bullish rejection. This brought the GBPUSD pair again towards the price zone of (1.3160-1.3180) where the upper limit of the depicted bearish channel as well as the backside of the depicted uptrend line came to meet the pair. Bearish rejection was anticipated around the mentioned price levels (1.3150-1.3180). However, the GBPUSD bullish pullback failed to pursue towards the mentioned zone. Instead, significant bearish rejection was demonstrated earlier around the price level of 1.3120. Hence, Short-term outlook has turned into bearish towards 1.2920-1.2900 where the lower limit of the depicted channel is located. Trade Recommendations: Any bullish pullback towards 1.3120-1.3140 should be considered for another SELL entry. TP levels to be located around 1.3100, 1.3020 then 1.2950 - 1.2920. S/L to be located above 1.3170. The material has been provided by InstaForex Company - www.instaforex.com |
| Bitcoin is about to drop - Analysis for April 19,2019 Posted: 19 Apr 2019 07:27 AM PDT India's central bank, the Reserve Bank of India (RBI), has unveiled its framework for a fintech regulatory sandbox. While blockchain and smart contracts are welcomed, the bank stated that cryptocurrency and related services "may not be accepted for testing.". Price action still confirms indecision. Technical picture:
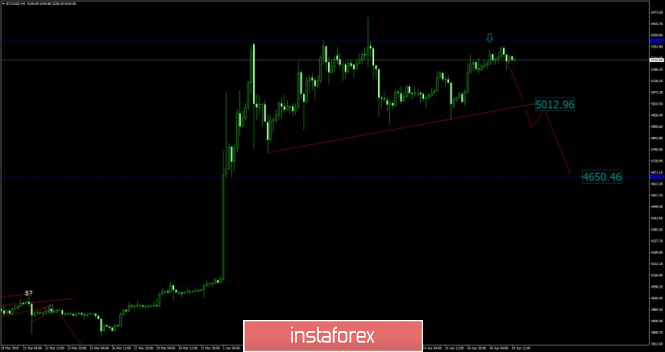
According to the H4 time-frame nothing changed since our yesterday's analysis. We found that there is rounding top formation in creation, which is sign that BTC is under the distribution process. Probably some bigger traders are looking to sell larger amount so the distribution is underway. Support at the price of $4.900 is very important for swing traders since the breakout of this level may confirm downward movement. Key resistance is seen at the price of $5.445. Keep in mind that period of low volatility is expected on Friday and Monday due to holidays.
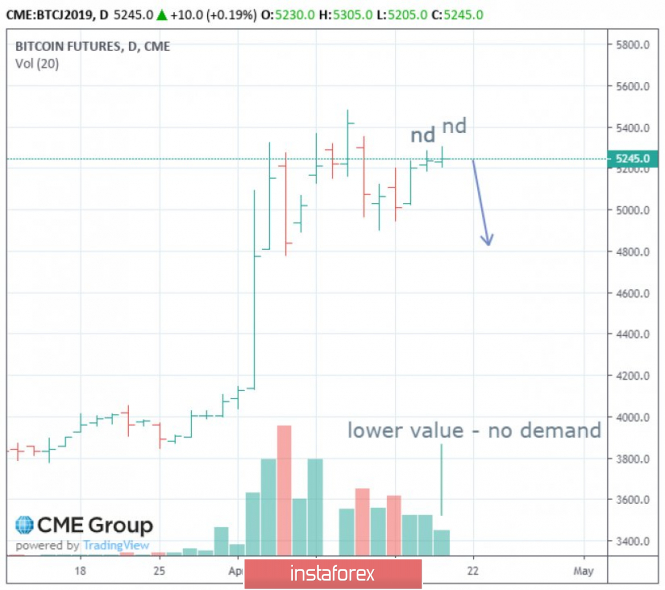
On the Futures market we found that after the strong push higher in the background and climatic action, there is the decreasing in the volume on the upside, which is sign that there is no big interest on the upside so selling may be a good option going further. Pay attention on the supports at $4.646 and $4.130, since these levels may be a very good levels to scale out our potential sell positions. The material has been provided by InstaForex Company - www.instaforex.com |
| April 19, 2019 : EUR/USD Intraday technical analysis and trade recommendations. Posted: 19 Apr 2019 07:20 AM PDT
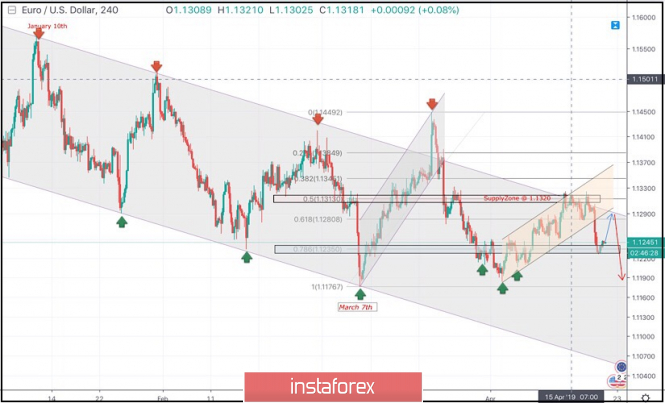
On January 10th, the market initiated the depicted bearish channel around 1.1570. Since then, the EURUSD pair has been moving within the depicted channel with slight bearish tendency. On March 7th, recent bearish movement was demonstrated towards 1.1175 (channel's lower limit) where significant bullish recovery was demonstrated. On March 18, a significant bullish attempt was executed above 1.1380 (the upper limit of the Highlighted-channel) demonstrating a false/temporary bullish breakout. On March 22, significant bearish pressure was demonstrated towards 1.1280 then 1.1220. Two weeks ago, a bullish Head and Shoulders reversal pattern was demonstrated around 1.1200. This enhanced further bullish advancement towards 1.1300-1.1315 (supply zone) where recent bearish rejection was being demonstrated. Short-term outlook turned to become bearish towards 1.1280 (61.8% Fibonacci) followed by further bearish decline towards 1.1235 (78.6% Fibonacci). For Intraday traders, the current price zone around 1.1235 (78.6% Fibonacci) stands as a prominent demand area to be watched for a possible short-term BUY entry. However, conservative traders should be waiting for a bullish pullback towards 1.1280-1.1290 (backside of the broken bullish channel) for a valid SELL entry. Moreover, bearish breakdown below 1.1235 opens the way for further bearish decline towards 1.1180-1.1170. Trade recommendations : A valid SELL entry can be taken around 1.1280 - 1.1290 when a bullish pullback occurs. TP levels to be located around 1.1250, 1.1235 and 1.1170. SL should be placed above 1.1320. The material has been provided by InstaForex Company - www.instaforex.com |
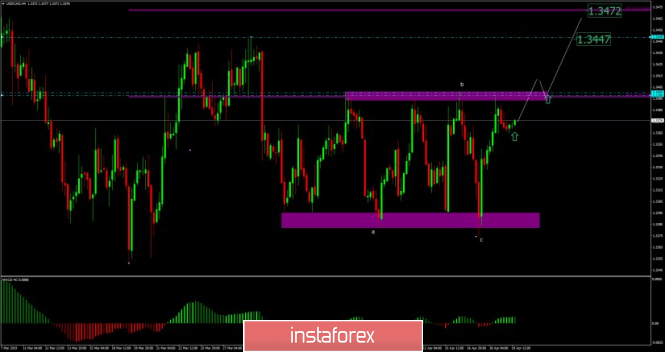
| USD/CAD analysis for April 19, 2019 Posted: 19 Apr 2019 07:15 AM PDT USD/CAD has been trading upwards in past few sessions. The price tested the level of 1.3400. We are expecting more upside on this currency pair.
According to the H4 time-frame, we found defined trading range between the price of 1.3400 (resistance) and 1.3285 (support). There is potential end of the downward correction (abc), which is sign that buying is on the way. Watch for potential breakout of the resistance (1.3400) to confirm further bullish continuation. The upward targets are seen at the price of 1.3447 and at the price of 1.3472. The material has been provided by InstaForex Company - www.instaforex.com |
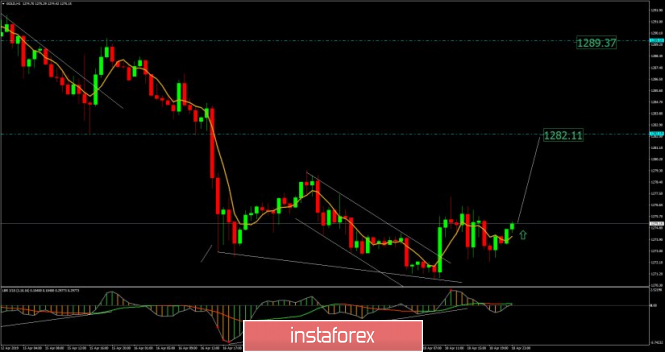
| Analysis of Gold for April 19, 2019 Posted: 19 Apr 2019 06:55 AM PDT Gold has been trading upwards in past 10 hours. The price tested the level of $1.276.50. We expect potential upward movement in our opinion selling looks extremely risky.
According to the H1 time-frame on the Gold CFD we found that there is the bullish divergence on the 3/10 oscillator, which is sign that sellers losing their power and buyers react. Key resistance levels are seen at the price of $1.282.10 and at $1.289.40. Key support level is seen at the price of $1.270.9. Situation on the futures market:
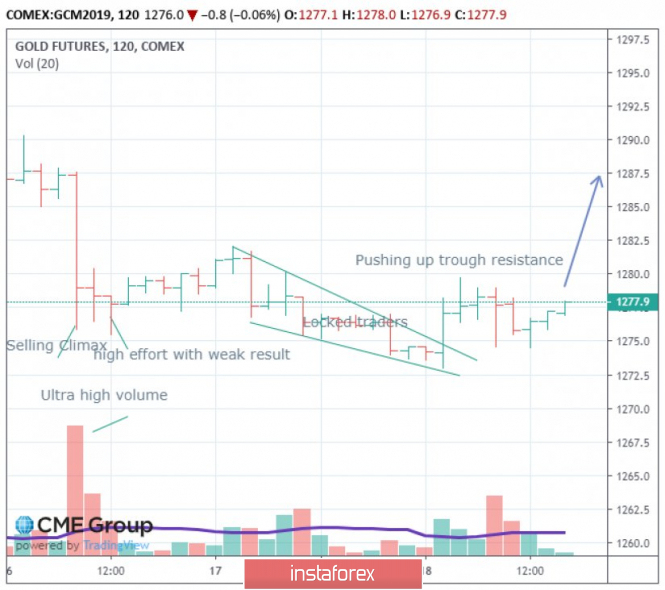
On the futures market we found massive selling climax (excessive volume and range of the bar) in the background, which is strong sign of the strength and big warning for sellers. The climatic bar on the 2H time-frame got 115k contracts traded versus average 20k, which signaled us big difference. The next few bars after the climatic bar were with the narrow range and very high volume but we got high effort with no result, which is another sign of potential strength incoming. Finally, after the decline the downward channel got broken and the buyers did start to buy and accumulate their positions in our opinion. Our advice is to watch for buying opportunities with targets at $1.282.00 and $1.290.00. The material has been provided by InstaForex Company - www.instaforex.com |
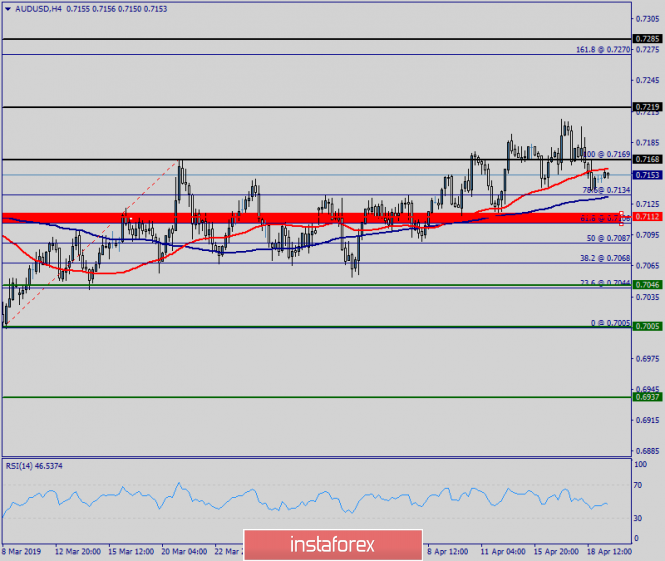
| Technical analysis of AUD/USD for April 19, 2019 Posted: 19 Apr 2019 03:25 AM PDT Overview: The AUD/USD pair is set above strong support at the levels of 0.7046 and 0.7168. This support has been rejected four times confirming the uptrend. Hence, the major support is seen at the level of 0.7046, because the trend is still showing strength above it. Accordingly, the pair is still in the uptrend in the area of 0.7046 and 0.7168. The AUD/USD pair is trading in the bullish trend from the last support line of 0.7112 towards thae first resistance level of 0.7168 in order to test it. This is confirmed by the RSI indicator signaling that we are still in the bullish trending market. Now, the pair is likely to begin an ascending movement to the point of 0.7168 and further to the level of 0.7290. The level of 0.7389 will act as the major resistance and the double top is already set at the point of 0.7389. At the same time, if there is a breakout at the support levels of 0.7112 and 0.7046, this scenario may be invalidated. The material has been provided by InstaForex Company - www.instaforex.com |
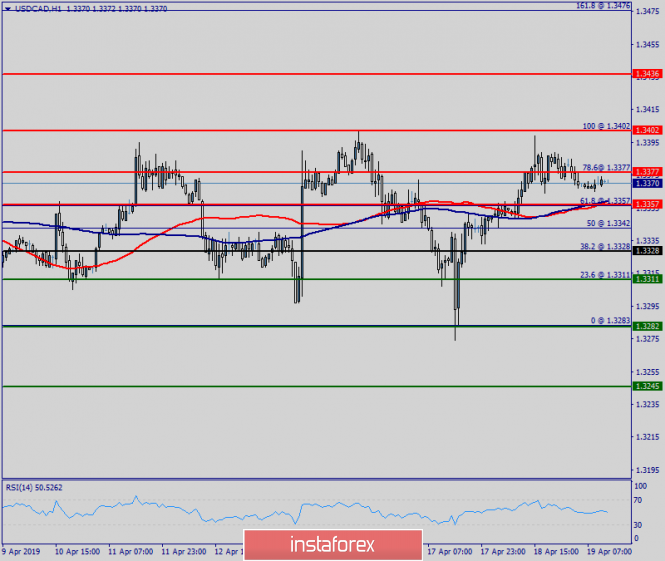
| Technical analysis of USD/CAD for April 19, 2019 Posted: 19 Apr 2019 03:22 AM PDT Overview: The USD/CAD pair continues to move upwards from the level of 1.3228. Yesterday, the pair rose from the level of 1.3228 (the level of 1.3228 coincides with a ratio of 38.2% Fibonacci retracement) to a top around 1.3357. Today, the first support level is seen at 1.3228 followed by 1.3311, while daily resistance 1 is seen at 1.3377. According to the previous events, the USD/CAD pair is still moving between the levels of 1.3228 and 1.3402; for that we expect a range of 174 pips (1.3402 - 1.3228). On the one-hour chart, immediate resistance is seen at 1.3357, which coincides with the double top. Currently, the price is moving in a bullish channel. This is confirmed by the RSI indicator signaling that we are still in a bullish trending market. The price is still above the moving average (100), Therefore, if the trend is able to break out through the first resistance level of 1.3357, we should see the pair climbing towards the daily resistance at the levels of 1.3377 and 1.3402. It would also be wise to consider where to place stop loss; this should be set below the second support of 1.3282. The material has been provided by InstaForex Company - www.instaforex.com |
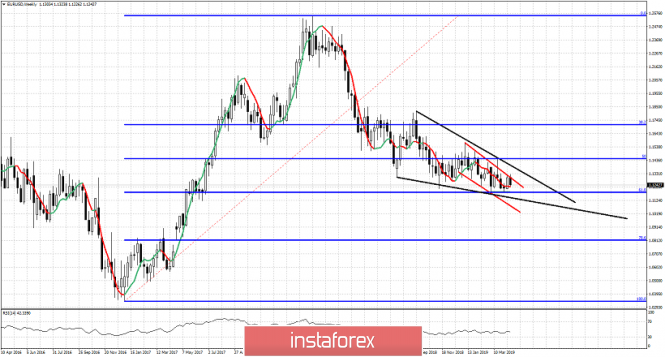
| Technical analysis for EURUSD for April 19, 2019 Posted: 18 Apr 2019 11:49 PM PDT EURUSD broke below support at 1,1280 yesterday and exited the short-term bullish channel turning short-term trend to bearish again. The inability to break above the medium-term resistance of 1.1330 lead to a rejection and a move towards 1.1250 and lower. Bulls need to react now or we might see new lows below 1.12-1.1170 soon.
Black lines - bullish wedge pattern EURUSD got rejected once again at the upper channel boundary. Medium-term trend remains bearish and after yesterday's reversal and failure to hold above 1.1250 is a bearish short-term sign. The bigger picture in EURUSD however as shown in the weekly chart above remains bearish. As long as price is inside the downward sloping wedge pattern and inside the red bearish channel, trend will remain bearish. Major support is at 61.8% Fibonacci retracement that we already reached and so far support is being respected. A major turning point could be around the corner but bulls need to see more signs of strength. Bulls need to recapture 1.13 fast and stay above it. Major trend reversal will be confirmed on a break above 1.14-1.1450. Until then price is vulnerable to a move below 1.12. The material has been provided by InstaForex Company - www.instaforex.com |
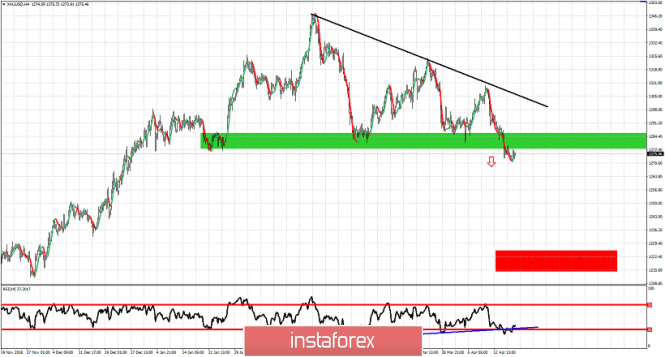
| Technical analysis for Gold for April 19, 2019 Posted: 18 Apr 2019 11:44 PM PDT Gold price remains in a bearish short-term trend. Gold price broke below important support levels but the move lower has not extended yet towards our $1,250-60 target area. Price has only reached as low as $1,270.
Red rectangle - target Black line - major resistance trend line Gold price as explained in previous posts might first need to make a back test of the broken support now resistance area of $1,280-90. The RSI has broken through the blue trend line support but is also turning upwards. This could mean a bounce towards $1,290 could come over the next few sessions. As long as price is below the black trend line resistance medium-term trend remains bearish and Gold is vulnerable to a move towards $1,250-$1,220. The material has been provided by InstaForex Company - www.instaforex.com |
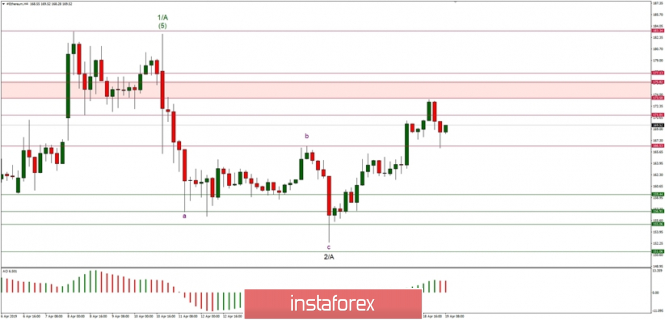
| Elliott Wave analysis of ETH/USD for 19/04/2019 Posted: 18 Apr 2019 11:33 PM PDT Crypto Industry News: The founder and CEO of Tron, Justin Sun, claimed that in his opinion the Tron ecosystem would "officially collaborate" with Ethereum later this year. Sun spoke during the interview on the podcast The Crypto Chick. More specifically, Sun said that, according to him, "even in the course of this year, we will see that the Throne is cooperating, officially cooperating with Ethereum." In answer to the question about the last tweets of Ethereum co-founder Vitalik Buterin on the subject of Tron, Sun stated: |I think that in the future we will be working with many Ethereum developers, as well as with companies built on Ethereum to improve this industry". Technical Market Overview: The ETH/USD pair has hit the technical resistance level at 173.50 and reversed quickly towards the technical support at the level of 166.53. Any breakout below this level of support would indicate that a possible short-term top is already in place and the market will now penetrate the lower price levels in order to complete the corrective cycle. Weekly Pivot Points: WR3 - $201 WR2 - $192 WR1 - $173 Weekly Pivot - $164 WS1 - $148 WS2 - $138 WS3 - $120 Trading Recommendations: The daytraders should have closed the buy orders at the level of 173.50 as this was the take profit level for the up move. No open trades for now for daytraders. The best trading strategy for this market for swing traders is to trade with the longer-timeframe trend, which is now an uptrend. The good level to place a buy order was just above the level of $152. This point of view is valid as long as the technical support at the level of $151 is broken.
|
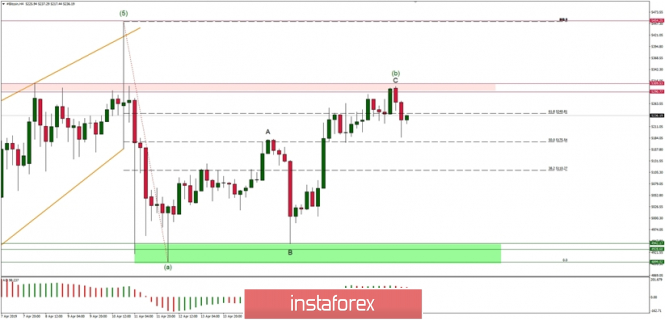
| Elliott Wave analysis of BTC/USD for 19/04/2019 Posted: 18 Apr 2019 11:21 PM PDT The Japanese financial regulator, the Financial Services Agency (FSA), no longer wants to describe Bitcoin as a virtual currency. During the plenary session of the 41st General Assembly of the Financial Council and the 29th Meeting of the Financial Division, Professor Iwashita Goto from the Public Policy Graduate School of Kyoto University asked the members to adjust their views on Bitcoin. The largest cryptocurrency, he claimed, became more than a way to deal, because of its boundless qualities that led her to appear all over the world in her ten-year history. "I do not think it's worth being called Bitcoin virtual currency" - he concluded. Comments appear while Japan continues to formalize its domestic cryptocurrency industry. Following the introduction of incentive regulations, the FSA began issuing licenses to new cryptocurrency markets that want to serve the Japanese market. Technical Market Overview: The last wave to the upside looks completed as the market has hit the technical resistance zone located between the levels of $5,290 - $5,309 and reversed towards the level of $5,182 which will now act as technical support for the price. If the down move will accelerate below this support, the next targets are seen at the levels of $5,000 and $4,942. Weekly Pivot Points: WR3 - $5,898 WR2 - $5,642 WR1 - $5,340 Weekly Pivot - $5,108 WS1 - $4,789 WS2 - $4,547 WS3 - $4,228 Trading Recommendations: The best trading strategy for this market for daytraders is to sell the end of the local correction in wave B around the level of $5,290 - $5,309 with a target at the levels of $4,942 and $4,899. The final target is seen at the level of $4,800. The best strategy for the swing traders is to trade with the longer-timeframe trend, which is now an uptrend. The best level for opening the buy orders is around the level of $4,800. This point of view is valid as long as the technical support at the level of $4,795 is broken.
|
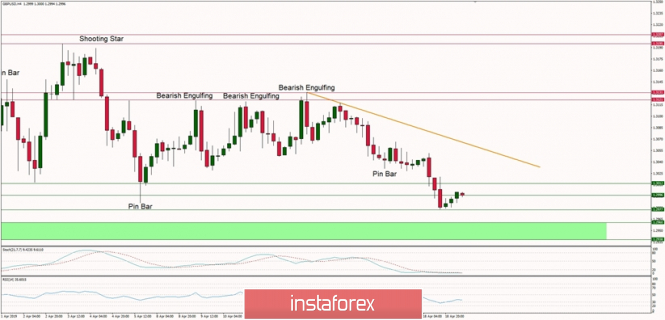
| Technical analysis of GBP/USD for 19/04/2019 Posted: 18 Apr 2019 11:11 PM PDT Technical Market Overview: We finally have some movement on the GBP/USD pair. The market has broken below the technical support at the level of 1.3012 and 1.2996. Currently, the price has hit technical support at the level of 1.2977 and bounced a little. It looks like the down move has not been finished yet despite the oversold market conditions as the momentum remains weak and negative. The next target for bears is seen at the level of 1.2960 - 1.2930 (key technical support zone). Weekly Pivot Points: WR3 - 1.3225 WR2 - 1.3177 WR1 - 1.3116 Weekly Pivot - 1.3067 WS1 - 1.3006 WS2 - 1.2961 WS3 - 1.2904 Trading Recommendations: The best trading strategy for this market for daytraders is to trade the oversold/overbought conditions and support-resistance levels. The swing traders must stay patient and wait for a breakout. The key support and resistance levels are drawn on the chart.
|
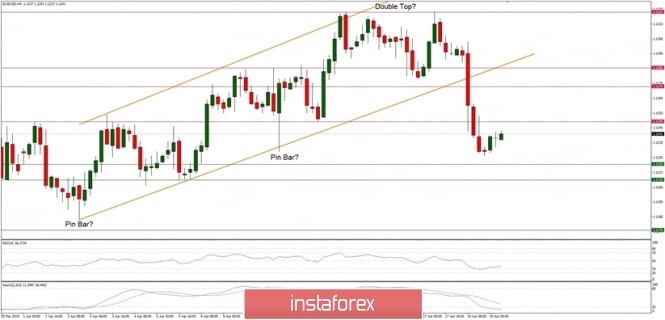
| Technical analysis of EUR/USD for 19/04/2019 Posted: 18 Apr 2019 11:00 PM PDT Technical Market Overview: The EUR/USD pair has made a Double Top price formation at the level of 1.1323 that was confirmed by two Bearish Engulfing candlestick formations as well. Since then the market has broken the technical support at the levels of 1.1285, 1.1273 and 1.1249. Moreover, the price has fallen out of the corrective channel as well, so now the top is confirmed. The local low was made at the level of 1.1226, just above the technical support at the level of 1.1220. It does not look like the end of the down move yet and the next targets are seen at the levels of 1.1210 and even 1.1176. Weekly Pivot Points: WR3 - 1.1459 WR2 - 1.1387 WR1 - 1.1347 Weekly Pivot - 1.1275 WS1 - 1.1236 WS2 - 1.1164 WS3 - 1.1121 Trading Recommendations: The sell orders that were placed as close to the level of 1.1323 with a protective stop loss at the level of 1.1332 should be still open. The are chances that the market will return to the down move soon. Any violation of the level of 1.1176 is the first indication of a downtrend resuming.
|
| Trading plan for EUR/USD for April 19, 2019 Posted: 18 Apr 2019 10:44 PM PDT
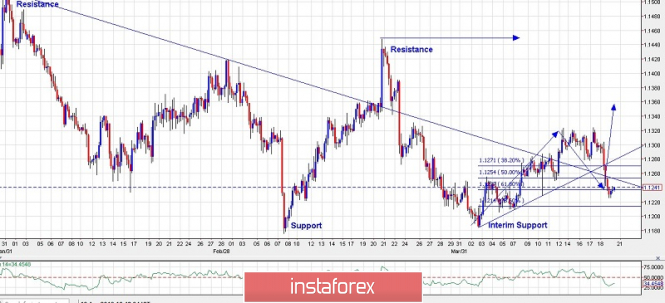
Technical outlook: The EUR/USD pair dropped below 1.1280 levels yesterday taking longs out, but we were at a minimum risk. The trade setup still remains both sides, with a little bias towards the south. The EUR/USD pair is trading at 1.1240 levels at this time in writing and seems to have found interim support at the fibonacci 0.618 ratio of the rally between 1.1183 and 1.1324 levels earlier, as displayed here. At the same time, please be aware that prices have broken below its counter trend line support and re-entered into the sell zone, giving an edge to the bears. In either case, we can expect a rally at least towards 1.1280/85 levels before deciding a further course of direction. On the flip side, a fibonacci 0.618 bounce could also enable a push higher towards the 1.1340/50 region. As a subset of both scenarios, a rally is the most likely outcome for now, towards at least 1.1280/85 levels, if not higher. Also note that the RSI has already turned higher from 30 levels, which is also supportive to the above conclusion. Trading plan: Long again @ 1.1230, stop at 1.1180, target 1.1285 and higher. Good luck! The material has been provided by InstaForex Company - www.instaforex.com |
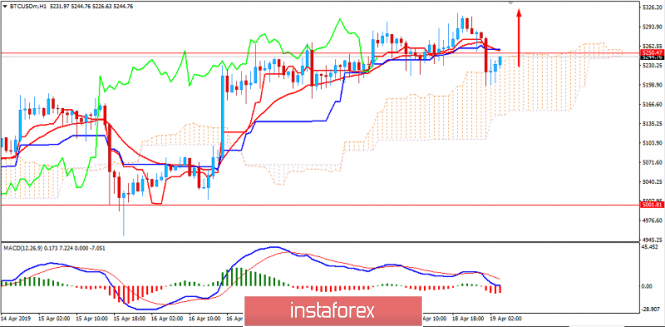
| BITCOIN pullback below $5,250 to indicate counter-move? April 19, 2019 Posted: 18 Apr 2019 10:08 PM PDT Bitcoin has been consolidating at near $5,250 for a while now. Holding above the dynamic support area of Kumo Cloud along the way indicates further upward pressure that is being formed now. Bitcoin has been extending a climb without any new lows for the last 123 days that indicates further upward pressure which is sure to attract more bulls along the way. The bullish sentiment is still setting the tone in the market despite the recent volatility at around $5,250. Amid the persistent bullish pressures along the way, the price will keep upward momentum with a target towards $5,500 and later towards $6,000. The price recently managed to jump above $5,250 with strong bullish momentum but could not sustain it further. So, the price sank below the area with impulsive bearish momentum. The dynamic levels like 20 EMA, Tenkan, and Kijun line are now holding above the price. These levels are likely to create barriers for the upcoming upward pressure in the coming days. As the price remains above $5,000 with a daily close, the bullish bias is going to push the price higher. SUPPORT: 4,800-80, 5,000 RESISTANCE: 5,250, 5,500 BIAS: BULLISH MOMENTUM: VOLATILE
|
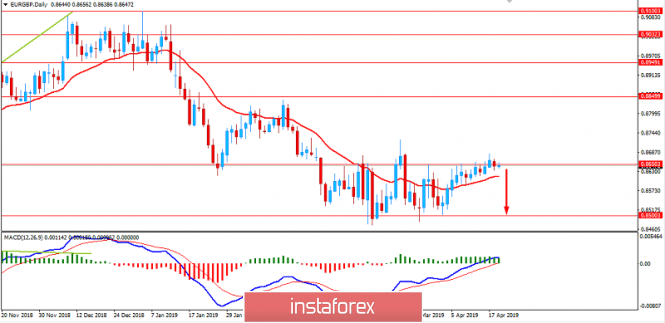
| Fundamental Analysis of EUR/GBP for April 19, 2019 Posted: 18 Apr 2019 09:48 PM PDT EUR managed to gain momentum over GBP recently after the dominant bearish trend established by GBP. Earlier this week, the pair entered a consolidation phase between the 0.8500-0.8650 area. The ECB left the key policy rate unchanged at a record low of 0.0% along with the deposit rate. The ECB stated at its last policy meeting that they don't have any plan to increase the policy rate at least until late 2019. The main focus for the ECB would be to ensure the sustained consumer inflation to the levels that are below, but close to 2% over the medium term. Inflation rates are drifting towards the official target level. The euro area's real GDP rose by 0.2% in the fourth quarter of 2018, following an increase of 0.1% in Q3. The manufacturing sector remains feeble due to soft external demand. An annual HICP inflation edged down to 1.4% in March 2019 from 1.5% in February because of a decline in prices of food, services, and non-energy industrial goods. Broad money growth improved by 4.3% in February 2019 from 3.8% in January. The annual growth rate of loans to non-financial corporations recovered to 3.7% in February 2019 from 3.4% in January. Overall, the European economy in on a recovery mode. Moreover, Brexit tensions also calmed down for a few months. On the other hand, the UK is in the grips of political gridlock without prospects of easing. Theresa May's government failed to agree on the Brexit option. The EU leaders granted the UK a 6-month extension until October 31. The UK is looking forward for a new Governor of the Bank of England to succeed Mark Carney who is to leave the office by January 2020. Recently UK Average Earning Index was published unchanged as expected at 3.5%, an Unemployment Rate remained flat at 3.9%, and Claimant Count Change showed a negative result increasing to 28.3k from the previous figure of 26.7k which was expected to decrease to 17.3k. Moreover, UK Retail Sales unexpectedly surged to 1.1% in March from -0.6% in February which was expected to be at 0.2%. To sum it up, GBP is firmer than EUR amid the ongoing economic backdrop. Now let us look at the technical view. The price is currently trading the edge of 0.8650 area with fading bullish momentum which indicates further bearish pressure in the coming days. The price is currently forming Bearish Continuous Divergence which is expected to lead to further downward pressure with a target towards 0.8500 area in the coming days.
|
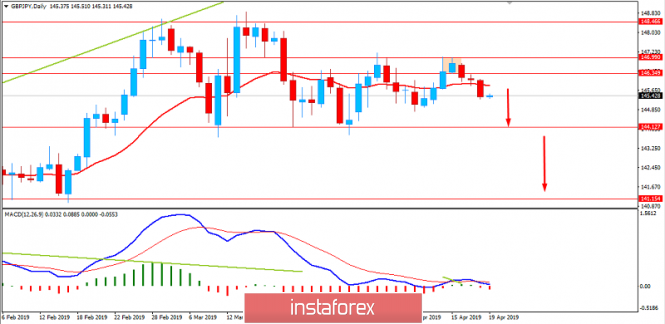
| Fundamental Analysis of GBP/JPY for April 19, 2019 Posted: 18 Apr 2019 09:25 PM PDT JPY gained impulsive momentum recently against GBP. So, the pair is going to trade with a bearish bias in the coming days. The UK posted a downbeat CPI report. On the other hand, Average Earning remains steady. Besides, retail sales also surged last month that is a promising sign for the domestic economy. The UK is in the grips of political gridlock without prospects of easing. Theresa May's government failed to agree on the Brexit option. The EU leaders granted the UK a 6-month extension until October 31. Recently UK Average Earning Index was published unchanged as expected at 3.5%, Unemployment Rate remained flat at 3.9%, and Claimant Count Change showed a negative outcome of an increase to 28.3k from the previous figure of 26.7k which was expected to decrease to 17.3k. Moreover, UK Retail Sales expanded sharply to 1.1% from the previous value of -0.6%, much better than the forecast for a modest gain to 0.2%. On the JPY side, today National Core CPI report was published with an increase to 0.8% which was expected to be unchanged at 0.7% while BOJ is predicting inflation to fall. The Bank of Japan is due to post an inflation outlook next week, so the regulator is assumed to predict that inflation will remain below the 2% target. The central bank is likely to downgrade its growth and price forecast for the fiscal year due to headwinds from a slowdown in the global economci growth. Moreover, Japan's government is considering a sales tax hike in October. This measures could impact the consumer spending and money flow in the economy. A tax hike is sure to influence JPY in the medium term. Next week, the Bank of Japan is holding a policy meeting and a press conference to follow. Besides, traders are anticipating an economic outlook report and a monetary policy statement. Thus, JPY is responsible for higher volatility in the pair next week. To sum it up, JPY has been propped up by the latest economic reports. GBP has been hurt by a raft of mixed economic data that is bearish for the British currency. Nevertheless, the pressure is expected to be short-lived as GBP has a higher chance to regain momentum as things are unfolding positively for the UK in the coming days. Now let us look at the technical view. The price managed to sustain the bearish momentum which is expected to push the price lower towards 144.00 support area in the coming days. The price recently managed to dip below the dynamic level of 20 EMA with a daily close which indicates further bearish pressure. As the price remains below 147.00 area with a daily close, the pair will sustain the bearish pressure in the coming days. A break below 144.00 with a daily close is expected to extend the bearish momentum with a target towards 141.00 area.
|
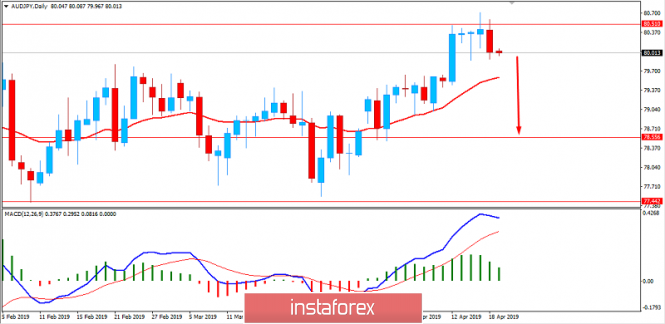
| Fundamental Analysis of AUD/JPY for April 19, 2019 Posted: 18 Apr 2019 09:01 PM PDT AUD/JPY has been rejected off the 80.50 resistance area with a daily close which is expected to lead to further bearish momentum in the coming days. Yesterday Australia released an employment change report which showed an increase to 25.7k jobs in March from the previous figure of 10.7k which was expected to be at 15.2k. On the minus side, an unemployment rate edged up to 5.0% as expected from of 4.9% in the previous month. The global slowdown in the economy is affecting the international trade of Australia. The long-term bond yields have fallen. Besides, the short-term bank funding costs have weakened further. Today due to observance of Good Friday, the economic calendar lacks any data from Australia. However, next week Australian CPI and PPI reports are due which will play a vital role to further AUD gains. On the JPY side, today National Core CPI report was published with an increase to 0.8% which was expected to be unchanged at 0.7% while BOJ is predicting inflation to fall. The Bank of Japan is due to post an inflation outlook next week, so the regulator is assumed to predict that inflation will remain below the 2% target. The central bank is likely to downgrade its growth and price forecast for the fiscal year due to headwinds from a slowdown in the global economic growth. Moreover, Japan's government is considering a sales tax hike in October. This measures could impact the consumer spending and money flow in the economy. A tax hike is sure to influence JPY in the medium term. Next week, the Bank of Japan is holding a policy meeting and a press conference to follow. Besides, traders are anticipating an economic outlook report and a monetary policy statement. Thus, JPY is responsible for higher volatility in the pair next week. To sum it up, market sentiment on AUD is confused due to the mixed employment data from Australia. On the other hand, JPY is supported by positive economic reports along with the inflation target chase. So, JPY will gain ground versus AUD in the short term. Now let us look at the technical view. The price moved lower from 80.50 area under strong impulsive bearish pressure which engulfed the previous 3 days of bullish indecision daily candles in one go. The price is currently trading above the dynamic level of 20 EMA. However, MACD with a Continuous Bearish Divergence in the making is expected to push the price lower towards 78.50 support area in the coming days. As the price remains below 80.50 area with a daily close, the pair is set to trade with the bearish momentum.
|
| You are subscribed to email updates from Forex analysis review. To stop receiving these emails, you may unsubscribe now. | Email delivery powered by Google |
| Google, 1600 Amphitheatre Parkway, Mountain View, CA 94043, United States | |
No comments:
Post a Comment