
Forex analysis review |
- NZD/USD approaching support, potential bounce!
- EUR/USD approaching support, potential bounce!
- XAG/USD approaching support, potential bounce!
- Fractal analysis of major currency pairs on April 3
- EUR/USD: will the euro cross the Rubicon?
- April 2, 2019 : GBP/USD Intraday technical analysis and trade recommendations.
- AUD/USD: traders didn't believe RBA
- BITCOIN Analysis for April 2, 2019
- Bitcoin analysis for April 02, 2019
- Analysis of Gold for April 02, 2019
- USD/JPY analysis for April 02, 2019
- EUR / USD plan for the American session on April 1. Eurozone producer prices showed no growth
- Brent will not scare the dollar
- GBP/USD: plan for the American session on April 2. The pound is falling after the news on Brexit, putting traders at a standstill
- The dollar is growing because economic problems no longer seem to be a problem
- Brexit: The decisive day has come
- Side dynamics in the markets will continue in the near future
- Wave analysis for GBP / USD pair on April 2. Briton can not decide on a breakthrough of the minimum wave b
- Brexit: finding a way out of the impasse means choosing the lesser of the evils
- GBP / USD. April 2. The trading system. "Regression Channels". The British Parliament rejected four of the Brexit option
- EUR/USD. April 2. The trading system. "Regression Channels". Now, the European currency is reduced due to the weak macroeconomic
- EURUSD: The demand for the US dollar will continue to remain in uncertainty
- Analysis of EUR/USD divergence for April 2. The euro depreciated against the dollar slowly
- Analysis of GBP/USD divergence for April 2. The pound "pulls" down again
- Trading recommendations for the EURUSD currency pair - placement of trading orders (April 2)
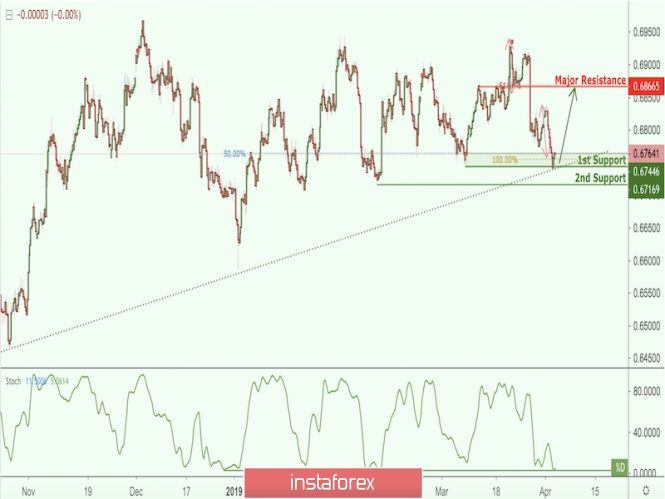
| NZD/USD approaching support, potential bounce! Posted: 02 Apr 2019 06:53 PM PDT NZDUSD is approaching our first support at 0.6744 (long term ascending support line, horizontal swing low support, 50% Fibonacci retracement , 100% Fibonacci extension ) where a strong bounce might occur above this level to our major resistance at 0.6866 (horizontal overlap resistance, 61.8% Fibonacci retracement ). Stochastic is also approaching support. Trading CFDs on margin carries high risk. Losses can exceed the initial investment so please ensure you fully understand the risks.
|
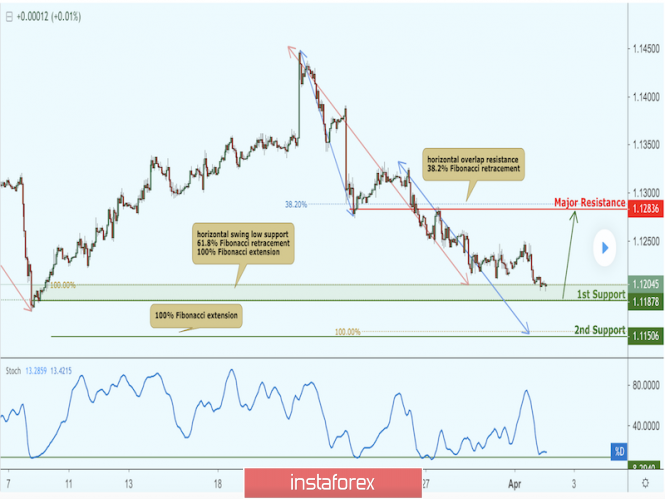
| EUR/USD approaching support, potential bounce! Posted: 02 Apr 2019 06:50 PM PDT EURUSD is approaching our first support at 1.1187 (horizontal swing low support, 61.8% Fibonacci retracement , 100% Fibonacci extension ) where a strong bounce to our major resistance at 1.1283 (horizontal overlap resistance, 38.2% Fibonacci retracement ) might occur. Stochastic is also approaching support where we might see a corresponding bounce in price. Trading CFDs on margin carries high risk. Losses can exceed the initial investment so please ensure you fully understand the risks.
|
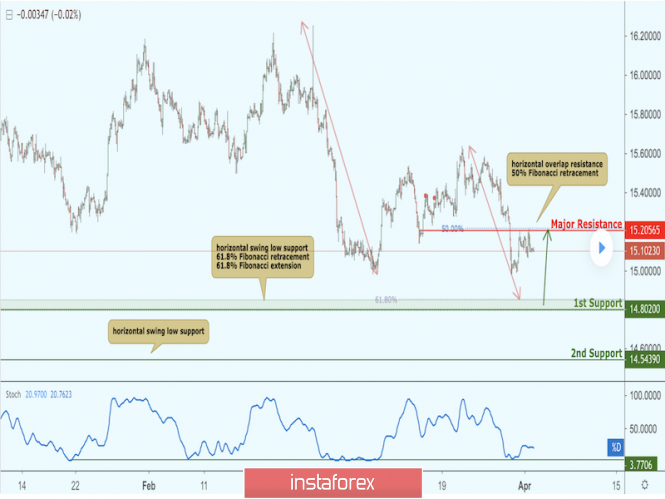
| XAG/USD approaching support, potential bounce! Posted: 02 Apr 2019 06:48 PM PDT XAGUSD is approaching our first support at 14.8020 (horizontal swing low support, 61.8% Fibonacci retracement , 61.8% Fibonacci extension ) where a strong bounce to our major resistance at 15.20565 (horizontal overlap resistance, 50% Fibonacci retracement ) might occur. Stochastic is also approaching support where we might see a corresponding bounce in price. Trading CFDs on margin carries high risk. Losses can exceed the initial investment so please ensure you fully understand the risks.
|
| Fractal analysis of major currency pairs on April 3 Posted: 02 Apr 2019 06:20 PM PDT Forecast for April 3: Analytical review of H1-scale currency pairs: For the euro / dollar pair, the key levels on the H1 scale are: 1.1318, 1.1285, 1.1265, 1.1238, 1.1203, 1.1180 and 1.1134. Here, we continue to follow the development of the downward structure of March 20. Short-term movement to the bottom is expected in the range of 1.1203 - 1.1180. We consider the level of 1.1134 to be a potential value for the bottom. After reaching this level, we expect a rollback to the top. Care in the correction is expected after the breakdown of the level of 1.1238. Here, the first goal is 1.1265. Short-term upward movement is possible in the range of 1.1265 - 1.1285. The breakdown of the latter value will have to form the initial conditions for the upward cycle. Here, the potential target is 1.1318. The main trend is the downward structure of March 20. Trading recommendations: Buy 1.1238 Take profit: 1.1265 Buy 1.1287 Take profit: 1.1318 Sell: 1.1203 Take profit: 1.1181 Sell: 1.1178 Take profit: 1.1135 For the pound / dollar pair, the key levels on the H1 scale are: 1.3271, 1.3153, 1.3051, 1.2984, 1.2948, 1.2892, 1.2859 and 1.2797. Here, the price entered an equilibrium state: the downward structure of March 27 and the formation of potential for the top of March 29. Continuation of the movement to the bottom is expected after the breakdown of the level of 1.3051. In this case, the first target is 1.2984. The passage at the price of the noise range 1.2984 - 1.2948 will lead to the development of the downward structure from March 27. Here, the target is 1.2892. Meanwhile, in the range of 1.2892 - 1.2859, there is a price consolidation. For the potential value for the bottom, we consider the level of 1.2797. After reaching which, we expect a rollback to the top. The development of the ascending structure of March 29 is expected after the breakdown of 1.3153. In this case, the potential target is 1.3271, and consolidation is near this level. The main trend is the equilibrium state. Trading recommendations: Buy: 1.3155 Take profit: 1.3265 Buy: Take profit: Sell: 1.3050 Take profit: 1.2985 Sell: 1.2946 Take profit: 1.2892 For the dollar / franc pair, the key levels on the H1 scale are: 1.0065, 1.0040, 1.0023, 0.9996, 0.9975, 0.9961 and 0.9938. Here, we are following the development of the ascending structure of March 27. Continuation of the movement to the top is expected after the breakdown of the level of 0.9996. In this case, the goal is 1.0023. Meanwhile, in the range of 1.0023 - 1.0040, there is a short-term upward movement, as well as consolidation. For the potential value for the top, we consider the level of 1.0065. After reaching which, we expect consolidation, as well as a rollback to the bottom. Short-term downward movement is possible in the range of 0.9975 - 0.9961. The breakdown of the last value will lead to a prolonged correction. Here, the target is 0.9938. This level is a key support for the top. The main trend - the ascending structure of March 27. Trading recommendations: Buy: 0.9998 Take profit: 1.0020 Buy : 1.0025 Take profit: 1.0038 Sell: 0.9975 Take profit: 0.9964 Sell: 0.9958 Take profit: 0.9942 For the dollar / yen pair, the key levels on the scale are : 112.69, 112.26 , 112.05, 111.69, 111.45, 111.19, 111.00 and 110.67. Here, we are following the development of the ascending structure of March 25. Short-term upward movement is expected in the range of 111.45 - 111.69. The breakdown of the last value should be accompanied by a pronounced upward movement. Here, the goal is 112.05, while in the range of 112.05 - 112.26, there is a consolidation. For the potential value for the top, we consider the level of 112.69, after reaching which, we expect a rollback to the bottom. Short-term downward movement is possible in the range of 111.19 - 111.00. The breakdown of the latter value will lead to a prolonged correction. Here, the goal is 110.67. This level is a key support for the upward structure. The main trend: the ascending structure of March 25. Trading recommendations: Buy: 111.47 Take profit: 111.66 Buy: 111.72 Take profit: 112.05 Sell: 111.19 Take profit: 111.03 Sell: 110.98 Take profit: 110.70 For the Canadian dollar / US dollar pair, the key levels on the H1 scale are: 1.3381, 1.3349, 1.3329, 1.3300, 1.3257, 1.3229 and 1.3189. Here, we continue to follow the development of the downward structure of March 28. At the moment, the price is in the correction zone. Continuation of the movement to the bottom as an impulse is expected after the breakdown 1.3300. In this case, the target is 1.3257. Meanwhile, in the range of 1.3257 - 1.3229, there is a short-term downward movement, as well as consolidation. For the potential value for the bottom, we consider the level of 1.3189. After reaching this level, we expect a rollback to the top. Consolidated movement is possible in the range of 1.3329 - 1.3349. The breakdown of the latter value will lead to a prolonged correction. Here, the target is 1.3381. This level is a key support for the downward structure of March 28. The main trend is the downward structure of March 28, the stage of correction. Trading recommendations: Buy: Take profit: Buy : 1.3351 Take profit: 1.3380 Sell: 1.3300 Take profit: 1.3260 Sell: 1.3255 Take profit: 1.3230 For the pair Australian dollar / US dollar key levels on the H1 scale are : 0.7131, 0.7096, 0.7081, 0.7048, 0.7037, 0.7011, 0.6994 and 0.6969. Here, the price has issued a local structure for the bottom of April 1. Continuation of the movement to the bottom is expected after the price passes the noise range 0.7048 - 0.7037. In this case, the target is 0.7011. Meanwhile, in the range of 0.7011 - 0.6994, there is a short-term downward movement, as well as consolidation. For the potential value for the bottom, we consider the level of 0.6969. After reaching which, we expect a rollback to the top. Short-term upward movement is possible in the range of 0.7081 - 0.7096. The breakdown of the latter value will have to form an upward structure. Here, the potential target is 0.7131. The main trend is the local structure for the bottom of April 1. Trading recommendations: Buy: 0.7081 Take profit: 0.7094 Buy: 0.7098 Take profit: 0.7130 Sell : 0.7037 Take profit : 0.7011 Sell: 0.7008 Take profit: 0.6996 For the euro / yen pair, the key levels on the H1 scale are: 125.93, 125.43, 125.01, 124.39, 124.06, 123.59 and 123.03. Here, we are following the formation of the ascending structure of March 28. Continuation of the movement to the top is expected after the breakdown of the level of 125.01. In this case, the goal is 125.43, and consolidation is near this level. We are waiting for clearance of the expressed initial conditions for the upward cycle. For the potential value for the top, we consider the level of 125.93. Short-term downward movement is possible in the range of 124.39 - 124.06. The breakdown of the latter value will have to the development of the downward movement and here, the first goal is 123.59. The main trend is the formation of the ascending structure of March 28. Trading recommendations: Buy: 125.01 Take profit: 125.40 Buy: 125.50 Take profit: 125.90 Sell: 124.39 Take profit: 124.10 Sell: 124.00 Take profit: 123.70 For the pound / yen pair, key levels on the H1 scale are : 148.20, 147.24, 146.51, 145.17, 144.76, 144.29 and 143.83. Here, we continue to monitor the formation of the ascending structure of March 29. Continuation of the movement to the top is expected after the breakdown of 146.51. In this case, the goal is 147.24, while near this level price consolidation. For the potential value for the top, we consider the level of 148.20, from which we expect a rollback. Short-term downward movement is possible in the range of 145.17 - 144.76. The breakdown of the latter value will lead to a prolonged correction. Here, the target is 144.29. This level is a key support for the upward structure. The main trend is the formation of the ascending structure of March 29. Trading recommendations: Buy: 146.51 Take profit: 147.20 Buy: 147.30 Take profit: 148.20 Sell: 145.17 Take profit: 144.78 Sell: 144.73 Take profit: 144.32 The material has been provided by InstaForex Company - www.instaforex.com |
| EUR/USD: will the euro cross the Rubicon? Posted: 02 Apr 2019 03:48 PM PDT Today, the EUR/USD pair is trading near annual lows marked in early March. Pressure on the single European currency was exerted by weak statistics on the eurozone and the increasing uncertainty on Brexit. Given the fact that the core inflation index in the eurozone remains well below the benchmark set by the ECB, and the index of business activity in the manufacturing sector in Germany is at a low level since the European debt crisis, it seems premature to talk about the speedy recovery of the bloc economy. In addition, according to Luis De Guindos, vice president of the ECB, markets are now underestimating the consequences of Britain's unorganized withdrawal from the EU, which could lead to a further slowdown in European GDP. This will be bad news for the euro. However, it is possible that the crisis of the British government's legislative and executive branches paralyzes London's political will so much that Great Britain will not exit the EU with or without an agreement. In addition, hopes of the European economy's gradual recovery still remains in connection with the willingness of Washington and Beijing to end the trade war. If the parties eventually make a deal, it will support the demand for risky assets and will be positive for the euro. In this case, the US currency risks falling. In the meantime, the dollar is in high demand due to the weakening of other major world currencies. According to experts, the final straw in the balance, which will provide a breakdown of the EUR/USD to a level of 1.118, below which the pair has not fallen since 2017, could be a report on the state of the US labor market in March, which will be released on Friday. The material has been provided by InstaForex Company - www.instaforex.com |
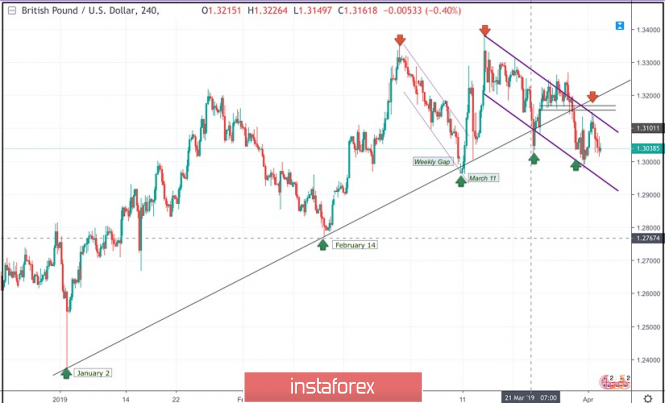
| April 2, 2019 : GBP/USD Intraday technical analysis and trade recommendations. Posted: 02 Apr 2019 09:44 AM PDT
On January 2nd, the market initiated the depicted uptrend line around 1.2380. This uptrend line managed to push price towards 1.3200 before the GBP/USD pair came to meet the uptrend again around 1.2775 on February 14. Another bullish wave was demonstrated towards 1.3350 before the bearish pullback brought the pair towards the uptrend again on March 11. A weekly bearish gap pushed the pair slightly below the trend line (almost reaching 1.2960) before the bullish breakout above short-term bearish channel was achieved on March 11. Bullish persistence above 1.3060 allowed the GBPUSD pair to pursue the bullish momentum towards 1.3130, 1.3200 then 1.3360 where the recent bearish pullback was initiated. Bullish persistence above 1.3250 was needed for confirmation of a bullish Flag pattern. However, significant bearish pressure was demonstrated below 1.3250 demonstrating a false bullish breakout above 1.3200 (the upper limit of the depicted bearish channel). Hence, the short term outlook turned to become bearish towards 1.3150 - 1.3120 where the depicted uptrend line failed to provide any immediate bullish support. By the end of last week, the price levels of 1.3020-1.3000 (the lower limit of the depicted movement channel) demonstrated significant bullish rejection. This pushed the pair up towards the price zone of (1.3150-1.3160) where the upper limit of the depicted bearish channel demonstrated evident bearish rejection to retest the recent bottom established around 1.3000-.2980. Trade Recommendations: Intraday traders should wait for another bullish pullback towards the upper limit of the movement channel as well as the backside of the broken uptrend line around (1.3160-1.3180) for a valid SELL entry. SL to be located above 1.3200. TP levels to be located around 1.3100 and 1.3020. The material has been provided by InstaForex Company - www.instaforex.com |
| AUD/USD: traders didn't believe RBA Posted: 02 Apr 2019 08:15 AM PDT The controversial rhetoric of the Reserve Bank of Australia disappointed AUD/USD traders, but the pair bears failed to break through the key support level of 0.7000. On the eve of the April meeting of the RBA, the market was overwhelmed by "dovish" expectations, so the relative restraint (and even a certain optimism) of the regulator did not allow sellers to launch a large-scale southern offensive. The Australian Central Bank did not repeat the rhetoric of its "neighbors" from the RBNZ, whose members actually announced a reduction in the interest rate this year. Philip Lowe kept his waiting position, trying to dispel the fears of many traders. Moreover, the head of the RBA even voiced optimistic estimates regarding the dynamics of the labor market. According to him, the Central Bank expects a further decline in unemployment and rising wages, and as a result – inflation. While Lowe acknowledged that growth would be more gradual, he remained optimistic. In addition, the head of the Australian regulator did not dramatize the situation with respect to the latest releases. Let me remind you that Australia's GDP in the last quarter of last year grew by only 2.3% in annual terms after the previous growth of 2.7% in the third quarter. RBA economists had expected this figure at 3.4%, so in January they revised their forecast for the current year. Compared to the previous three months, the country's economy grew by 0.2% after an increase of 0.3% in the third quarter of 2018. The PMI industrial activity index in Australian industry also slowed down quite noticeably, falling to a one-and-a-half year low of 52 points. However, the Australian Central Bank, despite such trends, "kept cool." According to Lowe, the global financial environment is still favorable, as are the prospects for the global economy. Naturally, Low recognized that the dynamics of global economic growth slowed against the background of increased risks (here he lamented the deterioration of the investment climate), but in his opinion, the situation is far from critical. It is likely that the head of the RBA was inspired by the latest news from the "front" of the US-China talks, which will continue this week in Washington. On the eve of this event, China took several friendly steps that indicate Beijing's intention to still find a common denominator with the States. First, the Chinese did not resume the action of retaliatory sanctions (although the "pause" expired in April), and secondly, at the legislative level, the synthetic substance fentanyl was completely banned — which the Americans had insisted on for so long. Such actions by the Celestial Empire again increased the likelihood of a trade transaction, and this fact affected the general mood of the markets. The Australian dollar reacts most acutely to such events, so yesterday the pair AUD/USD tested the 71st figure again, but the results of the April meeting of the RBA unfolded the price 180 degrees. What is the reason for the southern trend "Aussie", against the background of a relatively quiet meeting of the Australian Central Bank in April? In my opinion, the market is still confident that the regulator will be forced to lower the interest rate in the second half of the year. Following yesterday's meeting, some experts even set an approximate date for such a move – September of this year. After all, behind the screen of calm and balanced assessments lies the main conclusion: economic growth and inflation still do not justify the forecasts of the RBA. And given the slowdown in the Chinese economy, the key macro indicators of the European Union and even the United States, we cannot expect a sharp economic breakthrough in Australia. Of course, the Australian Reserve Bank was much more "courteous" with the market than the New Zealand regulator – but the essence of the main message does not change. The issue of easing the monetary policy of the RBA has not been removed from the agenda, and this fact will put background pressure on the Australian dollar. On the other hand, the lack of clear intentions and the exponentially wait-and-see position of the Central Bank of Australia keeps the pair AUD/USD afloat, that is, above the key support level of 0.7000. As a result, "Aussie" was stuck in a flat, the range of which narrowed down to price limits of 0.7030-0.7150. It is possible to break through this blockade only with the help of external fundamental factors, primarily due to the results of the US-China talks. If Beijing and Washington finally reach the final agreement, the pair AUD/USD will be fixed above the upper limit of the above price range. Otherwise, "Aussie" will designate for itself new landmarks within 68-69 figures. In terms of technology, the pair is also in the flat. This is indicated by the location of the price on the middle line of the Bollinger Bands indicator (D1 timeframe), as well as the presence of the pair in the Kumo cloud of the Ichimoku Kinko Hyo indicator. The support and resistance levels are the lower and upper lines of the Bollinger Bands indicator, which correspond to 0.7030 and 0.7150 marks. The material has been provided by InstaForex Company - www.instaforex.com |
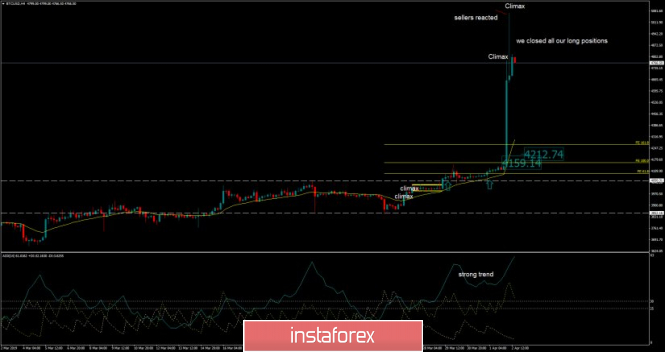
| BITCOIN Analysis for April 2, 2019 Posted: 02 Apr 2019 07:55 AM PDT Bitcoin jumped above $4,500 recently. Moreover, the price managed to touch and reject off the milestone price area of $5,000 as well with a single hourly candle. Bitcoin climbed above a 5-month high with such impulsiveness that came as a surprise for Bitcoin bulls. Currently, traders are taking profits. The price is currently holding inside a trading range between $4,500 to $5,000. Today's gain is assumed as triggering an order worth $100 million spread across US-based exchanges. The bullish bias was quite strong earlier but such impulsiveness was not quite expected even by regular market participants. Currently the price formed Bearish Continuous Divergence which is expected to lead to further corrective and volatile price action in the coming days before the price jumps higher again with a target towards $5,000 or even higher. The price is also being held by the dynamic levels as support which will help the price to rebound again if certain pullbacks occur along the way. As the price remains above $4,500, the most popular cryptocurrency is likely to reinforce impulsive upward momentum in the coming days. SUPPORT: 4,000, 4,250, 4,500 RESISTANCE: 5,000, 5,150, 5,300 BIAS: BULLISH MOMENTUM: NON-VOLATILE and IMPULSIVE
|
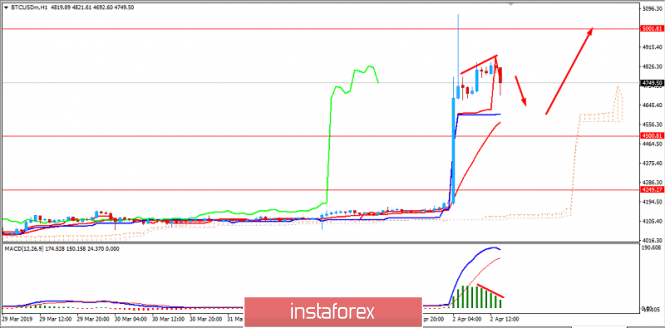
| Bitcoin analysis for April 02, 2019 Posted: 02 Apr 2019 07:23 AM PDT BTC has spiked higher as we expected. BTC did tested the price of $5.061. We exited all our positions and we are neutral now.
According to the H4 time-frame, we found that after the break of the consolidation range BTC did spike higher. Anyway, we found on the H4 time-frame 2 ultra big climatic bars (overextension), which is sign that buying at this stage looks extremely risky. ADX is reading is at 58, which is sign that momentum and trend are still strong. Potential downward correction towards $4.500 is possible. Strong resistance levels are seen at $5.064 and $5.770. Trading recommendation: We exited our long position that we held from $4.070 and took profit at $4.700 with the profit of 15%. Now, we are neutral since the climatic action on the top and we are waiting for more market information's before new position. The material has been provided by InstaForex Company - www.instaforex.com |
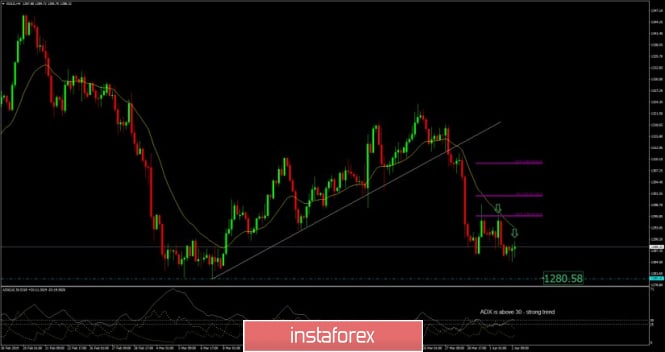
| Analysis of Gold for April 02, 2019 Posted: 02 Apr 2019 07:02 AM PDT Gold has been trading downwards as we expected. The price tested the level of $1.284.70. We are still expecting downside.
According to the H4 time-frame, we found that price rejected of the Fibonacci expansion 61.8% at the price of $1.296.00 and it rejected from the 20-exponential moving average (yellow line). The ADX reading above 30 level is suggesting us that trend is still strong. The resistance levels are seen at the price of $1.296.00 and $1.301.00. Key short-term support is seen at the price of $1.280.60. Trading recommendation: Watching for selling opportunities with the target at $1.280.60. The material has been provided by InstaForex Company - www.instaforex.com |
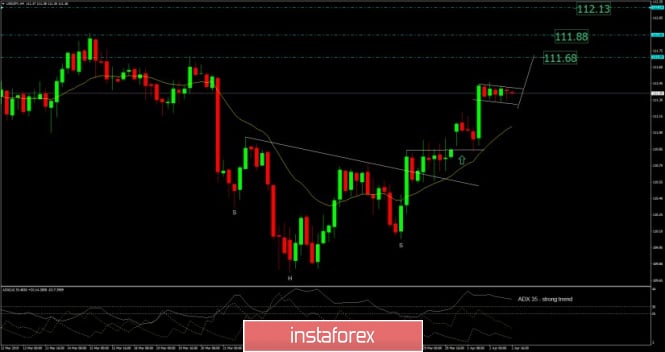
| USD/JPY analysis for April 02, 2019 Posted: 02 Apr 2019 06:48 AM PDT USD/JPY has been trading upwards as we expected. The price tested the level of 111.46. We are still expecting more upside on this currency pair.
According to the H4 time-frame, we found that the trend is still strong and the ADX reading at 35 is sign of the healthy trend. In the background inverted head and shoulders did set the upside tone and this is another confirmation of the bullish condition. The USD/JPY is trading in the consolidation phase at the moment and in past 20 hours we are seeing bullish flag in creation, which is another sign that the trend is stable. Flags are integral part of the consolidation in the trend condition. Support levels are seen at 111.20 and 110.85. Resistance levels are seen at 111.70 and 111.90. Trading recommendation: We are still long USD/JPY from 110.95 with the targets at 111.70 and 111.90. We secured today position on the breakeven so it is risk free position now. The material has been provided by InstaForex Company - www.instaforex.com |
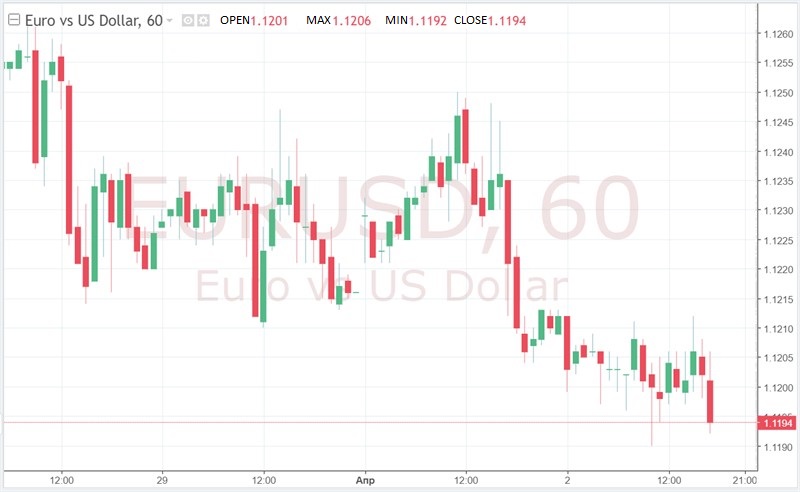
| EUR / USD plan for the American session on April 1. Eurozone producer prices showed no growth Posted: 02 Apr 2019 06:20 AM PDT To open long positions on EUR / USD pair, you need: Weak data on producer prices in the eurozone did not allow the euro to even return to the resistance level of 1.1212. For the second half of the day, the target of the bulls remains to this range and a breakthrough will lead to the formation of a new upward correction with testing of the upper boundary of the past side channel in the area of 1.1244, where I recommend taking profits. With the scenario of further reduction of the euro with the trend, it is best to look closely at long positions in EUR/USD after updating the lows of 1.1176 and 1.1149. To open short positions on EUR / USD pair, you need: The bears made an attempt to update at least this month but the downward trend did not receive support even against the background of weak data for the eurozone. However, as long as trading is conducted below the resistance of 1.1212, the pressure on the euro will continue and the formation of a false breakdown at this level will be a good signal for opening short positions. The main purpose of the bears are the lows near 1.1176 and 1.1149, where I recommend taking profits. With the scenario of returning EUR/USD back to the side channel of 1.1212-1.1244, it is best to return to short positions from its upper limit or sell for a rebound from a maximum of 1.1269. More in the video forecast for April 2 Indicator signals: Moving averages Trade is conducted below the 30- and 50-medium moving, which indicates the bearish nature of the market. Bollinger bands Bollinger Bands indicator volatility is very low, which does not give signals on market entry. Description of indicators MA (moving average) 50 days - yellow MA (moving average) 30 days - green MACD: fast EMA 12, slow EMA 26, SMA 9 The material has been provided by InstaForex Company - www.instaforex.com |
| Brent will not scare the dollar Posted: 02 Apr 2019 06:20 AM PDT Due to the growth of business activity in the USA and China, oil managed to close the quarter with the best result in a decade. Futures quotes for Brent and WTI climbed to the area of 5-month highs amid the rise of the March index of supply managers of the Middle Kingdom to the semi-annual peak and the growth of its American counterpart from 54.2 to 55.3. The Chinese economy is gradually recovering and the slowdown of GDP in United States may not be as serious as previously assumed. If so, then demand in black gold will play on the side of the "bulls". Given some weakness of the American production, this circumstance allows them to drive quotes to the north. According to Bloomberg experts, oil production by 14 OPEC countries fell by 295 thousand b/d to 30.385 million b/d in March. The indicator is ready to fall for the fourth month in a row, primarily due to the actions of Saudi Arabia. Riyadh is seriously determined to stabilize the market and for this, it reduces production to a 4-year minimum. Along with Washington's willingness to increase economic sanctions against Iran and Venezuela, this circumstance turns on the green light in front of the Brent and WTI bulls. Hedge funds do not get tired of increasing speculative long positions in both classes as prices are rising. Dynamics of speculative positions on Brent and WTI I have repeatedly noted that in the supply area, there is a process of rope pulling between OPEC and American producers. Therefore, black gold often responds to changes in demand. In this regard, the increased likelihood of the termination of the US-Chinese trade war and the economic recovery of the Middle Kingdom is positive news for the asset being analyzed. Moreover, the slowdown in domestic demand in the United States under the influence of the traditionally bad weather for the first quarter, as well as the shutdown of the US government and other factors affect the production. The number of rigs from Baker Hughes from mid-November decreased by 72 to 816 and the report of the US Energy Information Administration recorded the first decline in production from May 2018 by 90 thousand b/d to 11.9 million b/d. I do not think that this is a turning point of the uptrend. The current oil market conditions are extremely favorable for companies from the States. By taking advantage of high prices, they are able to double the volume of hedging operations. This will allow extracting oil in the future even in the face of a fall in its value. Black gold goes up against the strong US dollar. The bulls on the USD index are not scared of either the increase in the likelihood of a reduction in the federal funds rate in 2019 or the verbal intervention of the White House, which calls on the Fed to lower the rate from 2.5% to 2%. In my opinion, an infinitely long upward trend in the US currency cannot continue in the background of the completion of the economic cycle. Technically, a breakthrough of the resistance at $ 68.6 per barrel creates prerequisites for the continuation of the Brent rally in the direction of $ 72.9 (61.8% of the CD wave) as part of the transformation of the Shark pattern at 5-0. Brent daily chart |
| Posted: 02 Apr 2019 06:08 AM PDT To open long positions on GBP/USD you need: There is no decision on Brexit, which brings the UK closer to leaving the EU without an agreement. The deadline is on April 12. Buyers failed to keep above the support level of 1.3061, which now acts as resistance. In the second half of the day, the bulls can prove themselves after updating the large support level of 1.2992, and if there is no one, then it is better to open long positions on the rebound from the minimum of 1.2950. The return and consolidation above the resistance of 1.3061 can form a larger growth of GBP/USD with a test of the maximum of 1.3109, where I recommend fixing the profit. To open short positions on GBP/USD you need: The bears had worked out the morning scenario for the return and consolidation below the support of 1.3061, to which I drew attention in my review. At the moment, the next target of sellers will be the support area of 1.2992 and 1.2950, where I recommend fixing the profits. Any negative news on Brexit can lead to a big sale of the pound. In the scenario of an upward correction in the second half of the day, there is a resistance level of 1.3061, but I recommend to sell the pound immediately on the rebound only after the test of the maximum of 1.3109. Indicator signals: Moving Averages Trading is below 30-day and 50-moving averages, which indicates the formation of a downtrend in the pound. Bollinger bands In case of growth, the average border of the Bollinger Bands indicator in the region of 1.3075 will act as resistance. Description of indicators
|
| The dollar is growing because economic problems no longer seem to be a problem Posted: 02 Apr 2019 04:59 AM PDT The dollar continues to move up and has already updated its two-week high against the yen. Its weakening concerns about the weakness of the global economy, which raised the yield of US bonds from 15-month lows and contributes to the strengthening of the currency. It is worth noting that the growth in profitability was made possible by encouraging production data in the USA and China, optimism in this regard prompted investors to reduce their safe assets and return to more risky ones. The dollar will benefit from what is happening on the market and go up. In addition, it is worth noting seasonal factors that also help the dollar as the demand for currency attracts more and more traders. The observed sequence of positive reports increases risk appetite after excessive pessimism about the global economy dominated the markets during March. The rest of the special changes are not observed. The euro is slightly cheaper while the pound fluctuates depending on news related to Brexit. On Monday, it was up against expectations of an agreement reached then went down on Tuesday, after Theresa May's failure in parliament. The Australian dollar fell by 0.25 percent to 0.7092 dollars, but overall, it is holding up well. The reaction of the Australian to the decision of the Reserve Bank of Australia to leave interest rates unchanged at the level of 1.50 percent was limited because the decision was expected. |
| Brexit: The decisive day has come Posted: 02 Apr 2019 04:29 AM PDT On Monday, the British Parliament was unable to find a majority under any of the options for an agreement with the EU from the new referendum to the preservation of Britain in the trade and customs union. On Tuesday, Premier Theresa May appointed a government meeting and the issue of postponing a Brexit date should be resolved for a long time until the end of the year or more. This is a crucial moment for the markets: If such a delay is adopted, the Brexit theme will cease to be acute and will not affect the economy and markets for a long time. This can give a strong impetus to European currencies, particularly the pound and the euro. GBP/USD daily chart |
| Side dynamics in the markets will continue in the near future Posted: 02 Apr 2019 03:49 AM PDT The central banks of economically developed countries, whose currencies belong to the major pairs are traded on the so-called Grand Forex. It continues to demonstrate a clear dependence on the behavior of the US Federal Reserve. Today, the final decision of the Reserve Bank of Australia to leave the key interest rate unchanged was predictable. The regulator motivated his actions by the fact that the risks of lowering the growth of the national economy increased amid a decline in the growth of the global economy, despite the fact that there are still prospects for the growth of the global economy. The bank also said that GDP draws a weaker picture of the economy than the data from the labor market, while inflationary pressure remains low and stable. Previously, the same decision on interest rates was taken by the Central Bank of New Zealand, motivating its actions in a similar vein. In the wake of the outcome of the meeting of the Australian Central Bank, the local currency paired with the US dollar came under noticeable pressure and at the same time, its decline was clearly within the established local range of 0.7060-0.7160. In the previous article, we raised the topic of the reasons for such dynamics, namely the side in the currency markets. In our opinion, this picture will continue once again and it seems for a long period of time until it becomes clear whether the slowdown in the global economy and similar trends in the United States will stop. Will the eurozone or Germany, in particular, will slide into recession will China succeed in restoring economic growth? In addition, the situation around Brexit keeps investors in the tone of uncertainty on its prospects as they say. Probably, the overall picture will change only when the Fed finally makes a decision, for instance, to lower interest rates in the wake of the continued slowdown in US economic growth, but this can happen only after reaching an agreement on trade between Washington and Beijing. However, the question is: when will this happen and what will they be? Therefore, we continue to expect general lateral dynamics in the currency markets of major pairs, where the US dollar is present, at least in the short term until May, when this agreement can be concluded. Forecast of the day: The EUR/USD pair is trading below 1.1215 while pending the publication of production inflation data in the eurozone and the values of durable goods orders in the States. If manufacturing inflation shows a decline and orders in the US increases as expected, then the pair will head for 1.1175. The AUD/USD pair continues to move in the range at the upper boundary of the short-term downtrend, which is visible on the daily chart. If the data from the United States will be strong, the pair will overcome the mark of 0.7075 and continue to fall to 0.7040. However, if they are weaker than expected, the price may return to 0.7120. |
| Posted: 02 Apr 2019 03:47 AM PDT Wave counting analysis: On April 1, the GBP/USD pair added about 65 bp, while failing to update the previous local minimum, but retaining the prospects for building the downward trend section and its wave 3 . I still expect the tool to pass the b wave minimum, which will indicate the pair's willingness to further decline. The news background for the pair remains negative since the UK Parliament cannot determine its desires on the Brexit issue. Yesterday, they blocked four more different versions of Brexit. All these events are unlikely to cause demand for the sterling pound. Today, I recommend paying attention to the US report on orders for long-term use goods, although of course, Brexit remains the main theme for the pair in which everything moves towards a "hard" exit scenario. Purchase targets: 1.3350 - 100.0% Fibonacci 1.3454 - 127.2% Fibonacci Sales targets: 1.2961 - 0.0% Fibonacci General conclusions and trading recommendations: The wave pattern assumes the construction of a downward wave 3. The news background still remains on the side of the dollar, which implies a further decline in the pair. With the breakthrough of the minimum of wave b, there will be much more confidence in the further decrease. Thus, I expect a break at 1.2961 with further construction of the downward wave. The material has been provided by InstaForex Company - www.instaforex.com |
| Brexit: finding a way out of the impasse means choosing the lesser of the evils Posted: 02 Apr 2019 03:23 AM PDT
Brexit's initial deadline (March 29, 2019) has passed, but the United Kingdom is still in the European Union. Now, the latest date is April 12, and the country's withdrawal from the alliance can still take place. This will happen if British politicians are unable to reach a compromise. On the eve, the deputies of the House of Commons again rejected all options presented as an alternative to the "divorce" plan with the EU proposed by British Prime Minister Theresa May. However, lawmakers still have a chance to take the process of the country's withdrawal from the bloc under its control and express the opinion that the government should take further. Tomorrow, the next "signal" voting on alternative Brexit scenarios should take place in the Parliament. It is assumed that the majority of votes may receive the option proposed by the representative of the Conservative Party Kenneth Clarke, according to which the United Kingdom remains in the eurozone and negotiates with the EU on a temporary Customs Union. According to the newspaper The Sun, members of the government are increasingly inclined to the same option. Today, T. May is expected to hold five-hour talks with her cabinet, during which supporters and opponents of the country's withdrawal from the EU will fight for the best option. It is possible that the ministers may be invited to consider the possibility of moving the Brexit deadline until the end of the year or at a later date. Thus, if British politicians fail to reach a consensus, then Brexit will either have to be postponed for years, or go out on April 12. In the latter case, the "hard" scenario will cease to be a hypothetical threat and become a reality. According to Klaas Knot, member of the Board of Governors of the European Central Bank (ECB), the situation around Albion's exit from the EU is now the most serious threat to the eurozone from a political point of view. "The market does not seem to be counting on Brexit. If it happens, then the pound sterling will be under pressure," K. Knot noted. According to some estimates, in the event of an unregulated exit from the EU, the United Kingdom may lose about 2% of GDP in the next two years, and the British currency – to fall by 20-25%. "The pair GBP/USD is still above 1.30. Apparently, market participants are still hoping that a British exit from the EU without an agreement can be avoided. Some of them even expect Brexit to be delayed until 2020. However, if the situation does not clear up in the coming days, the pound against the dollar may drop to $ 1.28, as the market will start to get nervous about the "hard" Brexit," experts of the Italian bank UniCredit believe. |
| Posted: 02 Apr 2019 03:23 AM PDT 4-hour timeframe Technical details: The upper linear regression channel: direction - up. The lower linear regression channel: direction - sideways. Moving average (20; smoothed) - down. CCI: -62.0682 The GBP/USD currency pair adjusted to the moving average and failed to overcome it, therefore, it resumed its downward movement after the rebound. It would be rather strange if the pound sterling again began to grow, as there were no really important and positive messages from the UK. The UK manufacturing business index for March was published yesterday in the UK, and it was unexpectedly much higher than forecast (55.1 vs. 51.0). However, this index is unlikely to level the entire negative effect of Brexit. Meanwhile, the British Parliament held four more votes on possible options for the development of the event on Brexit. This time there was not even a loud announcement of this event. And quite rightly, as the Parliament did not try to surprise the public and rejected all four alternative options, including a new referendum, as well as the option of extending EU membership in the free economic zone, the option with the permanent Customs Union after Brexit and the option of another extension deadlines. The most interesting thing is that the Parliament has no choice but to continue to vote for all the options in a row, since it is necessary to choose and adopt at least one option. We can only watch all this chaos in the UK, which a few months ago it was even difficult to imagine. The pound, in our opinion, will continue to remain under pressure. Nearest support levels: S1 - 1.3062 S2 - 1.3000 S3 - 1.2939 Nearest resistance levels: R1 - 1.3123 R2 - 1.3184 R3 - 1.3245 Trading recommendations: The pair GBP/USD resumed its downward movement. Thus, short positions with targets at 1.3062 and 1.3000 before the color with Heikin Ashi indicator 1-2 bars in purple color are again relevant. Long positions will become relevant only after overcoming the moving with the first goal of 1.3184. From a fundamental point of view, there are few grounds for such an option. In addition to the technical picture should also take into account the fundamental data and the time of their release. Explanations for illustrations: The upper linear regression channel is the blue lines of the unidirectional movement. The lower linear channel is the purple lines of the unidirectional movement. CCI is the blue line in the indicator regression window. The moving average (20; smoothed) is the blue line on the price chart. Murray levels - multi-colored horizontal stripes. Heikin Ashi is an indicator that colors bars in blue or purple. The material has been provided by InstaForex Company - www.instaforex.com |
| Posted: 02 Apr 2019 03:23 AM PDT 4-hour timeframe Technical details: The upper linear regression channel: direction - down. The lower linear regression channel: direction - down. Moving average (20; smoothed) - down. CCI: -113.6938 On Tuesday, April 2, the currency pair EUR/USD resumed its fall and came close to the lower boundary of an important and strong support area of 1.1200 - 1.1270. It seems that this time, this area will still be overcome, but the chances for the eighth rebound from it also remain. Also, the price is now rested on the Murray level of "-1/8" - 1.1200. Yesterday was marked by the failure of macroeconomic statistics in the European Union and in the States. However, if in America at least the ISM business activity index in the manufacturing sector turned out to be better than expected, in Europe there was no such smoothing negative effect. Therefore, we saw another, if not collapse, then a decline in the euro currency. At present, the calendar of Europe is empty, and in America reports on orders for durable goods will be published. This is quite an important indicator, so a weaker value, rather than market expectations, may cause the long-awaited support of the European currency. Conversely, the strong value of these reports will send a pair below 1.1200. From a technical point of view, there is no reason to assume that the pair will turn up. Even the fastest Heikin Ashi indicator keeps pointing down. Therefore, we recommend to follow the trend and not trying to guess the next reversal of the pair to the top. Nearest support levels: S1 - 1.1200 S2 - 1.1169 Nearest resistance levels: R1 - 1.1230 R2 - 1.1261 R3 - 1.1292 Trading recommendations: The EUR/USD currency pair has resumed its downward movement. Thus, it is now recommended to trade short positions with targets at 1.1200 and 1.1169. A reversal of the Heikin Ashi indicator to the top will indicate a new round of corrective movement. Buy positions are recommended to be considered no earlier than fixing the pair above the moving average line with targets at 1.1292 and 1.1322. In this case, the trend in the instrument will change to ascending. In addition to the technical picture should also take into account the fundamental data and the time of their release. Explanations for illustrations: The upper linear regression channel is the blue lines of the unidirectional movement. The lower linear regression channel is the purple lines of the unidirectional movement. CCI - blue line in the indicator window. The moving average (20; smoothed) is the blue line on the price chart. Murray levels - multi-colored horizontal stripes. Heikin Ashi is an indicator that colors bars in blue or purple. The material has been provided by InstaForex Company - www.instaforex.com |
| EURUSD: The demand for the US dollar will continue to remain in uncertainty Posted: 02 Apr 2019 03:22 AM PDT Yesterday's data on the American economy, where, on the one hand, there was a decline in retail sales, and on the other, a steady increase in manufacturing activity, was interpreted differently by traders, which led to a slight strengthening of the US dollar. However, the downward trend for the EURUSD pair has not yet received a continuation. According to a report by the US Department of Commerce, consumer activity in the US in February of this year has declined significantly. Thus, retail sales fell immediately by 0.2% compared with the previous month, while economists had expected growth rates of 0.2%. If we do not take volatile prices for cars and gasoline, then retail sales in February fell immediately by 0.6%. Let me remind you that in January, according to the revised data, retail sales increased by 0.7%. The report also said that the main decline was observed in sales of furniture, electronic equipment, clothing, and food. The PMI for the US manufacturing industry, released in the afternoon, provided some support for the US dollar, as it was better than economists had expected. According to the report of the Institute for Supply Management, the PMI index for the manufacturing sector in March of this year rose to 55.3 points against 54.2 points in February. An index value above 50 points indicates an increase in activity. Economists had forecast a more moderate growth, to the level of 54.4 points. The main increase was observed in the price index, which in March returned above 50 points and amounted to 54.3 points against 49.4 in February. The employment index in March rose to 57.5 points versus 52.3. As for the technical picture of the EURUSD pair, the market remains on the side of euro sellers. The consolidation below the lower boundary of the side channel in the area of 1.1210 indicates that the pressure remains, which can lead to a new wave of decline in risky assets in the area of minimum 1.1170 and 1.1120. If buyers return to the market, it is unlikely they will be able to easily break through above the maximum of 1.1250 and 1.1300. The British pound rose after a good report on manufacturing activity, but fell sharply at the end of the North American session, after it became known that the British Parliament rejected several alternative scenarios for Brexit. According to the data, the PMI Purchasing Managers Index for the UK manufacturing sector rose to 55.1 points in March, while it was projected at 50.9 points. In February, this index was 52.1 points. The material has been provided by InstaForex Company - www.instaforex.com |
| Analysis of EUR/USD divergence for April 2. The euro depreciated against the dollar slowly Posted: 02 Apr 2019 03:19 AM PDT 4h As seen on the 4-hour chart, the EUR/USD pair resumed the process of falling in the direction of the retracement level of 100.0% (1.1177). The rebound of the pair on April 2 from the Fibo level of 100.0% will allow traders to count on a turn in favor of the euro currency and some growth in the direction of the retracement level of 76.4% (1.1241). Today, emerging divergences are not observed in any indicator. Closing the pair below the Fibo level of 100.0% will increase the chances of a further fall in the direction of the next retracement level of 127.2% (1.1102). The Fibo grid is built on the grounds of extremums from March 7, 2019, and March 20, 2019. Daily As seen on the 24-hour chart, the pair consolidated below the Fibo level of 127.2% (1.1285), which allows traders to count on the continuation of the fall in the direction of the next retracement level of 161.8% (1.0941). Around this low, we can expect a reversal in favor of the euro and the resumption of growth. If there are no problems with its passage, then the chances of falling will increase. The Fibo grid is built on the grounds of extremums from November 7, 2017, and February 16, 2018. Trading recommendations: Buy deals on EUR/USD pair can be opened with the target at 1.1241 if the pair disconnects from the level of 100.0%. The stop-loss order should be placed below the level of 1.1177. Sell deals on EUR/USD pair can be opened with the target at 1.1102 if the pair closes below the retracement level of 100.0%. The stop-loss order should be placed above the level of 1.1177. The material has been provided by InstaForex Company - www.instaforex.com |
| Analysis of GBP/USD divergence for April 2. The pound "pulls" down again Posted: 02 Apr 2019 03:17 AM PDT 4h As seen on the 4-hour chart, the pair GBP/USD performed a reversal in favor of the American currency and consolidation below the Fibo level of 76.4% (1.3094). As a result, the process of falling quotations can be continued in the direction of the next retracement level of 61.8% (1.2969). On April 2, there is no indicator of emerging divergences on both charts. The new consolidation of the pair above the Fibo level of 76.4% will again work in favor of the British pound and the resumption of growth in the direction of the retracement level of 100.0% (1.300). The Fibo grid is built on extremes from September 20, 2018, and January 3, 2019. 1h As seen on the hourly chart, the pair reversed in favor of the US dollar and a fall to the retracement level of 76.4% (1.3061). The end of the pair of this level will allow traders to count on a turn in favor of the British currency and some growth in the direction of the Fibo level of 61.8% (1.3121). Closing the pair below the level of 76.4% will increase the likelihood of a further fall in the direction of the next retracement level of 100.0% (1.2961). The Fibo grid is built on extremes from March 11, 2019, and March 13, 2019. Trading advice: Buy deals on GBP/USD pair can be opened with the target at 1.3121 and a stop-loss order under the retracement level of 76.4% if the pair rebounds from the level of 1.3061 (hourly chart). Sell deals on GBP/USD pair can be opened with the target at 1.2961 and a stop-loss order above the level of 76.4% if the pair closes below the level of 1.3061 (hourly chart). The material has been provided by InstaForex Company - www.instaforex.com |
| Trading recommendations for the EURUSD currency pair - placement of trading orders (April 2) Posted: 02 Apr 2019 02:08 AM PDT For the last trading day, the euro / ollar currency pair showed low volatility of 46 points. However, it is worth paying tribute, and the direction remains unchanged. From the point of view of technical analysis, we have a stable downward movement. Yes, it is relatively not sharp, but the path from 1.1440 to 1.1195 speaks volumes. Traders and experts in some respects are inclined to think that there is some kind of accumulation due to general uncertainty and fear that the deal with Britain will end in a tough way out. Moreover, the market reaction will not be overwhelming. Then, there is such a move. Now, plunging tightly into the news and news background, we see that yesterday's regular meeting in the British Parliament, all alternative options for the Brexit deal were rejected. That one single script which received the most support from Kenneth Clarke's Conservative Party MP, was the one in which Britain retained membership in the customs union. A total of 273 deputies voted yes, while 276 were against it. However, this is not yet an enough justification for approval. You understand that Europe has already given its answer, that the concessions will not go and the time with England will be until April 12. Let them vote for what they want. The leader of the Liberal faction in the European Parliament (EP), Guy Verhofstadt, has already spoken regarding the current situation. Hard Brexit without a deal becomes almost inevitable. He also added the Britain only has one last chance to overcome the impasse, otherwise, the politician stressed, the UK will meet the abyss.
Today, in terms of the economic calendar , we are waiting for statistics on the United States regarding durable goods, and, of course, again the Brexit background, where, as Steven Barclay announced (Minister for Brexit UK), the members of the British Cabinet is scheduled to have a meeting which will allow them to discuss the possible options out of this situation. Further development Analyzing the current trading schedule, we see that the downward move resumed and the recent slowdown could be attributed to the regrouping of trading forces. It is likely to assume that the sellers are aimed at the level of 1.1180, which reflects the local minimum of March 7, as well as the section of the cluster on historical data. It is difficult to say how quotes will behave further; and for this reason, traders occupy a waiting position and monitor price fixing points. Based on the available data, it is possible to decompose a number of variations, let's consider them:
- We consider buying positions in the case of stagnation within 1.1180, where in the case of level processing, it will be possible to lay long positions. - It's too late to sell positions for sale, yet we are facing the same level of 1.1180, which many traders were aiming at. Now, the clear price fixing is worth analyzing which happens to be lower than 1.1180. In case of a breakdown, we can expect further descent to 1,1100-1,1000. Indicator Analysis Analyzing the different sector of timeframes (TF ), we can see that in the short, intraday and medium term, there is a downward interest against the general background of the market. Weekly volatility / Measurement of volatility: Month; Quarter; Year Measurement of volatility reflects the average daily fluctuation , with the calculation for the Month / Quarter / Year. (April 2 was based on the time of publication of the article) The current time volatility is 21 points. It is likely to assume that if the quote finds a foothold around the level of 1.1180, then the volatility will remain low. Key levels Zones of resistance: 1.1230 * 1.1300 **; 1.1440; 1.1550; 1.1650 *; 1.1720 **; 1.1850 **; 1.2100 Support areas: 1.1180; 1.1000 * Periodic level ** Range Level The material has been provided by InstaForex Company - www.instaforex.com |


| You are subscribed to email updates from Forex analysis review. To stop receiving these emails, you may unsubscribe now. | Email delivery powered by Google |
| Google, 1600 Amphitheatre Parkway, Mountain View, CA 94043, United States | |
No comments:
Post a Comment