Forex analysis review |
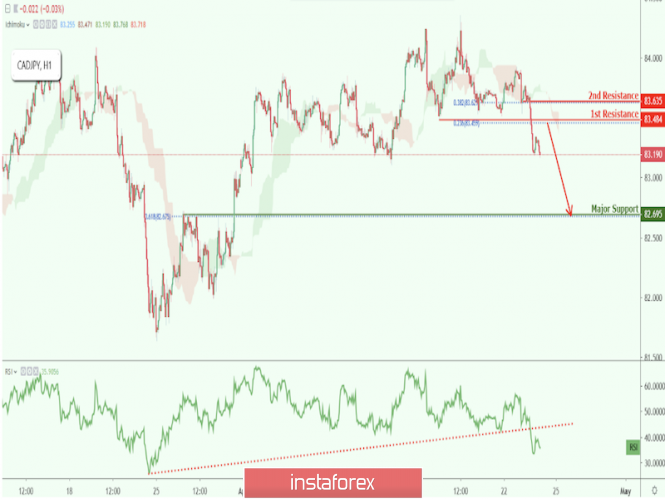
- CAD/JPY broke key support with strong bearish pressure from Ichimoku cloud, expect further drop!
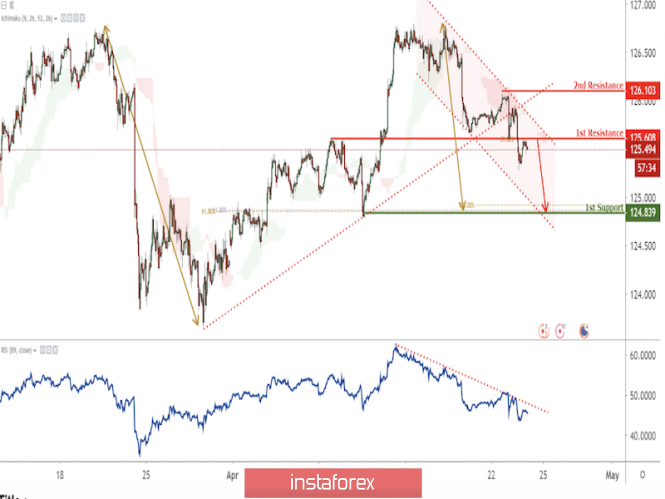
- EUR/JPY broke major support under bearish channel pressure!
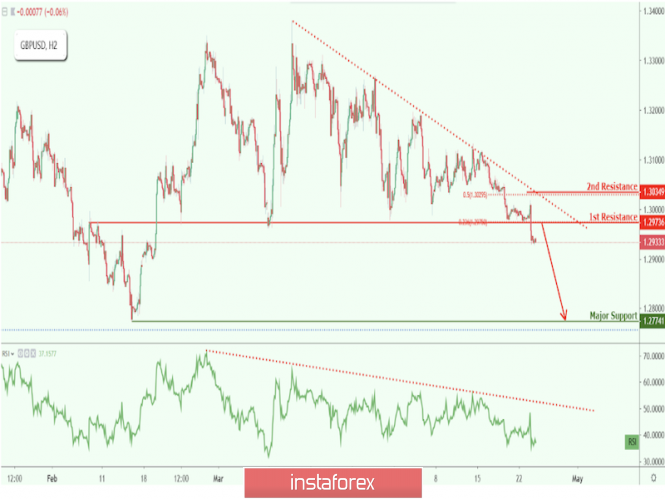
- GBP/USD facing strong bearish pressure after breaking key support, big upcoming drop!
- EUR/USD: The greenback made a comeback
- The US following China may surprise markets with unexpectedly high GDP growth in the first quarter
- GBP/USD. April 23rd. Results of the day. Brussels: there will be no revision of the Brexit agreement
- EUR/USD. April 23rd. Results of the day. The euro currency has once again dropped to 1,1200 and may rebound again
- USD/CHF. The franc drops to multi-year lows
- April 23 2019 : EUR/USD Intraday technical analysis and trade recommendations.
- April 23, 2019 : GBP/USD Intraday technical analysis and trade recommendations.
- Bitcoin analysis for April 23, 2019
- EUR./USD analysis for April 23, 2019
- Gold analysis for April 23, 2019
- GBP / USD plan for the American session on April 23. The pound remains in the channel but the bears prepares for a breakthrough
- EUR / USD plan for the US session on April 23. The situation has not changed but the probability of a decrease in the euro
- Brent got dope from Iran
- What is the dollar waiting for this week? The market is betting on growth
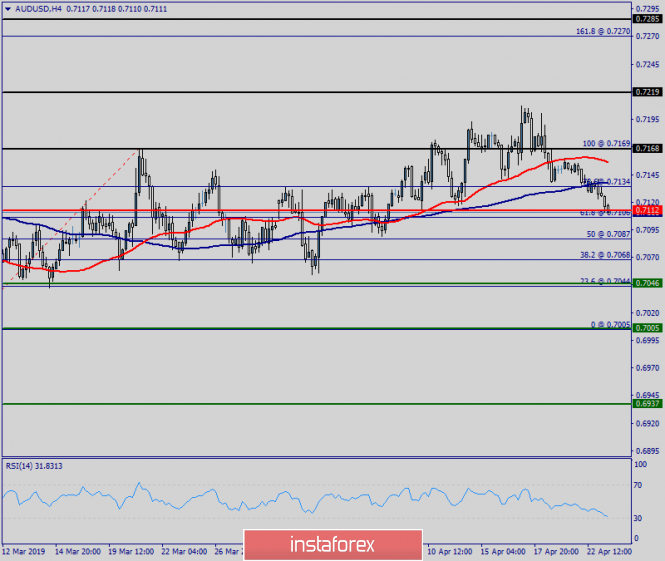
- Technical analysis of AUD/USD for April 23, 2019
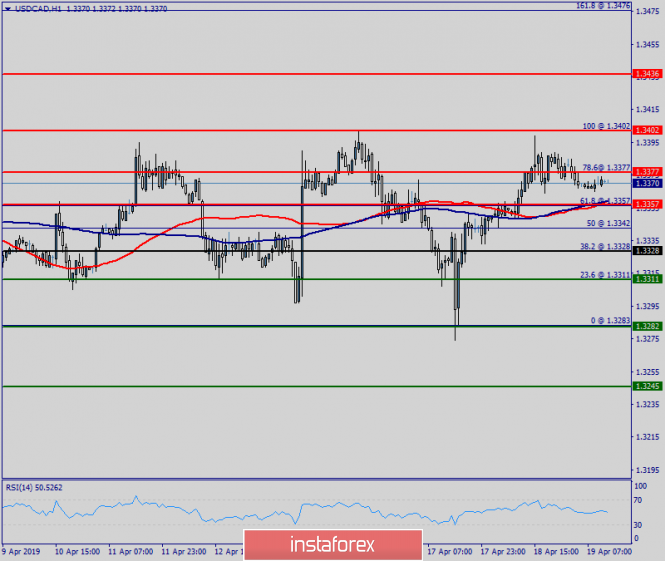
- Technical analysis of USD/CAD for April 23, 2019
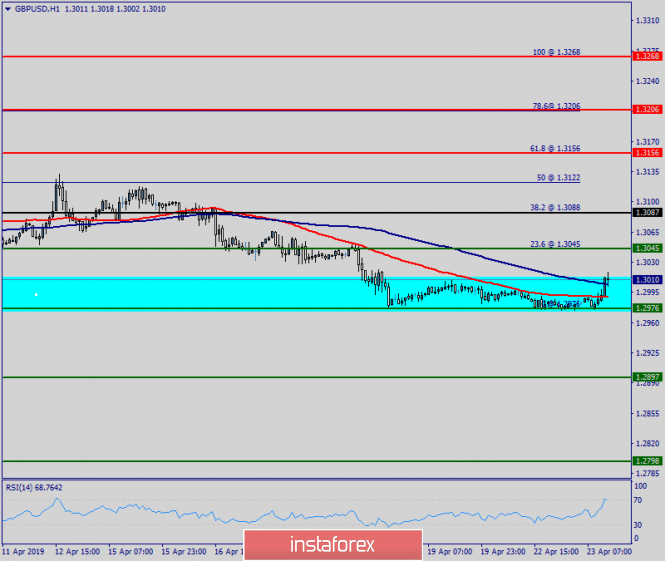
- Technical analysis of GBP/USD for April 23, 2019
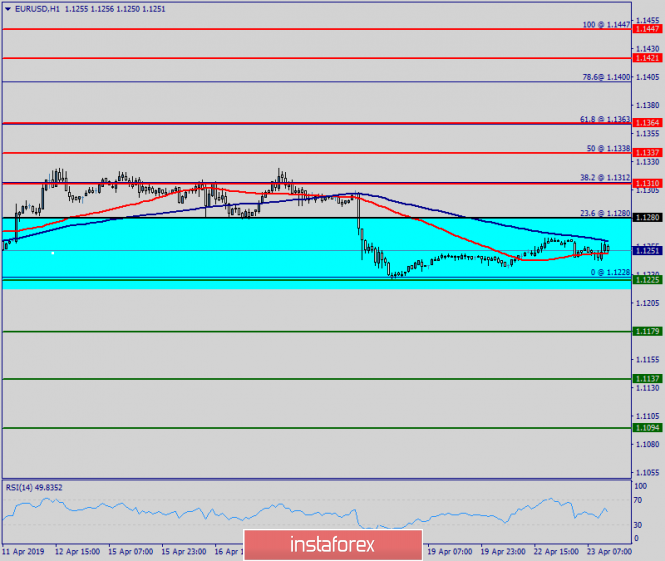
- Technical analysis of EUR/USD for April 23, 2019
- Selling of EUR/USD and AUD/USD pairs as the foreign exchange market continues to swing from side to side
- Barclays: Sanctions against Iran will support the rise in oil prices only in the short term
- Fundamental Analysis of EUR/JPY for April 23, 2019
- EUR/USD, GBP/USD, USD/JPY. Simplified wave analysis and forecast for April 23
| CAD/JPY broke key support with strong bearish pressure from Ichimoku cloud, expect further drop! Posted: 23 Apr 2019 07:46 PM PDT Entry : 83.48 Why it's good : horizontal pullback resistance, 23.6% fibonacci retracement Stop Loss : 83.63 Why it's good : horizontal pullback resistance, 38.2% fibonacci retracement Take Profit : 82.69 Why it's good : horizontal pullback support, 61.8% fibonacci retracement
|
| EUR/JPY broke major support under bearish channel pressure! Posted: 23 Apr 2019 07:40 PM PDT Entry : 125.60 Why it's good : horizontal overlap resistance, 23.6% fibonacci retracement Stop Loss : 126.10 Why it's good : horizontal swing high resistance, 50% fibonacci retracement Take Profit : 124.83 Why it's good : horizontal swing low support, 61.8% & 100% fibonacci extension, 61.8% fibonacci retracement
|
| GBP/USD facing strong bearish pressure after breaking key support, big upcoming drop! Posted: 23 Apr 2019 07:37 PM PDT Entry : 1.2973 Why it's good : horizontal overlap resistance, 23.6% fibonacci retracement, short term descending line Stop Loss : 1.30349 Why it's good : horizontal swing high resistance, 50% fibonacci retracement Take Profit : 1.2774 Why it's good : horizontal swing low support, 61.8% fibonacci retracement
|
| EUR/USD: The greenback made a comeback Posted: 23 Apr 2019 04:55 PM PDT The EUR/USD pair started a new trading week with moderate growth, but then it pulled back to the area of monthly lows after an unsuccessful attempt to stay above 1.1250. According to experts, the recent growth of EUR/USD was mainly due to a relaxed holiday atmosphere, but now the market is gradually returning to its normal operations, and its participants recall that the macroeconomic reality of the eurozone has not changed at all. Today, the EUR/USD pair has resumed its downward movement amid a recovery in the US dollar and the release of rather negative comments from ECB board member Benoit Coeur. In particular, the official expressed concern about the low level of inflation in the eurozone, which is observed against the background of fairly good growth rates of average wages. Separately, B. Coeur dwelled on the situation in the German economy, noting a stronger than previously expected slowdown in economic activity in this country. "Forecasts of the ECB provide for the acceleration of the growth rate of the economy of the currency bloc in the second half of the year, but this scenario is realized only in case of successful resolution of trade conflicts," he said. Recall that in March, the regulator downwardly revised it estimates of economic growth in the region for 2019 - from 1.7% to 1.1%. "Now the overall picture is more positive for the dollar than for the euro, given the divergence of macroeconomic indicators in the US and the eurozone," says Ulmer Leuchmann, an analyst at Commerzbank. Today, the USD index reached its highest level since March 11, amid rising US Treasury yields on the eve of weekly government auctions and corporate reporting in the United States. It should be noted that in reality, a currency revaluation occurs in anticipation of an increase in the interest rate by the central bank. However, if the Fed does not do this (even if the state of the US economy improves), then why should the dollar necessarily grow in the future? The main reasons for the stability of the greenback seem to lie in the problems of its main competitors. For the euro, it's the eurozone's weak beginning, for the pound sterling - the situation around Brexit, for the Japanese yen - the super-soft policy of the Bank of Japan because of the "unwillingness" of inflation to reach the target level. It is assumed that as a result of solving these problems, the position of the dollar may seriously deteriorate. In this regard, the potential of a downard hike of the EUR/USD seems limited. The material has been provided by InstaForex Company - www.instaforex.com |
| The US following China may surprise markets with unexpectedly high GDP growth in the first quarter Posted: 23 Apr 2019 04:43 PM PDT The latest temporary government shutdown, trade conflicts and a slowdown in global growth — against this background, the prospects for the first quarter for the US economy did not look promising. However, GDP data for the first three months of 2019 may surprise. After the Chinese economy unexpectedly grew during this period, it is expected that the United States will see a growth of 2.1 percent, although previously the range of analysts' estimates began from 1 percent. In the forecasts of the Atlanta Fed, the range is even more optimistic, between 2.2 and 3.4 percent. If recently most experts spoke about the weakness of the US economy, now they are expecting strong growth in the first quarter. In addition, companies have increased investment, in March, retail sales in the country grew at the fastest rate in 1.5 years - all opposed to the version of the beginning of a recession. The unexpected reduction in the US trade deficit in February is also evidence of higher growth rates, and only weak production volumes — recall the recent first quarterly decline in industrial output after the election of Donald Trump — can explain such a wide range of estimates. The material has been provided by InstaForex Company - www.instaforex.com |
| GBP/USD. April 23rd. Results of the day. Brussels: there will be no revision of the Brexit agreement Posted: 23 Apr 2019 04:31 PM PDT 4-hour timeframe The amplitude of the last 5 days (high-low): 58p - 38p - 74p - 29p - 23p. Average amplitude for the last 5 days: 44p (50p). On Tuesday, April 23, the British pound sterling fell by 60 points against the background of the overall strengthening of the US currency. Also, there was bad news for the pound sterling today. Bad, but expected. The European Commission today made a statement saying that the current version of the Brexit agreement is the best possible one. Therefore, there will be no revisions. Thus, the United Kingdom and Theresa May remain, in principle, in the same position as a few months ago. The government only needs to accept the option of an agreement by Theresa May, follow the path of a "hard" Brexit, or abandon it altogether with the use of a repeated referendum or without it. Now the UK has half a year to still take a majority of one of these options. For the pound sterling, this news, as well as the possible resignation of Theresa May, is a negative background. In principle, there can be no other background, given the entire political confusion in 2019. Thus, we still believe that the British pound has only one road – down. By the way, unlike the euro currency, the pound sterling has overcome an important support level of 1.3000 today, significantly increasing its chances for a further downward trend. Thus, the technique fully supports the continuation of the downward movement. No news from the UK or the USA is expected tomorrow, however, volatility may remain at today's level, amid the overcoming of the psychological level of 1.3000. Trading recommendations: The GBP/USD currency pair resumed its downward movement. Thus, short positions with targets at levels 1.2939 and 1.2889 are relevant at the moment. A reversal of the MACD indicator to the top will indicate a new round of correction. It is recommended to consider long positions not earlier than overcoming the Kijun-sen line with the goal of the Senkou Span B line. However, the bulls will obviously need serious fundamental support, which is not yet available. In addition to the technical picture should also take into account the fundamental data and the time of their release. Explanation of the illustration: Ichimoku indicator: Tenkan-sen - the red line. Kijun-sen - the blue line. Senkou Span A - light brown dotted line. Senkou Span B - light purple dotted line. Chikou Span - green line. Bollinger Bands indicator: 3 yellow lines. MACD Indicator: Red line and histogram with white bars in the indicator window. The material has been provided by InstaForex Company - www.instaforex.com |
| Posted: 23 Apr 2019 04:09 PM PDT 4-hour timeframe The amplitude of the last 5 days (high-low): 35p - 45p - 78p - 19p - 27p. Average amplitude for the last 5 days: 41p (40p). The EUR/USD pair ends the second trading day of the week with a downward movement of 40 points, although everything looks much more convincing in the illustration. However, in reality, even 40 points per day is quite a lot for the euro, considering the volatility of the previous two days (19 and 27 points). The strengthening of the dollar, therefore, can not even be called strong. That is, such a movement could have been triggered by 1-2 major players entry into the market. Given the fact that there were no significant macroeconomic publications today, and the growth in oil prices could not provoke a rise in the dollar against the euro, then most likely it was. From a technical point of view, the downward trend in the EUR/USD pair has been preserved, but it cannot be called an increase. The MACD indicator has turned down, indicating a resumption of the downward movement. However, most importantly, the pair has once again fulfilled the level of 1,1200 and again (!!!) could not overcome it. Thus, the probability of a price rebound from this level with the subsequent departure to the area of 13 and even 14 figures is very high. If the bears can still break this level then you can count on the continuation of the downward trend and increased movement. Tomorrow, by the way, there will again be no significant macroeconomic publications either in the EU or in the USA. Thus, the bears will have to try very hard to pass the level of 1,1200 without fundamental support. Most likely, a rebound from the indicated level will follow. Trading recommendations: The EUR/USD pair resumed its downward movement and completed the level of 1.1200. Most likely, there will be another rebound from this level, since the bears have no fundamental support. If this level is still passed, the targets for the shorts will be 1.1167 and 1.1162. Buy positions are recommended to be considered in small lots for a resistance level target of 1.1303 not earlier than when the price is consolidated above the Kijun-Sen line. In this case, the initiative will go into the hands of bulls for some time. In addition to the technical picture, one should also take into account the fundamental data and the time of their release. Explanation of the illustration: Ichimoku indicator: Tenkan-sen - the red line. Kijun-sen - the blue line. Senkou Span A - light brown dotted line. Senkou Span B - light purple dotted line. Chikou Span - green line. Bollinger Bands indicator: 3 yellow lines. MACD Indicator: Red line and histogram with white bars in the indicator window. The material has been provided by InstaForex Company - www.instaforex.com |
| USD/CHF. The franc drops to multi-year lows Posted: 23 Apr 2019 03:50 PM PDT Today, the US dollar is showing steady growth across the market amid favorable corporate reporting for the first quarter of this year. Such dynamics is reflected in all dollar pairs, but among them we can separately distinguish the USD/CHF. The weakness of the franc has been celebrated for more than a month. In early April, the greenback overcame the level of parity against the Swiss currency for the first time since January 2017. Today, the pair has updated a two-year high, jumping to the level of 1.0227. Such dynamics is caused not only by the revaluation of the US currency - the "chief" also becomes cheaper for its own reasons, which can be clearly seen from the dynamics of the EUR/CHF cross pair. As you know, the Swiss regulator often looks back on its European counterparts - the economic interrelation forces one to consider (or at least take into account) their maneuvers. For example, after easing the monetary policy of the ECB, the SNB decided to introduce a negative rate, subsequently reducing the list of so-called "beneficiaries." Now, when the European regulator actually announced its intention to start the reverse process (having completed QE and talking about the possibility of raising the rate next year), a similar reaction was expected from the SNB. But today the chairman of the central bank of Switzerland empathically and categorically rejected this opportunity. Thomas Jordan said that such a decision was dictated primarily by low inflation, which still cannot reach even the one percent mark. So, according to the latest data, the consumer price index in March rose to 0.7% in annual terms and to 0.5% on a monthly basis. The structure of the indicator suggests that a slight growth in inflation is due to the increase in prices for international tours and air travel. However, despite the positive dynamics, the rate of inflation growth looks extremely weak. For example, from May to October last year, the CPI fluctuated in the range of 1% -1.2% (y/y). Then the index began to gradually decline, and in January it reached a low of 0.6%. Therefore, an increase in the indicator to 0.7% cannot be considered a positive trend, since inflation is too far from its target level. In addition, there is still a negative gap between actual and potential production, while the Swiss franc remains "significantly overvalued." In other words, Jordan hinted rather transparently that in the foreseeable future the Swiss regulator is not going to follow the path of the ECB, nor, especially, the path of the Fed. Moreover, during his speech, the head of the SNB allowed further softening of the parameters of monetary policy. Firstly, we are talking about intervention in the foreign exchange market (to be applied with almost a 100% probability), , and secondly, about reducing the interest rate further into the negative area: Jordan did not rule out this option today. Indeed, according to the SNB representative, besides the problems voiced above, there are a few more. In particular, it is the low profitability of companies and the associated "caution in hiring new employees." Thus, the regulator conducts a causal relationship between the expensive franc, the profitability of enterprises, unemployment and consumer activity, which ultimately affects the dynamics of inflation. The similar rhetoric of the head of the SNB puts a lot of pressure on the franc. In addition, the demand for Swiss currency declined due to the risk-taking against the background of positive statistics from China and progress in trade negotiations between Beijing and Washington. Such a fundamental picture pushes the pair to new price highs - especially against the background of the growth of the US currency. In this context, Friday will play a special role for the USD/CHF pair. First, the United States will publish data on the growth of the American economy. In the 4th quarter of 2018, the GDP index reached 2.2% - and according to the forecasts of most experts, in the first quarter of this year the US economy will show a similar result. If the real figures do not coincide with the forecast, then the dollar will fall into the zone of price turbulence - especially if the result is higher than expected. In such a case, the rhetoric of Fed members may again become tougher. In addition, the head of the SNB, Thomas Jordan, will again speak on Friday - he will give a speech at the general meeting of shareholders of the central bank. If he confirms the intention to reduce the interest rate, the franc will receive another informational reason for further devaluation. From a technical point of view, the situation is as follows. The pair on all "higher" timeframes (from H4 and above) is on the top line of the Bollinger Bands indicator, which indicates the priority of an upward direction. On these timeframes, the Ichimoku indicator has formed a bullish "Parade of lines" signal. The strongest resistance level is at 1.0250 - this is the top line of the Bollinger Bands on the monthly chart. If the pair consolidates above it, then the probability of growth to multi-year high of 1.0350 will increase in many ways. The material has been provided by InstaForex Company - www.instaforex.com |
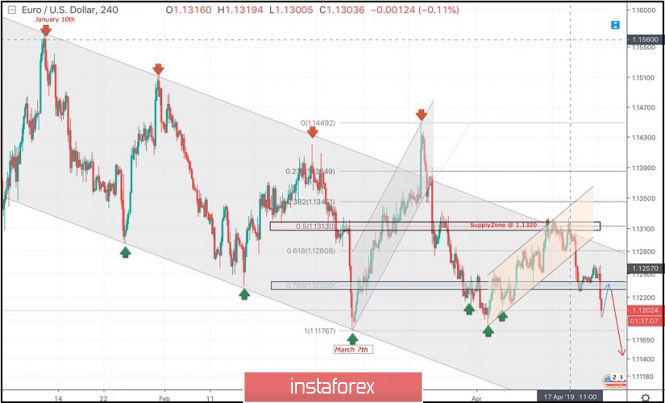
| April 23 2019 : EUR/USD Intraday technical analysis and trade recommendations. Posted: 23 Apr 2019 08:33 AM PDT
On January 10th, the market initiated the depicted bearish channel around 1.1570. Since then, the EURUSD pair has been moving within the depicted channel with slight bearish tendency. On March 7th, recent bearish movement was demonstrated towards 1.1175 (channel's lower limit) where significant bullish recovery was demonstrated. On March 18, a significant bullish attempt was executed above 1.1380 (the upper limit of the Highlighted-channel) demonstrating a false/temporary bullish breakout. On March 22, significant bearish pressure was demonstrated towards 1.1280 then 1.1220. Few weeks ago, a bullish Head and Shoulders reversal pattern was demonstrated around 1.1200. This enhanced further bullish advancement towards 1.1300-1.1315 (supply zone) where recent bearish rejection was being demonstrated. Short-term outlook turned to become bearish towards 1.1280 (61.8% Fibonacci) followed by further bearish decline towards 1.1235 (78.6% Fibonacci). For Intraday traders, the price zone around 1.1235 (78.6% Fibonacci) stood as a temporary demand area which paused the ongoing bearish momentum for a while before bearish breakdown could be executed today. Conservative traders should be waiting for a bullish pullback towards the newly-established supply zone around 1.1235 for a valid SELL entry. Moreover, bearish persistence below 1.1235 enhances further bearish decline towards 1.1170 then 1.1115. Trade recommendations : A valid SELL entry can be taken around 1.1235 when a bullish pullback occurs. TP levels to be located around 1.1170 and 1.1115. SL should be placed above 1.1260. The material has been provided by InstaForex Company - www.instaforex.com |
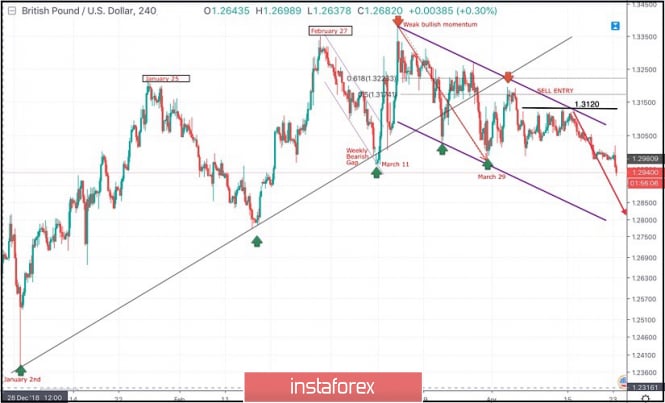
| April 23, 2019 : GBP/USD Intraday technical analysis and trade recommendations. Posted: 23 Apr 2019 08:16 AM PDT
On January 2nd, the market initiated the depicted uptrend line around 1.2380. A weekly bearish gap pushed the pair below the uptrend line (almost reaching 1.2960) before the bullish breakout above short-term bearish channel was achieved on March 11. Shortly after, the GBPUSD pair demonstrated weak bullish momentum towards 1.3200 then 1.3360 where the GBPUSD failed to achieve a higher high above the previous top achieved on February 27. Instead, the depicted recent bearish channel was established. Significant bearish pressure was demonstrated towards 1.3150 - 1.3120 where the depicted uptrend line failed to provide any bullish support leading to obvious bearish breakdown. On March 29, the price levels of 1.2980 (the lower limit of the depicted movement channel) demonstrated significant bullish rejection. This brought the GBPUSD pair again towards the price zone of (1.3160-1.3180) where the upper limit of the depicted bearish channel as well as the backside of the depicted uptrend line came to meet the pair. Bearish rejection was anticipated around the mentioned price levels (1.3150-1.3180). However, the GBPUSD bullish pullback failed to pursue towards the mentioned zone. Instead, significant bearish rejection was demonstrated earlier around the price level of 1.3120. Since then, Short-term outlook has turned into bearish towards 1.2900, 1.2850 then 1.2800 where the lower limit of the depicted channel comes to meet the GBPUSD pair. The material has been provided by InstaForex Company - www.instaforex.com |
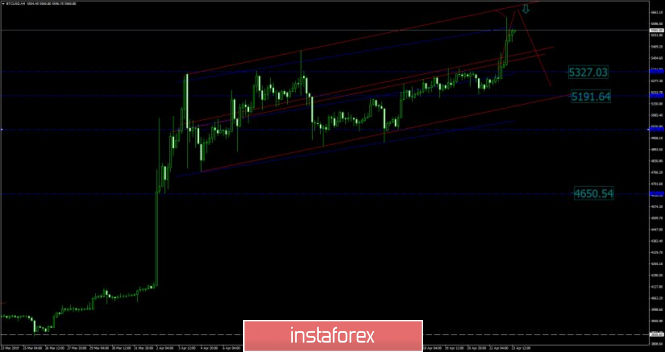
| Bitcoin analysis for April 23, 2019 Posted: 23 Apr 2019 06:36 AM PDT From America to the United Kingdom and from Russia to Australia, cryptocurrency taxation in major bitcoin strongholds is complicated. Contradictory or non-existent laws, excessive red tape, and maddeningly vague guidelines have conspired to make the tax-paying process more arduous than it need be. Now, a number of advocates are pushing for simplified crypto tax guidelines. Fixing the taxation will be main focus in the next period for cryptos. Technical picture:
According to the H4 time-frame, as we mentioned yesterday, the potential for bull move and re-test of upper channel diagonal was in the play and that exactly happened. Since the BTC is trading near the critical resistance at $5.700, our advice is to watch for potential reversal and confirmation of reversal. To confirm reversal, you want to see series of lower lows and lower highs. For now, buyers are in control and the next upward station is set at $5.700. In case of reversal, watch for supports at $5.327, $5.191 and $4.650. The material has been provided by InstaForex Company - www.instaforex.com |
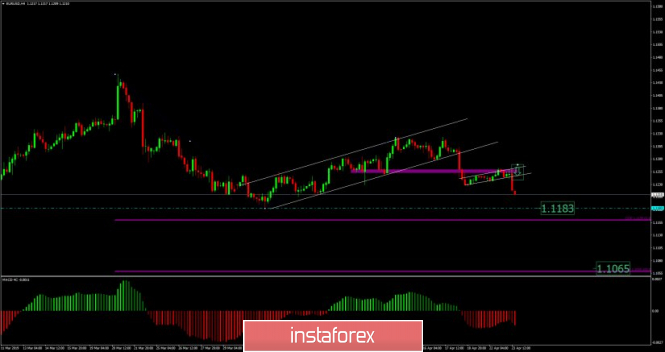
| EUR./USD analysis for April 23, 2019 Posted: 23 Apr 2019 06:25 AM PDT EUR/USD has been trading downwards as we expected. The price tested the level of 1.1210. Our short position on EUR/USD from yesterday is progressing good and we expect more downside.
According to the H4 time-frame, we found the successful breakout of the bearish flag pattern, which is sign of the professional re-selling. Key support is seen at the price of 1.1183 and you should watch to at least scale half of the position there. In case the EUR/USD breaks the level of 1.1183, watch for potential test of 1.1065 (Fibonacci expansion 100%). Our recommendation: We are bearish from 1.1230 with targets at 1.1183 and 1.1065. Protective stop is palced at 1.1280. The material has been provided by InstaForex Company - www.instaforex.com |
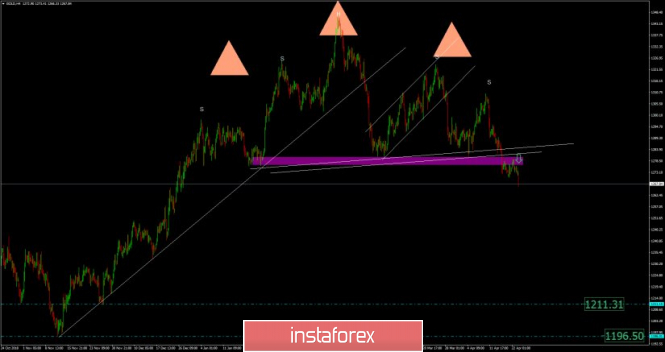
| Gold analysis for April 23, 2019 Posted: 23 Apr 2019 06:18 AM PDT Gold has been trading downwards as we expected. The price tested the level of $1.268.00. Our short position on Gold from yesterday is progressing good and we expect more downside.
According to the H4 time-frame, we found more acceptance below the key support cluster (purple rectangle) at the price of $1.280.00, which is sign that sellers are in big control on the Gold. The 4-month long complex head and shoulders is dominating the background that sellers are very active on the Gold. As long as the Gold is trading below the $1.315.00, we will be bearish. Our recommendation: We are bearish from yesterday at $1.275.00 but we will add after every decent upward correction structure more selling position. Our advice is to watch for selling positions only. The downward targets are set at $1.211.30 and $1.196.50. The material has been provided by InstaForex Company - www.instaforex.com |
| Posted: 23 Apr 2019 06:18 AM PDT To open long positions on the GBP / USD pair, you need: Buyers showed themselves after the test of support at 1.2977, to which I paid attention in my morning review. This led to a large upward rebound of the pair and the test of resistance at 1.3009, which limits the further upward potential of the pound. A breakthrough of this range will open up the opportunity for an upward correction in the area of 1.3036 and 1.3065, where I recommend taking profits. Under the scenario of a retracement of GBP/USD pair to the lower border of the side channel 1.2977, long pound positions are best postponed until new lows of 1.2940 and 1.2909 are updated. To open short positions on the GBP / USD pair, you need: The bears did not cope with the task for the first half of the day and failed to break below the support of 1.2977. The main goal is to break through and consolidate below this range, which will lead to the renewal of new local minima near 1.2940 and 1.2909, where I recommend taking profits. So far, the sellers have managed only to form a false breakdown in the area of resistance 1.3009 but there is no pressure on the pound. In case that the price returned at 1.3009, short positions are best deferred until the highs of 1.3036 and 1.3065 are updated. Indicator signals: Moving averages Trading is conducted above 30 and 50 moving averages, which indicates a possible continuation of the formation of a bullish correction. Bollinger bands The volatility of the Bollinger Bands indicator is very low, which does not give signals to enter the market. Description of indicators MA (moving average) 50 days - yellow MA (moving average) 30 days - green MACD: fast EMA 12, slow EMA 26, SMA 9 Bollinger Bands 20 The material has been provided by InstaForex Company - www.instaforex.com |
| Posted: 23 Apr 2019 06:12 AM PDT To open long positions on EUR / USD pair, you need: Buyers kept the morning support level, which is now seen in the area of 1.1244. However, it is necessary to break through the resistance of 1.1262 in order to continue the upward trend in the euro. This will lead to the renewal of the highs in the area of 1.1282 and 1.1301, where I recommend taking profits. Good fundamental data on the US economy can put pressure on the pair, hence, when you return in the afternoon to the level of 1.1244 to long positions, it is best to look at the rebound from a minimum of 1.1223. To open short positions on EUR / USD pair, you need: The bears could not get through the support level of 1.1247 from the first time, which has shifted slightly and currently in the area of 1.1244. A breakthrough will lead to profit taking in long positions and a decrease in EUR/USD in the area of minimum at 1.1223 and 1.1206, where I recommend taking profits. If the upward correction continues, short positions can return to the false breakdown from the upper border of the side channel at 1.1262 or to the rebound from the large maximum 1.1282. Indicator signals: Moving averages Trade is conducted in the region of 30 and 50 moving averages, which indicates the lateral nature of the market. Bollinger bands The volatility of the Bollinger Bands indicator is very low, which does not give signals to enter the market. Description of indicators MA (moving average) 50 days - yellow MA (moving average) 30 days - green MACD: fast EMA 12, slow EMA 26, SMA 9 Bollinger Bands 20 The material has been provided by InstaForex Company - www.instaforex.com |
| Posted: 23 Apr 2019 06:00 AM PDT To say that the news about the fact that Washington completed the grace period for buyers of Iranian oil has disturbed the financial markets - not to say anything. The counterparties of Tehran seriously counted on its prolongation, perhaps with some reduction in quotas but a total ban drove the "bears" on Brent and WTI into a stupor. Black gold jumped almost to the semi-annual maxim amid fears of supply disruptions and growing global demand. Confidence of Donald Trump that the United States, Saudi Arabia, and the United Arab Emirates will be able to close the gap will keep the steadily upward movement of oil. Before the imposition of sanctions last year, Iran was the fourth OPEC producer with a production volume of 4 million b/d. According to estimates by consulting company FGE Energy, the figure fell to 2.5 million b/s and exports to 1-1.3 million b/d to date. However, there is an opinion on the market taking into account illegal shipments, their total volume abroad is about 1.9 million b/s. The lion's part falls on China, Turkey, India, Japan, and South Korea. The first two states have already expressed dissatisfaction with the abolition of the grace period. Washington warned buyers about sanctions against them in case of refusal to reduce the export of Iranian oil to zero. In this situation, everything depends on Tehran, which must abandon its nuclear program. Iranian oil exports According to Goldman Sachs, the take-off of Brent and WTI quotes is associated with a surprise effect, while the emergency reserve capacity of Saudi Arabia, OEA and Russia is estimated to be at 2 million b/s and can increase to 2.5 million b/ s in 2020. This is more than required to close the gap, which will arise as a result of the reduction of Iranian exports around 1 million b/s. The bank predicts that the North Sea variety will stabilize in the range of $70-75 per barrel in the near future. The decision of Donald Trump really looks like a surprise because he was already taking a tough stance on Iran in 2018. However, it softened due to the negative consequences for the US economy of rising prices for black gold. Will the White House master back down from his plans this time too? This would have been a catastrophe for the "bulls" in Brent and WTI, which increased the long positions in oil and oil products by 564 million barrels in equivalent for 14 weeks in a row, which is one of the longest rally figures for the entire history of accounting. Therefore, it is quite possible that Trump hopes to bring differences to the ranks of OPEC and other producing countries. Russia is already faced with a choice, whether to lose its market share or withdraw from the contract to reduce production. Further price increases will increase the risk of terminating the agreement, which will be a strong argument for selling oil. A technically confident breakthrough of resistance at $72.75 per barrel (61.8% of the CD wave) as part of the transformation of the Shark pattern at 5-0 increased the risks of continuing the northern rally of the North Sea variety to $78.95. The level of $72.75 becomes important to support while Brent quotes are above it, the bulls control the market situation. Brent daily chart |
| What is the dollar waiting for this week? The market is betting on growth Posted: 23 Apr 2019 05:10 AM PDT
On Tuesday, the dollar returned to growth against a basket of major currencies, the Canadian dollar continues to receive support from rising oil prices after the US decision to tighten restrictions on exports of Iranian oil from next month. The data showed that home sales in the secondary housing market in the US declined in March more than expected due to limited supply, and data on new home sales will be published later. Of course, they can give some guidance on the state of the US economy, but a clearer picture should appear on Friday after the publication of the GDP report. Investors should expect an increase in volatility in the coming days, when traders will return to work after the holidays and if US GDP will grow. This week may be convincing evidence that a reversal towards the "dovish policy" from leading central banks, and in particular from the Fed, was enough to change the dynamics of global growth. As for the dollar, there is currently no reason for a serious fall. The recent strengthening of the yen against the dollar will be temporary, and as long as central banks around the world refrain from normalizing politics by raising interest rates, the dollar will feel more than confident. The current "dovish" tone of the regulators supports risky assets, and this support will continue until major Central banks take action to normalize monetary policy. |
| Technical analysis of AUD/USD for April 23, 2019 Posted: 23 Apr 2019 04:04 AM PDT The AUD/USD pair is set above strong support at the levels of 0.7046 and 0.7168. This support has been rejected four times confirming the uptrend. The major support is seen at the level of 0.7046, because the trend is still showing strength above it. Accordingly, the pair is still in the uptrend in the area of 0.7046 and 0.7168. The AUD/USD pair is trading in the bullish trend from the last support line of 0.7112 towards thae first resistance level of 0.7168 in order to test it. This is confirmed by the RSI indicator signaling that we are still in the bullish trending market. Now, the pair is likely to begin an ascending movement to the point of 0.7168 and further to the level of 0.7290. The level of 0.7389 will act as the major resistance and the double top is already set at the point of 0.7389. At the same time, if there is a breakout at the support levels of 0.7112 and 0.7046, this scenario may be invalidated. The material has been provided by InstaForex Company - www.instaforex.com |
| Technical analysis of USD/CAD for April 23, 2019 Posted: 23 Apr 2019 03:49 AM PDT |
| Technical analysis of GBP/USD for April 23, 2019 Posted: 23 Apr 2019 03:47 AM PDT Overview: The GBP/USD pair continues to move upwards from the level of 1.3087. Last week, the pair rose from the level of 1.3087 to a top around 1.3201 but it rebounded to set around the spot of 1.3140. Today, the first resistance level is seen at 1.3206 followed by 1.3268 , while daily support 1 is seen at 1.3087 (38.2% Fibonacci retracement). According to the previous events, the GBP/USD pair is still moving between the levels of 1.3087 and 1.3268; so we expect a range of 181 pips in coming days. Furthermore, if the trend is able to break out through the first resistance level at 1.3206, we should see the pair climbing towards the double top (1.3268) to test it. Therefore, buy above the level of 1.3087 with the first target at 1.3206 in order to test the daily resistance 1 and further to 1.3268. Also, it might be noted that the level of 1.3268 is a good place to take profit because it will form a double top. On the other hand, in case a reversal takes place and the GBP/USD pair breaks through the support level of 1.3087, a further decline to 1.2976 can occur which would indicate a bearish market. The material has been provided by InstaForex Company - www.instaforex.com |
| Technical analysis of EUR/USD for April 23, 2019 Posted: 23 Apr 2019 03:36 AM PDT The EUR/USD pair continues to move downwards from the level of 1.1280. Yesterday, the pair dropped from the level of 1.1280 to the bottom around 1.1225. Today, the first resistance level is seen at 1.1280 followed by 1.1310, while daily support 1 is seen at 1.1179. According to the previous events, the EUR/USD pair is still moving between the levels of 1.1280 and 1.1180; for that we expect a range of 102 pips. If the EUR/USD pair fails to break through the resistance level of 1.1280, the market will decline further to 1.1179. This would suggest a bearish market because the RSI indicator is still in a positive area and does not show any trend-reversal signs. The pair is expected to drop lower towards at least 1.1137 with a view to test the second support. On the other hand, if a breakout takes place at the resistance level of 1.1280 (the double top), then this scenario may become invalidated. The material has been provided by InstaForex Company - www.instaforex.com |
| Posted: 23 Apr 2019 03:26 AM PDT The foreign exchange market continues to be characterized by an unconventional extremely low activity and accompanied by the same low volatility. We have repeatedly pointed out earlier that the uncertainty caused by the actions of the world's largest central banks led by the Fed, regarding the prospects for monetary policy which resulted to a significant decrease in investor activity on the Forex market. But in the past few months, the US stock market has been growing uncontrollably in the wake of the "buybacks" of the largest industry giants and the unstoppable growth of stock indices. All of these also happen against the background of a directly proportional fall in market volumes. It seems that the owners of these companies are still using the possibilities of high and sufficiently cheap liquidity to repurchase shares of their companies under conditions of uncertainty and low market volumes. It seems that the owners of these companies are still using the possibilities of high and sufficiently cheap liquidity to repurchase shares of their companies under conditions of uncertainty and low market volumes. Looking back to the likely actions of the Fed, its May meeting will be important for understanding possible further actions by the American regulator as we see it. After the collapse of the local stock market at the end of last year, the Central Bank abruptly changed its view of the course of monetary policy and made it clear that it was a wait-and-see attitude earlier this year. At the March meeting, he confirmed his tactical plans and now, from its May meeting, investors are already waiting for some real action while hoping that the regulator will nevertheless take a final decision on the prospective reduction of interest rates in order to maintain the demand for US assets. Yet, so far, the market has no firm conviction that this is exactly what the bank will do, which is why there is a drop in market volumes with a simultaneous strong decrease in volatility. Given this state of affairs, we believe that the overall lateral dynamics in the main currency pairs will continue at least until the Fed's monetary policy meeting. Forecast of the day: The EUR/USD pair continues to drift down, remaining in the lateral range generally. If the price holds below the level of 1.1245, it can continue falling to 1.1225 and then to 1.1210. The AUD/USD pair is likely to continue its local decline in the prospects for an increase in RBA interest rates. We consider it possible to sell the pair with promising targets of 0.7090 and 0.7070. |
| Barclays: Sanctions against Iran will support the rise in oil prices only in the short term Posted: 23 Apr 2019 02:24 AM PDT Increased US sanctions aimed at maximizing the export of Iranian oil, which of course, significantly reduce the oil market in the short term. However, it is unlikely to have a big impact on prices over a longer period, according to a statement by Barclays experts. Washington demanded that the remaining buyers of Iranian oil stop buying by May 1 or they will face sanctions. The decision to completely cut off Tehran's oil revenues resulted in oil prices reaching six-month highs due to fears of a possible reduction in supply. "This step subjects to essential risk for our current forecast of the average price of Brent oil this year, which assumes cost at the level of 70 dollars per barrel in comparison with the average index at the level of 65 dollars per barrel, but it does not, in our opinion, exert a substantial influence on the long-term price formation", they stated in Barclays. However, even with the fact that Saudi Arabia, the United Arab Emirates and other members of the Organization of Petroleum Exporting Countries are likely to fill the supply gap created after tightening US sanctions, the bank expects Riyadh to take time to adapt to changes on the market and build a scheme that will help avoid cuts in supply. Barclays also said that the US decision increased the risk of conflict in the Middle East including the potential closure of the strategic Strait of Hormuz. According to the bank, the reaction of key consumers of Iranian oil, particularly China and India, will also be of key importance since it may be problematic for them to completely refuse from these supplies. |
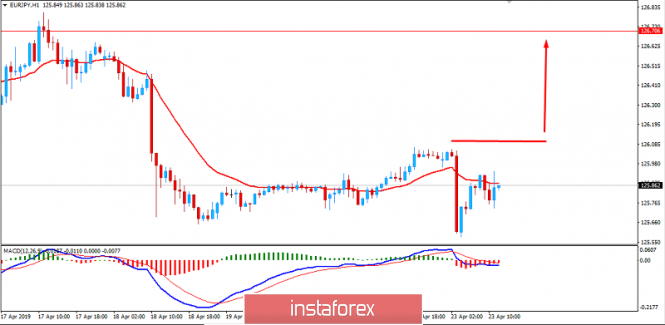
| Fundamental Analysis of EUR/JPY for April 23, 2019 Posted: 23 Apr 2019 02:18 AM PDT EUR/JPY has been making corrections amid indecisive market sentiment. The price is epected to extend a climb higher in the short term. The eurozone is facing an economic slowdown. Besides, Brexit is a source of persistent uncertainty. The ZEW economic sentiment survey of Germany, which is a key gauge of investor confidence, revealed a bounce of the index last week which stuck on a negative territory for the past 12 months. The economic sentiment index climbed into positive territory in April 2019. The Eurozone ZEW indicator also surged to 4.5 from -2.5 which is also a strong dynamic. In the last policy meeting, the ECB stated that its main focus would be to ensure the continued consumer inflation slightly below 2% over the medium term. The leading indicator would be important to investors to measure the market sentiment. Euro area's real Gross Domestic Product rose by 0.2%, in the fourth quarter of 2018, following an increase of 0.1% in Q3. Annual HICP inflation decreased to 1.4% in March 2019 while the manufacturing sector remains feeble due to weak external demand. The annual growth rate of loans to non-financial corporations recovered to 3.7% in February 2019. Last Week, the Consumer Price Index remained unchanged at 1.4% along with the Core CPI at 0.8%. The French Flash Service PMI also rose from 49.1 to 50.5 while the German Flash Manufacturing PMI dropped to 44.5 from the expectated 45.2. The main focus for this week will be the Spanish Unemployment rate which is expected to be unchanged at 14.5%. On the JPY side, today BOJ Core CPI report was published with an uptick to 0.5% as expected from the previous value of 0.4%. The Bank of Japan is likely to keep the key policy rate steady at -0.10% at the nearest policy meeting this week. Ahead of BOJ Outlook report and Monetary Policy Statement, JPY could lose momentum as the domestic economy has been affected by a global slowdown. Besides, the government is going to impose a tax hike to spur consumer spending and retail sales. Moreover, the Bank of Japan is ready to ramp up stimulus which will include a range of measures if the economy loses momentum. The regulator aims to hit a 2% inflation target. Any further step on this will affect both the domestic economy and the banking system. According to Maeda, if the economy's momentum for achieving its inflation target is threatened, the central bank will ease monetary policy. Meanwhile, EUR has been weighed down by economic and political issues. JPY is indecisive and shaky as the BOJ chases the inflation target rather than tackles economic challenges. This takes the shine off JPY. So, EUR is holding the upper hand over JPY in the coming days. Now let us look at the technical view. The price is currently trading above 125.50 area under strong impulsive bullish pressure that could lead to further upside momentum. For better confirmation, a daily close above 126.00 is required. If the price manages to break above 126.00 area with a daily close, it is expected to climb higher towards 127.00 and later towards 128.50 resistance area in the future.
|
| EUR/USD, GBP/USD, USD/JPY. Simplified wave analysis and forecast for April 23 Posted: 23 Apr 2019 01:57 AM PDT EUR/USD The downward wave model of March 20 is developing on the euro chart. It corrects the area of the bullish trend, so the potential for decline is expected to be small. In the structure, an intermediate rollback is formed within the framework of the final part (C). Forecast: The forthcoming price move up is estimated in the range of the price chart. A short-term decline is expected in the morning. A breakthrough of the lower limit of the support zone is unlikely. The growth phase can be expected at the end of the day or tomorrow. Recommendations: In the area of settlement support, supporters of short-term intraday transactions can look for signals to buy a pair. It is necessary to take into account the correctional nature of the entire rise. For longer trading, you need to wait for the completion of the price rise and look for signals to sell the instrument. Resistance zones: - 1.1295 / 1.1325 Support zones: - 1.1230 / 1.1200 GBP/USD As seen on the chart of the pair in the last month, the price moves mainly sideways, forming a bearish wave of correction. The final part (C) is not enough to complete the whole structure. In its framework, since the end of last week, an intermediate rollback has been developing. Forecast: The internal structure of the current rise in recent days indicates the upcoming price spurt up. The potential for growth is expected no further than the daily average of the pair. Then you can count on a repeated decline. Recommendations: Purchases can be recommended only to supporters of intrasessional trade. It is safer to wait out the rollback phase and look for short-trade entry signals in the area of the resistance zone. Resistance zones: - 1.3030 / 1.3060 Support zones: - 1.2980 / 1.2950 USD/JPY As seen on the H1 chart, the upward wave of March 25 is not over. It forms the last part in a larger-scale bullish construction. Intermediate downward rollback completed. The wave structure lacks a final price spurt upward. Forecast: The chart has all the conditions for the beginning of the active phase of growth. The price rise that began in the Asian session has a reversal potential. In the next session, there is a high probability of a repeated rollback down Recommendations: Sales in the coming days are becoming irrelevant. When the price approaches the support zone, it is recommended to monitor the signals of buying the pair. The nearest resistance zone can limit the daily range of the pair. Resistance zones: - 112.90 / 113.20 - 112.00 / 112.30 Support zones: - 111.70 / 111.40 Explanations for the figures: Waves in the simplified wave analysis consist of 3 parts (A – B – C). The last unfinished wave is analyzed. Zones show areas with the highest probability of reversal. The arrows indicate the wave marking according to the method used by the author, the solid background is the formed structure, the dotted ones are the expected movements. Note: The wave algorithm does not take into account the duration of tool movements over time. The material has been provided by InstaForex Company - www.instaforex.com |
| You are subscribed to email updates from Forex analysis review. To stop receiving these emails, you may unsubscribe now. | Email delivery powered by Google |
| Google, 1600 Amphitheatre Parkway, Mountain View, CA 94043, United States | |


No comments:
Post a Comment