Forex analysis review |
- EUR/USD testing key resistance, potential reversal!
- NZD/USD is approaching a nice pullback resistance, potential reversal to occur!
- USD/JPY Approaching Support, Prepare For A Bounce
- EUR/USD. Bullish counterattack: ahead - a key resistance level of 1.1240
- The pound could lose its reserve currency status due to Brexit
- What to expect from the dollar this week: the Fed can provide a hint
- The dollar rally has stopped, further predictions contradict each other
- The euro can still drop to $1.105
- #CL. April 29th. Oil can end the correction in the coming days
- EUR/USD. April 29th. Results of the day. Macroeconomic reports did not cause a reaction, the pair stands still
- GBP/USD. April 29th. Results of the day. Michel Barnier is waiting for the results of the negotiations between May and Labour
- USD/CAD. Buy but be careful: the price "ceiling" - 1.3610
- Short-term technical analysis of EURUSD for April 29, 2019
- Technical analysis of Gold for April 29, 2019
- April 29, 2019 : GBP/USD Intraday technical analysis and trade recommendations.
- April 29, 2019 : EUR/USD Intraday technical analysis and trade recommendations.
- EUR./USD analysis for April 29, 2019
- Analysis of Gold for April 29, 2019
- Bitcoin analysis for April 29, 2019
- EURUSD: Eurozone lending slowed, consumer and company confidence declined
- GBP / USD: plan for the American session on April 29. Buyers failed to continue upward correction, but the chance for growth
- EUR / USD: plan for the US session on April 29. Trade has moved to a narrow side channel
- BITCOIN Analysis for April 29, 2019
- Yen recalls flash crash
- Fundamental Analysis of USDJPY for April 29, 2019
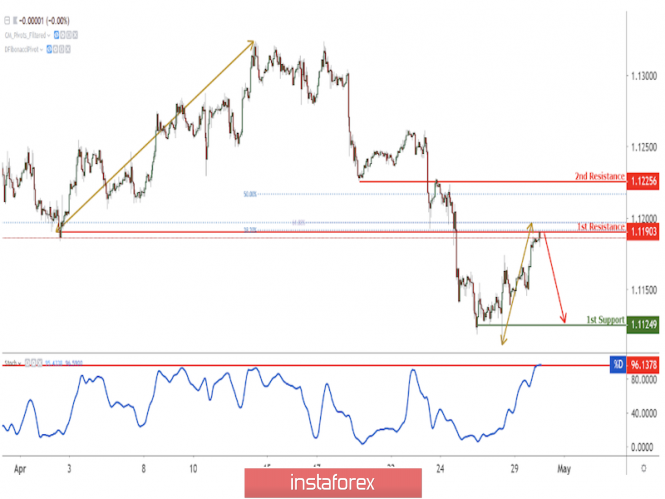
| EUR/USD testing key resistance, potential reversal! Posted: 29 Apr 2019 07:22 PM PDT Price is facing bearish pressure from our first resistance where we can expect a drop below this level to our first support level. Stochastic is approaching resistance as well. Entry : 1.1190 Why it's good : horizontal pullback resistance, 23.6%, 38.2% fibonacci retracement, 61.8% Fibonacci extension Stop Loss : 1.1225 Why it's good : horizontal overlap resistance, 50% fibonacci retracement Take Profit : 1.1124 Why it's good : horizontal swing low support
|
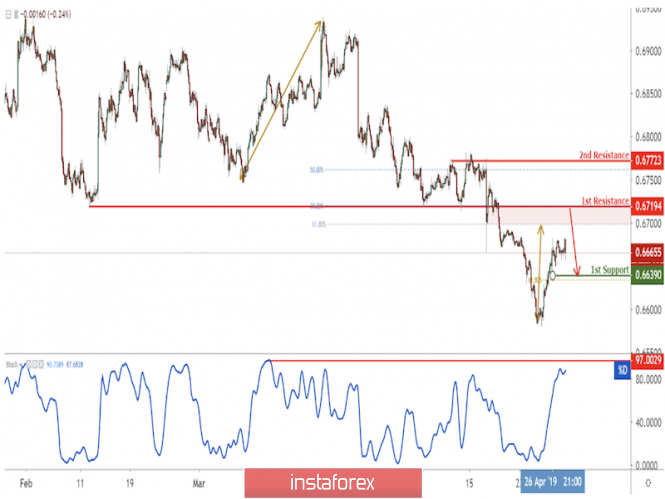
| NZD/USD is approaching a nice pullback resistance, potential reversal to occur! Posted: 29 Apr 2019 07:20 PM PDT Price is approaching a key resistance at 0.6719 where it could potentially reverse to its support. Entry : 0.6719 Why it's good : horizontal pullback support, 38.2% fibonacci retracement, 61.8% fibonacci extension Stop Loss : 0.67772 Why it's good : 50% Fibonacci retracement Take Profit : 0.6639 Why it's good : 61.8% fibonacci retracement
|
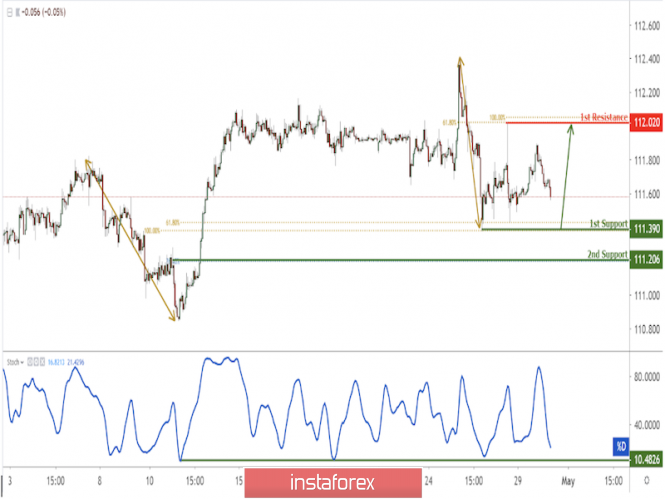
| USD/JPY Approaching Support, Prepare For A Bounce Posted: 29 Apr 2019 07:14 PM PDT Price is approaching first support where we are expecting a bounce from this level. Entry : 111.390 Why it's good : horizontal swing low support,61.8% fibonacci retracement, 100% Fibonacci extension Stop Loss : 111.206 Why it's good :76.4% fibonacci retracement, horizontal pullback support Take Profit : 112.020 Why it's good : horizontal swing high resistance, 61.8% fibonacci retracement.100% Fibonacci extension
|
| EUR/USD. Bullish counterattack: ahead - a key resistance level of 1.1240 Posted: 29 Apr 2019 04:10 PM PDT On the first trading day of the week, the euro-dollar pair continued to drift around the middle of the 11th figure. Both the bulls and the bears of the pair could not win over the majority of market participants - the controversial US data has once again messed things up. By and large, the situation on Friday was repeated today, when an extremely weak report on the growth of the price index of GDP offset optimism about the growth of the US economy as a whole. Today, a mirror situation occurred: the PCE base price index showed a negative trend, while personal spending unexpectedly rose. Such a kind of "balance" did not allow EUR/USD buyers to approach an important resistance level of 1.1240, the overcoming of which would finally dampen last week's downward momentum. But if we consider the situation within the day, the bulls still managed to maintain their advantage. This is understandable: after all, in the run-up to the Fed's May meeting, inflation rates one after another show a negative result. At the end of last week, the market turned its attention to the inflation component of US GDP. It is believed that this indicator is monitored by the Fed "with a special inclination" (like the PCE price index), therefore its negative dynamics largely offset the positive from the Friday release. The indicator came out at the level of 0.9%, although experts expected growth to 1.3 from the previous mark of 1.7%. It is worth recalling that the basic inflation rate also disappointed traders - consumer prices, excluding food and energy prices, increased by only 0.1% in March after a weak growth of 0.2% in February. In annual terms, the consumer price index rose by only two percent. Although annual inflation is still at fairly high levels, a negative trend could alert the members of the regulator. Thus, on the eve of the next Fed meeting, the fundamental picture emerges quite clearly: amid the growth of most of the US macroeconomic indicators, inflation indicators slowly but surely slide downwards. Therefore, today's release, despite all its ambiguity, was perceived negatively by the market. Buyers used this informational occasion and updated this week's high (1.1180). However, despite the correctional growth, the pair is still within the downward trend - and will remain until it consolidates above the Bollinger Bands average line on the daily chart. On Tuesday - the last day of April - the EUR/USD bulls will have a chance to consolidate their success - and not only due to the possible weakness of US data. First, on April 30, data on the growth of the eurozone's GDP will be published, secondly, the level of European unemployment, and thirdly, data on the growth of German inflation. The growth rate of the European economy should accelerate to 0.3% (on a monthly basis) and to 1.2% - in annual terms. The unemployment rate is likely to remain at a record-low of 7.8%, providing traditional support for the euro. Good news is also expected from Germany: the German consumer price index should grow both in the monthly (+0.5%) and annual (+1.5%) terms. If such data are released at least at the forecast level (not to mention the stronger dynamics), the single currency will receive a reason for growth throughout the market, including the EUR/USD. The US session on Tuesday is also eventful. First of all, it is necessary to pay attention to the labor cost index - according to some analysts, this is one of the "favorite" Fed inflation indicators. In the 4th quarter of last year, it fell slightly (to 0.7%), and in the first quarter of this year, a further decline is expected - to 0.6%. This indicator makes it possible for us to estimate the growth rate of wages in the United States and, accordingly, is a good indicator of inflationary pressure in the country. If it is disappointing (and even if it reaches the forecast level), investor concern about the reaction of Fed members will only increase. In addition, an indicator of US consumer confidence will be released tomorrow. In March, it dropped sharply - from 131 points to 124th. The April results may also disappoint investors - according to preliminary data, the indicator will drop to 122 points. This fact in itself is not critical - however, in the context of other US releases, it can cause an extremely negative market reaction. Thus, according to preliminary experts' forecasts, tomorrow's releases will be of multi-polar character - European statistics should support the euro, and the US will "drown" the dollar. If the real numbers coincide with the forecasts, the EUR/USD pair's correction will continue. In a technical perspective, buyers of EUR/USD need to gain a foothold above the resistance level of 1.1240. At this price point, not only is the Bollinger Bands midline is drawn on the daily chart, but also the Tenkan-sen and Kijun-sen lines. If the bulls overcome this target, they can count on a return to the area of the 13th figure. Otherwise, the bears will return the price to the bottom of the 11th level. The material has been provided by InstaForex Company - www.instaforex.com |
| The pound could lose its reserve currency status due to Brexit Posted: 29 Apr 2019 04:10 PM PDT Brexit could shake the pound sterling's status as a global reserve currency. This is evidenced by the results of a survey conducted recently by the Central Banking Publications. 75% of the 80 financial managers of central banks that participated in the survey predict that financial institutions will reduce the share of assets in pounds on their balance sheets. Such a scenario is expected to weaken the British currency and increase the cost of borrowing for the UK government, which has long benefited from the popularity of the pound as a reserve currency. "It is obvious that managers predict the potential impact of Brexit on the fate of assets that are expressed in sterling. The exit of the UK from the EU is associated with uncertainty and volatility, which the managers do not like. They find Brexit devastating," said Nick Carver of Central Banking Publications. Today, the pound sterling is the fourth most popular currency after the dollar, euro and yen. According to the IMF, assets denominated in pounds account for about 4.5% of official reserves. Since the referendum on the membership of Great Britain in the EU, the volume of dollar reserves in sterling-nominated assets remained unchanged. Most likely, this indicates that the managers want to wait for information on the terms of the deal between London and Brussels to appear before they make decisions. Recall that earlier this month the Brexit deadline was extended until the end of October of this year. The material has been provided by InstaForex Company - www.instaforex.com |
| What to expect from the dollar this week: the Fed can provide a hint Posted: 29 Apr 2019 04:10 PM PDT After reaching almost two-year highs, the US currency's rise has stopped. Apparently, the greenback took a wait-and-see position on the threshold of two key events of the current week. On Wednesday, the next meeting of the Federal Reserve System (FRS) of the United States is to be held, and a report on the US labor market for April will be released on Friday. At the moment, market participants are primarily concerned with the following question: what conclusion did the Fed make from the release of the US GDP for Q1 published at the end of last week? Recall that the indicator significantly exceeded market expectations, having increased by 3.2%. At the same time, the PCE Core index, which is an important inflationary indicator for the Fed, has grown at a slow pace since 2013 - by 1.3% after rising 1.8% in the fourth quarter. The Fed targets this figure at 2%. Therefore, the main intrigue is whether at the next meeting the regulator will focus on improving the country's GDP data or focus on the depressed state of inflation. By the way, the slowdown in the wages in the US can serve as a brake on the latter. The corresponding data for April will be made public this Friday. In March, the indicator increased by only 0.1% after rising 0.4% a month earlier. It is possible that while maintaining the downtrend, the Fed will have another reason to reflect on the "softening" of the monetary rate. Most economists polled recently by Bloomberg believe that the US central bank will not cut rates this year, even if core inflation slows, while the derivatives market estimates the likelihood of such a move by the regulator at 60%. According to the results of the March meeting of the Fed, the greenback slumped after the scatter plot reflected the reluctance of the majority of FOMC members to raise the interest rate this year. However, in the light of current sentiments among world central banks, even in the event that the Fed's "dovish" rhetoric is strengthened, one can hardly expect a significant weakening of the dollar. "With the fall of the dollar, we will have to wait a little, because the news on the state of the global economy will hardly be positive enough to strike the US currency in the near future. We expect that on the horizon of three months, the euro will fall to $1.10, and the USD index will rise to 99 points," according to Goldman Sachs experts. The material has been provided by InstaForex Company - www.instaforex.com |
| The dollar rally has stopped, further predictions contradict each other Posted: 29 Apr 2019 04:10 PM PDT The US economy's success was a brake on the dollar, the rally has stalled. This time, strong data did little to support the currency. The dollar is trading in a narrow range, including the fact that Japan has begun its weekly holidays, which usually indicates weak liquidity, which can then cause volatility spikes. There are more than enough reasons to hesitate: the Fed meeting, Brexit negotiations, and a host of global data, including core inflation and payroll in the US. The main thing in this list, of course, the Fed. The market is waiting for the regulator to respond to the report that GDP grew by 3.2 percent for the first quarter. The conclusion itself suggest that this is not the week during which you need to occupy large positions in the foreign exchange market, trying to capitalize on the market consequences of one or more economic events. However, if there is a desire, it is recommended to take the dollar on downward turns against most of the G10 currencies. The total amount of long positions on the dollar rose to 33.6 billion dollars on Monday, the highest level since December 2015. The euro leads in terms of shorts. The dollar is holding back a sharp slowdown in core inflation, which has forced market participants to reduce the likelihood of a rate hike this year. In recent months, most large central banks have chosen a softer policy, keeping their currencies weak. For example, the Canadian dollar and the Swedish krona fell in price last week, when local central banks refused to raise rates in the future. The ECB is under pressure and will retain incentives, while the market is waiting for lower rates for Australia and New Zealand following weak inflation data. Some fear that a lack of liquidity could lead to the dollar's sudden collapse, as was the case in January, when the yen rose in price immediately, as bears were forced to close short positions. The material has been provided by InstaForex Company - www.instaforex.com |
| The euro can still drop to $1.105 Posted: 29 Apr 2019 04:10 PM PDT The time for the euro rally has not come yet, and the single currency may well fall to $1.105. Meanwhile, the dollar stabilized at the beginning of the week after ending Friday in the red zone, despite the publication of a strong indicator of GDP growth for the first quarter. Traders were seriously scared by inflation, as it slowed down from 1.8% to 1.3% in annual terms. It is also worth noting that the greenback's reaction to a strong GDP indicator reaffirmed the limited potential of the downward movement of the EUR/USD pair. Now investors are interested in what conclusion the Fed drew from ambiguous data on the economy. The US regulator's two day meeting starts on Tuesday. The market doubts that the US economy will be able to further maintain high growth rates. The total contribution of inventories and net exports to GDP growth reached 1.68 percentage points. These are the best results for the last six years. At the same time, the reason for the slow growth in imports was the excessively high activity of US companies in October-December. The reason for the unrest was the topic of new tariffs. The aggravation of the US-China trade conflict will fundamentally change the situation in the second quarter. What has been a growth driver may well become a brake. The Fed will not change the interest rate. The pause that was taken earlier by the central bank will continue, there is not much to doubt here. However, it may be more interesting. It is expected that the Fed will announce a new instrument capable of keeping the cost of federal lending within tight limits. The main currency pair's volatility on this background will increase. The publication of the eurozone's GDP for the first quarter is expected on Tuesday. According to analysts, the annual rate remained at the level of the previous quarter - 1.1%. At the same time, there will be a report on unemployment in the bloc in April, which, according to market estimates, also remained unchanged at 7.8%. At the same time, more and more banking strategists agree that the recovery of the Chinese economy will give impetus to European exports and the economy. For example, Goldman Sachs representatives draw parallels with 2016. At that time, under the influence of a large-scale stimulus, the Chinese economy eurozone was fired with a time lag of three months after the better-than-expected quarterly GDP of China. Such a comparison allows experts to talk about the acceleration of eurozone GDP in the second half of the year to 1.5%. The European currency is waiting for its time, while the dollar is trying to predict the Fed's future steps. The material has been provided by InstaForex Company - www.instaforex.com |
| #CL. April 29th. Oil can end the correction in the coming days Posted: 29 Apr 2019 04:10 PM PDT 4-hour timeframe Over the past two trading days, oil quotes have dropped significantly in value. However, most experts believe that this is a temporary phenomenon and nothing more than a correction. Donald Trump is blamed for the collapse of oil, who recently turned his attention to the oil market, momentarily forgetting the trade war with the EU and China. Now Trump believes that OPEC should increase oil production and lower prices. It is to this statement that the market reacted by selling. However, these are just words that do not yet correspond to concrete actions. Especially since OPEC will unlikely obey Trump. Meanwhile, the number of drilling rigs in the United States have dropped to an annual low. Oil production in the United States may fall in the near future. Problems with oil supplies from Libya and Venezuela can also form a shortage of "black gold". Plus, we should not forget about Iran, whose exports have recently more than halved. All of this suggests first of all that the rise in oil prices could resume in the near future. The correction was, Trump's words were fulfilled by the market, and the general trend in the oil market was a decline in production. Thus, the turn of the MACD indicator upwards will be the first signal for a possible resumption of the upward trend. Trading recommendations: At the moment, the #CL instrument is in a downward movement, but we expect the upward trend to resume with targets of around $68 per barrel. The upward turn of the MACD indicator will be a signal to reduce short positions. In addition to the technical picture, one should also take into account the fundamental data and the time of their release. Explanation of the illustration: Ichimoku indicator: Tenkan-sen - the red line. Kijun-sen - the blue line. Senkou Span A - light brown dotted line. Senkou Span B - light purple dotted line. Chikou Span - green line. Bollinger Bands indicator: 3 yellow lines. MACD Indicator: Red line and histogram with white bars in the indicator window. The material has been provided by InstaForex Company - www.instaforex.com |
| Posted: 29 Apr 2019 04:09 PM PDT 4-hour timeframe The amplitude of the last 5 days (high-low): 27p - 69p - 84p - 45p - 63p. Average amplitude for the last 5 days: 58p (45p). The first trading day of the week was very predictable. The volatility is minimal, there is no intraday trend, the correction is maintained. In the morning we noted that reports on changes in the volumes of personal incomes and spending of the US population in March are certainly interesting, but they are not strong. Unfortunately, the markets also did not find them particularly interesting, and there was no reaction. In addition to these data, nothing of interest in the fundamental plan has happened today. Thus, the correction in a very sluggish manner can continue with its target of the critical line. From a technical point of view, this is the most likely option now, and the pair's fate in the coming days will be decided near the critical line. The price rebound from this line will trigger the resumption of the downward movement. Overcoming - will change the instrument's trend into an upward one for a while. The pair's volatility could slightly increase tomorrow, since several interesting macroeconomic reports will be published. First, we are talking about the eurozone's GDP for the first quarter, but only of a preliminary value. However, the same indicator for the United States caused a market reaction last week , so we are entitled to expect no stronger movements tomorrow than today. Secondly, there will be a report on unemployment in the euro area, which will have less impact on the pair, but is also interesting. And, of course, everything will depend on how strong these reports are. Weak reports can send the euro to reach new lows. Trading recommendations: The EUR/USD pair continues to adjust, as indicated by the MACD indicator. Thus, sell orders with targets of 1.1096 and 1.1082 are still relevant, but it is recommended to open these positions in the event that the MACD indicator moves down or after a rebound from the critical line. It is recommended to consider buy orders in small lots with targets of levels 1.1213 and 1.1234 not earlier than the price consolidating above the critical line. In this case, the initiative will go into the hands of bulls for quite some time. In addition to the technical picture should also take into account the fundamental data and the time of their release. Explanation of the illustration: Ichimoku indicator: Tenkan-sen - the red line. Kijun-sen - the blue line. Senkou Span A - light brown dotted line. Senkou Span B - light purple dotted line. Chikou Span - green line. Bollinger Bands indicator: 3 yellow lines. MACD Indicator: Red line and histogram with white bars in the indicator window. The material has been provided by InstaForex Company - www.instaforex.com |
| Posted: 29 Apr 2019 04:09 PM PDT 4-hour timeframe The amplitude of the last 5 days (high-low): 23p - 91p - 76p - 51p - 69p. Average amplitude for the last 5 days: 62p (54p). On Monday, April 29, the British pound sterling continues to adjust, but there is low volatility again, not more than 40 points during the day. Two price rebounds from the critical line predict the resumption of a downward trend. But there is nothing special to say in fundamental terms. Reports from the US did not cause any reaction from market participants. Mark Carney's speech also did not affect the movement of the currency pair. Tomorrow will also be a boring day for the pound/dollar pair, since there are no interesting reports that are expected from the UK and the United States. In general, in the coming days, instrument volatility may again be low, which is clearly not conducive to increasing the activity of traders in the market. From a technical point of view, the resumption of a downward trend is very likely. That is, the pound sterling can move well below the lows of the previous week. Meanwhile, Michel Barnier said that the first week of May could be crucial for the future of Brexit. He said that he was waiting for the results of negotiations between Theresa May and the Labour Party, which, if successful, could add a significant number of votes in the new, fourth in a row vote on the Brexit "deal" and ensure its adoption by Parliament. Thus, both the European Union and Theresa May understand that the only option to accept the current version of the "deal" is to get the necessary number of votes. The question is: will Labour make a deal with Theresa May and what will the prime minister promise in return? Trading recommendations: The GBP/USD currency pair continues its upward correction. Therefore, sell orders with a target of 1.2848 remain relevant at the moment, but they should be opened after the current correction is completed, there has already been a rebound from the critical line. Long positions in small lots are encouraged to be considered in case one has overcome the Kijun-sen line with the first targets, a resistance level of 1,2998 and the Senkou span B line. In addition to the technical picture, one should also take into account the fundamental data and the time of their release. Explanation of the illustration: Ichimoku indicator: Tenkan-sen - the red line. Kijun-sen - the blue line. Senkou Span A - light brown dotted line. Senkou Span B - light purple dotted line. Chikou Span - green line. Bollinger Bands indicator: 3 yellow lines. MACD Indicator: Red line and histogram with white bars in the indicator window. The material has been provided by InstaForex Company - www.instaforex.com |
| USD/CAD. Buy but be careful: the price "ceiling" - 1.3610 Posted: 29 Apr 2019 03:51 PM PDT Last week, the Canadian dollar fell against a basket of major currencies, responding to the dovish results of the Bank of Canada's April meeting. The USD/CAD pair followed the general trend and rose to an annual high of 1.3520. But the upward impulse turned out to be short-term - on Friday, the loonie settled within the framework of the 34th figure and consolidated throughout the market. This dynamic is due to two factors: firstly, this is a general weakening of the US currency, and secondly, the growth of the oil market amid threats from Iranians to block the Strait of Hormuz. In addition, the loonie is in anticipation of important events of a fundamental nature: tomorrow (April 30) data on the growth of the Canadian economy and the index of prices for raw materials will be published. In addition to macroeconomic reports, traders will monitor the rhetoric of the head of the Bank of Canada, Stephen Poloz, who will report to members of the Committee on Finance of the House of Commons. Also, we should not forget that the current week is also full of events for the US dollar: the outcome of the Fed meeting and Nonfarm figures may affect the position of the greenback, thereby affecting the configuration of the USD/CAD pair. In other words, the loonie froze in anticipation of key events that will determine the pair's future fate. It should be immediately noted that the forecast for Canadian GDP growth is negative. The consensus forecast suggests that on a monthly basis, the Canadian economy will slow to zero, and in annual terms to 1.4% (after a 1.6% increase in January). Such results will disappoint, but are unlikely to surprise investors, given the forecasts voiced at the last meeting of the Canadian regulator. GDP growth in the last quarter of last year was revised to 0.4% (from the previous 1.3%), and the forecast for growth in the first quarter of this year to 0.3% (from the previous 0.8%). The forecast of economic growth in the current year was also revised downwards - from 1.7% to 1.2%. According to members of the central bank, the Canadian economy is slowing down due to lower growth in the housing market and a general decline in consumer confidence. In particular, the average cost of housing fell by almost 6% last year due to lower demand and more strict and complex rules for obtaining mortgage. Other structural elements of GDP still show negative dynamics: the volume of investments in the Canadian economy, investment in real estate and new projects is decreasing. In other words, with a high degree of probability, tomorrow's release will be at a forecast level or even weaker than projections. This fact can provoke the USD/CAD pair's growth, but in this case, long positions should be treated with caution. From the point of view of technical analysis (which we will discuss below), the pair has potential for growth to the resistance level of 1.3610 (the upper line of the Bollinger Bands indicator on the weekly chart). If data on the growth of the Canadian economy comes out worse than expected, the loonie may jump to this target in an impulsive manner. But the pair's further dynamics will largely depend on the "well-being" of the US currency. If the outcome of the April Fed meeting is disappointing (which is very likely, given the recent inflation releases) and the Nonfarm data will be weaker than expected, the USD/CAD bulls will not be able to keep the pair in the 36th figure. Even the 35th mark in this case will be questionable, since the market has already taken into account the April meeting of the Bank of Canada and focused on US events. Stephen Poloz, who is set to speak before the deputies of the House of Commons for two days, will most likely repeat the rhetoric he voiced last week. He can comment on published data on GDP growth, but his words are unlikely to change the overall situation for the pair. Let me remind you that during its last meeting, the Bank of Canada removed a phrase about the future overnight rate increase from the text of its accompanying statement. The market has already "digested" this fact, so another reminder from Poloz will not affect the dynamics of USD/CAD. Thus, the USD/CAD pair has the potential for further growth, but this growth is limited by the price ceiling of 1.3610. Considering the preliminary forecasts, purchases with the first target of 1.3485 (the top line of the Bollinger Bands on the daily chart) can be considered from the current positions. In the long run, the motion vector of the pair depends on the greenbacks' dynamics, therefore, price growth above the bottom of the 36th figure looks unlikely. In a technical point of view, the USD/CAD pair is still in an uptrend on all the "higher" time frames - D1, W1 and MN. In particular, the price is between the middle and upper lines of the Bollinger Bands indicator on the daily chart, which shows an expanded channel. The Ichimoku indicator has formed one of its strongest signals - the bullish Parade of Lines. In addition, the pair is located above the Kumo cloud, which also indicates the upward direction of the price. As already mentioned above, the highest resistance level is seen at 1.3610 - this is the top line of the Bollinger Bands on the weekly chart. The material has been provided by InstaForex Company - www.instaforex.com |
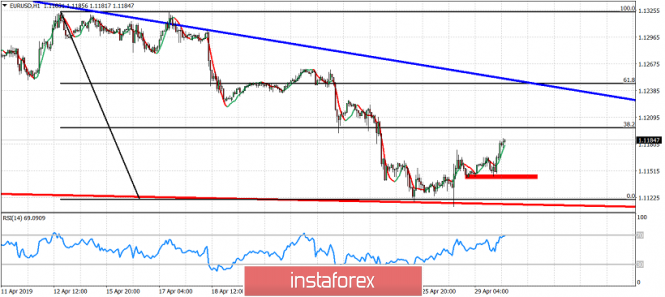
| Short-term technical analysis of EURUSD for April 29, 2019 Posted: 29 Apr 2019 12:51 PM PDT EURUSD as expected from last week, we were warned by the short-term reversal signs, is approaching our short-term target of 1.12. Medium-term trend remains bearish as long as price is below 1.1350.
Red rectangle - short-term support EURUSD is moving higher making higher highs and higher lows. Price reversed short-term trend after touching our lower wedge boundary at 1.1115 as mentioned in previous posts. EURUSD is moving towards our first target area of 38% Fibonacci retracement of the latest decline. Major resistance is at 1.13-1.1350 area and as long as we remain below this level any bounce is considered selling opportunity. The material has been provided by InstaForex Company - www.instaforex.com |
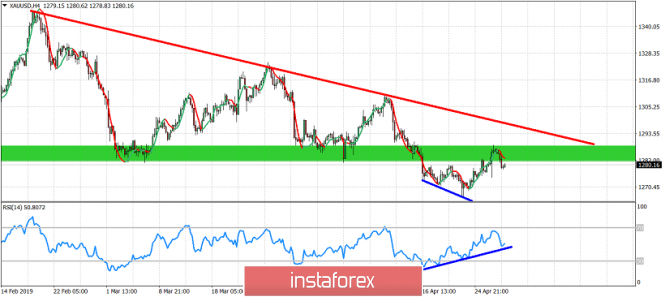
| Technical analysis of Gold for April 29, 2019 Posted: 29 Apr 2019 12:47 PM PDT Gold price got rejected after the bounce at the $1,288 area. Gold price bounced towards resistance of $1,280-90 from $1,266 as a back test as expected. Medium-term trend remains bearish.
Blue lines -bullish divergence Green rectangle - resistance (previous support) Gold price is making higher highs and higher lows in the short-term after bottoming near $1,266. Gold price so far rejected at the resistance area of $1,280-90. Medium-term trend remains bearish as long as price is below the red downward sloping trend line resistance now at $1,300. The RSI is making higher highs and higher lows holding above the blue upward sloping trend line. As long as this trend line holds I expect Gold bulls to make another try higher towards the major red trend line resistance. Resistance at $1,288 if broken I would expect Gold price to move closer or even test $1,300. $1,274 is short-term support. Failure to stay above it will open the way towards our $1,250-60 target area or lower. The material has been provided by InstaForex Company - www.instaforex.com |
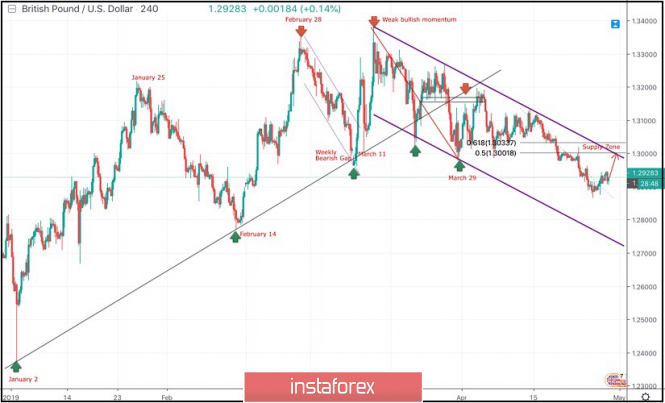
| April 29, 2019 : GBP/USD Intraday technical analysis and trade recommendations. Posted: 29 Apr 2019 09:36 AM PDT
On January 2nd, the market initiated the depicted uptrend line around 1.2380. On March 11, a weekly bearish gap pushed the pair below the uptrend line (almost reaching 1.2960) before the bullish breakout above short-term bearish channel was achieved. Shortly after, the GBPUSD pair demonstrated weak bullish momentum towards 1.3200 then 1.3360 where the GBPUSD failed to achieve a higher high above the previous top achieved on February 27. Instead, the depicted recent bearish channel was established. Significant bearish pressure was demonstrated towards 1.3150 - 1.3120 where the depicted uptrend line failed to provide any bullish support leading to obvious bearish breakdown. On March 29, the price levels of 1.2980 (the lower limit of the depicted movement channel) demonstrated significant bullish rejection. This brought the GBPUSD pair again towards the price zone of (1.3160-1.3180) where the upper limit of the depicted bearish channel as well as the backside of the depicted uptrend line demonstrated significant bearish rejection. Since then, Short-term outlook has turned into bearish with intermediate-term bearish targets projected towards 1.2900, 1.2800 and 1.2750 where the lower limit of the depicted channel comes again to meet the GBPUSD pair. Trade Recommendations: Conservative traders should be waiting for a bullish pullback towards 1.3035 for a valid SELL entry. TP levels to be located around 1.2950, 1.2905 and 1.2800 and S/L to be located above 1.3100. The material has been provided by InstaForex Company - www.instaforex.com |
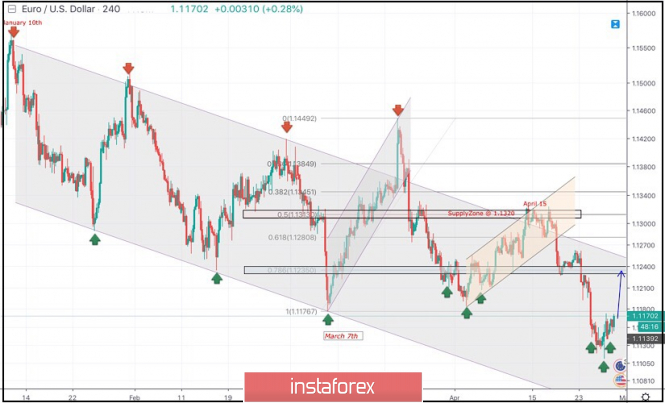
| April 29, 2019 : EUR/USD Intraday technical analysis and trade recommendations. Posted: 29 Apr 2019 09:19 AM PDT
Few weeks ago, a bullish Head and Shoulders reversal pattern was demonstrated around 1.1200. This enhanced further bullish advancement towards 1.1300-1.1315 (supply zone) where significant bearish rejection was demonstrated on April 15. Short-term outlook turned to become bearish towards 1.1280 (61.8% Fibonacci) then 1.1235 (78.6% Fibonacci). For Intraday traders, the price zone around 1.1235 (78.6% Fibonacci) stood as a temporary demand area which paused the ongoing bearish momentum for a while before bearish breakdown could be executed few days ago. Conservative traders were advised to wait for a bullish pullback towards the newly-established supply zone around 1.1235 for a valid SELL entry. On the long-term, bearish persistence below 1.1235 enhances further bearish decline towards 1.1170 then 1.1115 if enough bearish momentum is expressed. The current price levels are quite risky for having new sell orders.Moreover, a recent bullish head and shoulders pattern is being demonstrated on the H4 chart. That's why, conservative traders should be waiting for another bullish pullback towards 1.1230-1.1250 for a valid SELL entry. The material has been provided by InstaForex Company - www.instaforex.com |
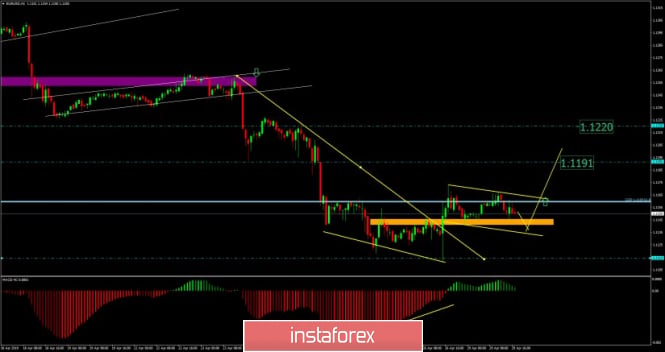
| EUR./USD analysis for April 29, 2019 Posted: 29 Apr 2019 07:19 AM PDT EURUSD is trading sideways in past 24h at the price of 1.1151. The strong impulsive upward movement in the background is present and you should still watch for buying opportunities.
Orange rectangle – Short-term resistance, which became key support Yellow large diagonal – Resistance based on price action EURUSD is in creation of the potential bullish flag just after the breakout of the supply trendline (orange) in the background. In the near term we see potential for more upside on the EUR especially since we found strong bullish divergence on the 1H+4H time-frames. Upward references are seen at the price of 1.1191 and 1.1220. Key support remains at the price of 1.1114. Watch for buying opportunities if you see potential breakout of the bullish flag. The material has been provided by InstaForex Company - www.instaforex.com |
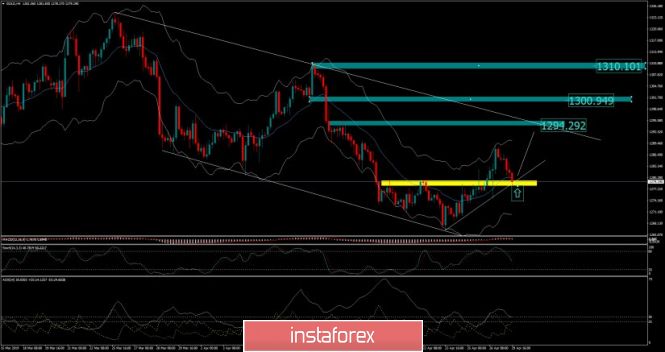
| Analysis of Gold for April 29, 2019 Posted: 29 Apr 2019 07:01 AM PDT Gold traded lower in past 24h period but it is on critical support at $1.279.00 and selling at the support looks very risky. We are expecting further upside and potential test of the upward references.
Yellow rectangle – Short-term resistance, which became key support Green rectangle – Resistance based on price action Green rectangle – Resistance 2 based on price action Green rectangle – Resistance 3 based on price action Gold is testing the key support at $1.278.00. Our advice is to watch for buying opportunities. Upward references are set at the price of $1.294.30, $1.300.95 and $1.310.00. As long as the Gold is trading above the $1.265.00, the short term-trend remains bullish. Medium Keltner average (20EMA) is acting like support, which adds more potential for upside. The material has been provided by InstaForex Company - www.instaforex.com |
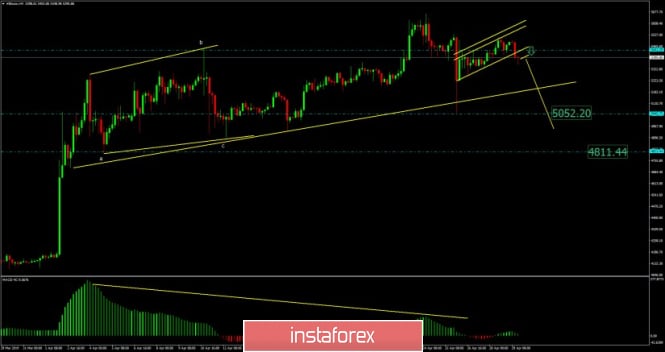
| Bitcoin analysis for April 29, 2019 Posted: 29 Apr 2019 06:31 AM PDT BTC price did break the bearish flag pattern in the background, which is sign for further downward movement. The resistance at $5.441 didn't hold like support, which is another sign that buyers lack power for any larger break.
Yellow upward channel – Bearish flag pattern Lower big diagonal - major short-term support We found big bearish divergence on MACD oscillator on the H4 time-frame, which is strong sign that weakness is coming. Support levels are seen at the price of $5.052 and $4.811. Key resistance levels are set at the price of $5.518 and $5.644. Since the strong impulsive downward wave in the background, we expect at least testing of $5.052. Watch for selling opportunities. The material has been provided by InstaForex Company - www.instaforex.com |
| EURUSD: Eurozone lending slowed, consumer and company confidence declined Posted: 29 Apr 2019 05:53 AM PDT Buyers of the European currency failed to cling to a large resistance level around 1.1180 and did not update it, and weak data released in the first half of the day on consumer confidence in the eurozone and lower lending, discouraged any interest from large players in the short-term purchase of risky assets. According to the report, growth in lending to companies by banks in the eurozone slowed in March after a slight increase in February of this year, indicating a weakening growth in the region's economy. The report of the European Central Bank indicated that lending to companies in March of this year increased by 3.5% compared with the same period of the previous year, after growing by 3.8% in February. Household lending grew in March only by 3.2 % compared with the same period of the previous year, after rising 3.3% in February. I recall that the economy of the eurozone, like other developed countries, is highly dependent on the availability of financing and lending, and a decline in these indicators may indicate likely problems in the future. The M3 monetary aggregate rose by 4.5% in March compared with the same period of the previous year, against a 4.3% increase in February. Economists had expected a growth of 4.2%. The euro was also influenced by data on the sentiment index in the eurozone economy, which, given the indicator of confidence among producers and consumers, fell to 104.0 points in April against 105.6 in March of this year. Economists had expected the index to be 105.0 points in April. Eurozone producers were more pessimistic in April, as eurozone exports remain rather weak, which worsens prospects. According to the data, the industrial sentiment index in April 2019 fell to -4 points against -1.6 points in March. The index of confidence in the eurozone industry for April was projected at -2.0 points. As I noted above, the quarterly index of export expectations showed a particularly strong drop. The consumer confidence index in the eurozone also fell slightly in April, reaching -7.9 points against -7.2 points in March. The consumer confidence index was forecast at -7.9 points. The technical picture in the EURUSD pair has not changed significantly. Trading in the next few days will be conducted from the support range of 1.1115, where the bulls will try to build a new lower limit of the ascending channel. The main problem for buyers of risky assets will be the upper limit of the current side channel at 1.1180, a breakthrough of which will lead the trading tool to return to levels 1.1210 and 1.1240. The material has been provided by InstaForex Company - www.instaforex.com |
| Posted: 29 Apr 2019 05:08 AM PDT To open long positions on GBP / USD you need: Pound buyers could not build a new wave of growth in the first half of the day, but the probability of continuing upward correction remains quite high. The formation of a false breakdown at 1.2915, to which bears are now very close, will be a signal to open long positions based on a breakout and consolidation above resistance 1.2960, which will open a direct path to the highs of 1.2990 and 1.3017, where I recommend taking profits. Under the scenario of reducing the pound below the level of 1.2915, long positions can be returned to the rebound from the support of 1.2870. To open short positions on GBP / USD you need: The bears did not wait for a false breakdown in the area of resistance 1.2960, to which I paid attention in my morning forecast. Now the main task is to consolidate below the range of 1.2915, which is the middle of the side channel, which will lead to the formation of pressure on GBP / USD and reduce the pair to the area of minimum 1.2874, where I recommend taking profits. In the case of growth above 1.2960, GBP / USD can be sold to rebound from a maximum of 1.2990. More in the video forecast for April 29 Indicator signals: Moving averages Trade is conducted in the region of 30 and 50 moving averages, which indicates the likely completion of a downward trend. Bollinger bands Volatility is low, which does not give signals to enter the market. Description of indicators
|
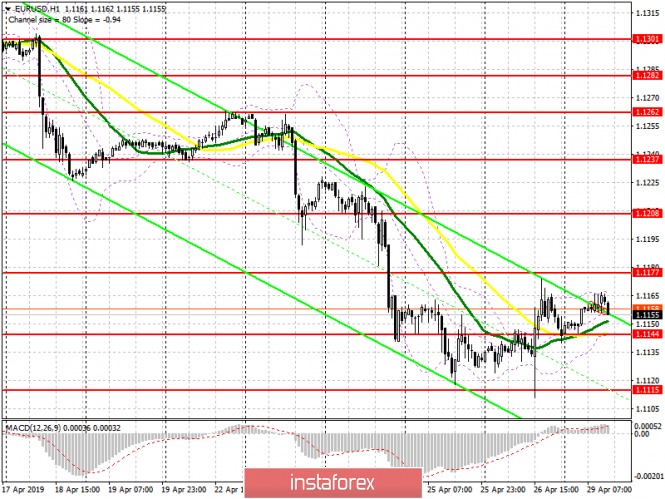
| EUR / USD: plan for the US session on April 29. Trade has moved to a narrow side channel Posted: 29 Apr 2019 05:08 AM PDT To open long positions on EURUSD you need: The situation has not changed in comparison with the morning forecast. After an unsuccessful Friday attempt to continue strengthening the US dollar, amid a good report on US GDP, euro buyers returned to the level of 1.1144, and as long as trade is conducted above this range, demand will remain. The formation of a false breakdown in this range will be a signal to buy EUR / USD in order to break through and consolidate above the important resistance of 1.1177, which will open a direct path to a maximum of 1.1208 and 1.1237, where I recommend taking profits. When the decline scenario is below the level of 1.1144, long positions can be returned to the rebound from 1.1115. To open short positions on EURUSD you need: An unsuccessful attempt to consolidate at the level of 1.1177 will be a signal to open short positions in the euro with the aim of reducing and fixing at a minimum of 1.1144, a breakdown of which will lead EUR / USD to the support area 1.1115, where I recommend taking profits. With the growth of the euro above 1.1177 resistance, and this can happen only after weak data on income and expenditures of Americans, it is best to open short positions to rebound from a maximum of 1.1208. More in the video forecast for April 29 Indicator signals: Moving averages Trade is conducted in the region of 30 and 50 moving averages, which indicates the likely completion of a downward trend. Bollinger bands Volatility is low, which does not give signals to enter the market.
Description of indicators
|
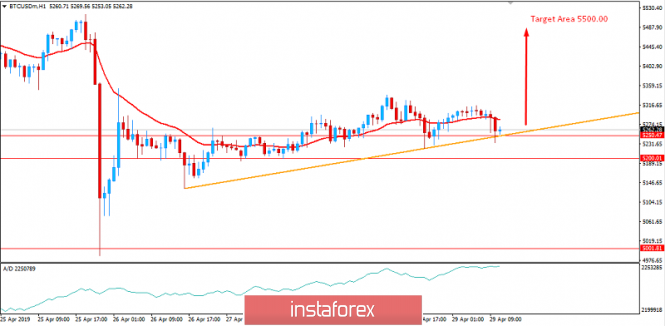
| BITCOIN Analysis for April 29, 2019 Posted: 29 Apr 2019 04:31 AM PDT This past week, there was a sharp drop in bitcoin price below the $5,200 support. The BTC/USD pair even spiked below the $5,000 support level and formed a swing low above $4,900. Later, the price started a slow and steady recovery above the $5,000 and $5,050 resistance levels. The bulls even pushed the price above the $5,200 resistance. It opened the doors for more gains above the $5,200 level and push higher towards $5,500 area in the coming days. It seems like the 50% Fib retracement level of the last slide from the $5,509 high to $4,905 low is acting as a hurdle. Besides, the trendline holding the price as support above $5,250 is expected to push the price higher towards $5,500 area. On the other hand, if there is no upside pressure and if the price breaks below $5,200 with a daily close, BTC may decline below $5,150. An initial support is seen near the $5,100 level, below which the next stop could be $5,050. Looking at the chart, bitcoin price is clearly trading near a crucial juncture below $5,220 and $5,250. If the bulls gain control above $5,220 and $5,250, there could be a decent extension towards the $5,380 resistance level. Conversely, a continuous struggle to clear $5,250 is likely to start a fresh decrease towards the $5,100 or $5,050 level in the near term. SUPPORT: 5,000, 5,200-50 RESISTANCE: 5,380, 5,500 BIAS: BULLISH MOMENTUM: VOLATILE
|
| Posted: 29 Apr 2019 04:26 AM PDT A rich economic calendar across the States, the final round of US-Chinese trade negotiations, and concerns about a repetition of the January flash crash riveted investors 'attention on the Japanese yen. From the minimum in 2019 levels, the USD / JPY quotes soared almost 7% amid growing global risk appetite and falling Forex volatility to the very bottom since 2014. Nevertheless, the situation changed slightly in April: despite continuing growth in global stock indices, interest in the safe haven flared up with a new force. The release of data on US GDP for the first quarter cooled the ardor of dollar fans. The US economy may have expanded by 3.2%, but this was due to an increase in inventories and net exports. These temporary factors may not be drivers of growth, but their brake in April-June. In contrast, inflation slowed down from 1.8% to 1.3%, which increased the risks of a reduction in the federal funds rate in 2019 from 40% to 66%. Investors have been drawing parallels from 1995-1998, when the Fed, despite the booming GDP and the historical highs of the S & P 500, lowered rates, nodding at sluggish inflation and international risks. For the first time in many years, divergence in monetary policy can play on the side of "bears" and not "bulls" on USD / JPY. The last meeting of the Bank of Japan left many questions. Why does the regulator predict that consumer prices in 2022 will grow by 1.6%, but at the same time declares that the overnight rate will remain at the current level, at least until March 2020? Is he ready to tighten monetary policy earlier than inflation allows? It should be noted that the use of the yield curve targeting practice made it possible for BoJ to buy less assets than it is declared. It seems that the peak of the quantitative easing program was passed in 2017. Dynamics of asset purchases by Bank of Japan in the framework of QE Despite the fact that Xi Jinping is ready to go along with Donald Trump and liberalize China's domestic market, ban illegal transfer of technology and limit non-market subsidies to state-owned enterprises, it's premature to talk about the end of trade wars. Washington is starting talks with Tokyo and Brussels, and Shinzo Abe's refusal to facilitate American farmers 'access to the agricultural market in the Land of the Rising Sun heightens the risks of new US import duties. This, in turn, stirs interest in safe-haven assets. Along with the macroeconomic calendar and trade conflicts , investors should keep in mind long holidays in Japan. In January, the USD / JPY pair for a few minutes slipped by 4% in the witchcraft hour, and, fearing a repeat of the flash accident, speculators close their positions on the yen. Technically, an internal bar appeared at the auction on April 26th. Breakthrough of its minimum near 111.4 will increase the risks of continuing the peak to the lower border of the upward trading channel. The Shark pattern can be activated, the target of which is 88.6% corresponds to 110. On the contrary, a breakthrough of the maximum of the inside bar near 112 will create prerequisites for the rally to continue to target by 161.8% according to the AB = CD model. USD / JPY daily graph |
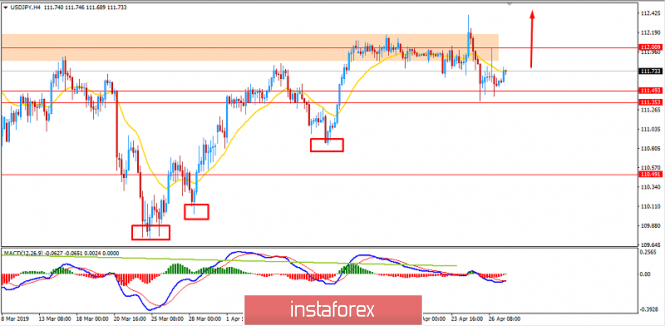
| Fundamental Analysis of USDJPY for April 29, 2019 Posted: 29 Apr 2019 04:19 AM PDT USD is expected to continue strengthening against JPY ahead of the Federal Funds and NFP reports scheduled for this week. The yen is affected by the mixed economic reports and likely to give in if the US reports come out strong, like the recent Advance GDP. Thus, the US dollar is anticipated to firm against the yen in the coming days. The hopes of Donald Trump for re-election have always hinged on supercharging the US economy, and data showing faster than expected growth provided him a boost just as he was preparing to ramp up his campaign. The gross domestic product rose at a 3.2 percent annual rate in the first quarter of 2019. Friday's nonfarm payrolls report for April tops the list of data releases this week. Economists anticipate a gain of 181,000 jobs, while the unemployment rate is forecast to hold steady at 3.8%. The American economy added 196,000 jobs in March, rebounding after just 33,000 jobs were added in the previous month. Moreover, evaluating the recent data, consumer confidence is expected to be boosted by equity market gains and the ongoing strength in the jobs market. This will be underlined by another decent rise in payrolls and a renewed uptick in wage growth after last month's surprise dip. On Wednesday, the outcome of the FOMC meeting and the Federal Funds Rate report are going to be published. The regulator's interest rate is expected to remain unchanged at 2.50%. Additionally, Fed Chair Jerome Powell will hold a press conference following the meeting, investors await his insights on the policy outlook. Today's US Core PCE Price Index is anticipated to inch up to 0.2% from the previous value of 0.1%, Personal Spending is also expected to increase to 0.2% from the previous value of 0.1%, and the Personal Income is to increase to 0.4% from the previous value of 0.2% as well. On the JPY side, the Bank of Japan is still projecting a moderate expansion of the economy with weaker exports due to the global economic slowdown. The Bank intends to keep the current interest rate unchanged for an extended period and plans to purchase the Japanese government bonds (JGBs) so that 10-year JGB Yields remains at around 0%. The Japanese regulator decided to examine the uncertainties about the economic activity along with the effect of the scheduled consumption tax hike and planned to continue the QQE on an extreme level. The extreme QQE might make the yen weaker against all other major currencies. The bank forecasts a strong labor market with the consumer price index below a 2% target. The industrial production showed a weaker-than-expected result and dropped from 1.4% to 0.7%. The retail sales index increased to 1.0%. The trade Balance came in at -0.18T, while the forecast was -e30T. As a result, the market is expected to be volatile. The final Manufacturing PMI scheduled for this week is going to remain unchanged at 49.5. Currently, the upcoming economic reports from the United States provide support for the greenback which is likely to gain further momentum. However, any disappointing news may slow it down. Now, let us look at the technical view. The pair has a strong bullish trend. It is likely to move higher after it has recently bounced from the 111.35-50 support area with a daily close. Moreover, it might jump much higher towards the 114.50-115.00 area in the coming days. As far as the price remains above 110.00 area with a daily close, the bullish bias is expected to continue.
|
| You are subscribed to email updates from Forex analysis review. To stop receiving these emails, you may unsubscribe now. | Email delivery powered by Google |
| Google, 1600 Amphitheatre Parkway, Mountain View, CA 94043, United States | |

No comments:
Post a Comment