
Forex analysis review |
- USD/JPY vs EUR/JPY vs GBP/JPY vs #USDX - H4. Comprehensive analysis of movement options for November 22, 2019. APLs &
- Developing the trading idea for oil
- Volume analysis and trading idea for oil
- GBP/USD. November 21. Results of the day. Labour published a manifesto in an attempt to turn the tide of the election campaign
- EUR/USD. November 21. Results of the day. The "first phase" of the trade agreement between China and the United States is
- GBPUSD atmosphere: the pound only reacts to political battles in Britain
- Analysts have given the most accurate USD/JPY annual forecast in history
- Dollar could disappoint investors next year, while the euro and the pound might be pleasing
- GBPUSD and EURUSD: Pound could decline after the publication of the Labour Party manifesto. OECD lowers global GDP growth
- EUR/USD: the Fed did not provide new information to the market, the ECB's turn
- Competitor suppresses: Canadian dollar is hard to resist USD
- Trader's diary 11/21/19 EURUSD
- Dollar seeks to conquer the throne
- EUR/USD approaching resistance potential drop!
- AUD/USD drop in progress!
- USD/CHF to bounce from 1st support, potential rally!
- Trading recommendations for the EURUSD currency pair – placement of trade orders (November 21)
- Evening review EURUSD 11/21/2019
- BTC 11.21.2019 - All trends down, Bitcoin is aproaching our main downward target at $7.500
- Gold 11.21.2019 - Rejection of the multi Fibonacci confluence at $1.4652, possible upside movement and test of $1.478.
- EUR/USD for November 21,2019 - Rejection of major resistance level at 1.1100, selling opportunities are preferable
- November 21, 2019 : GBP/USD Intraday technical analysis and trade recommendations.
- November 21, 2019 : EUR/USD technical outlook predicts bearish reversal around 1.1090.
- GBP/USD: plan for the American session on November 21. Buyers of the pound have regained the level of 1.2935 and are trying
- EUR/USD: plan for the American session on November 21. The euro's growth is limited by this week's highs. ECB report may
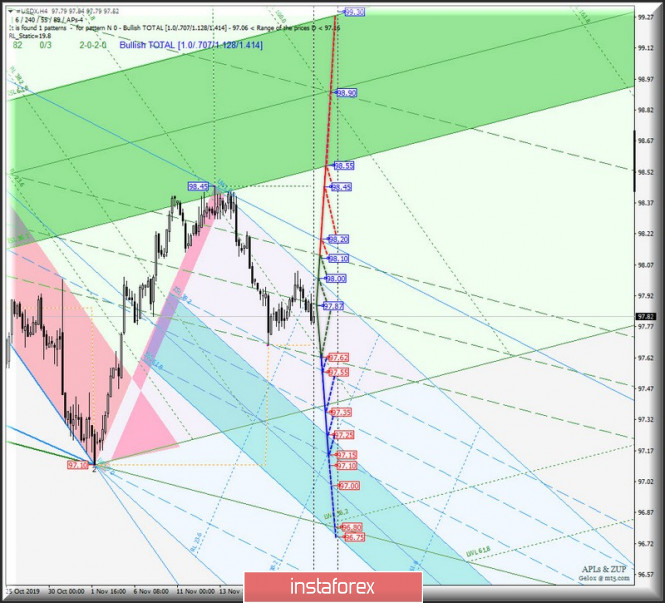
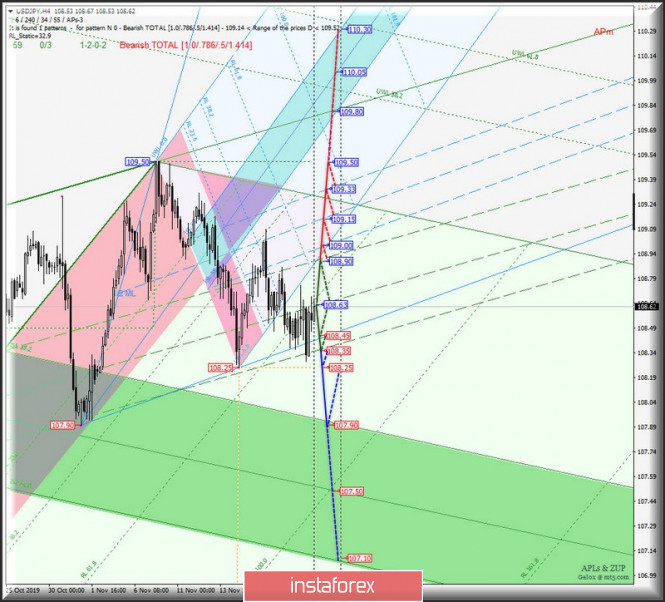
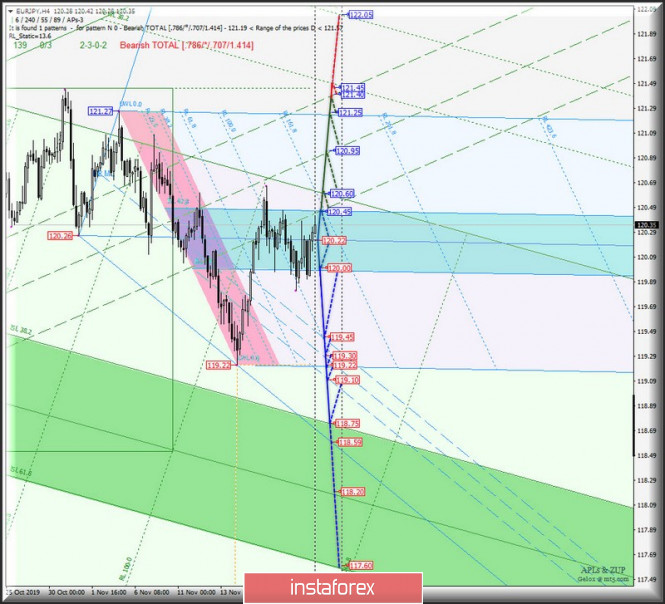
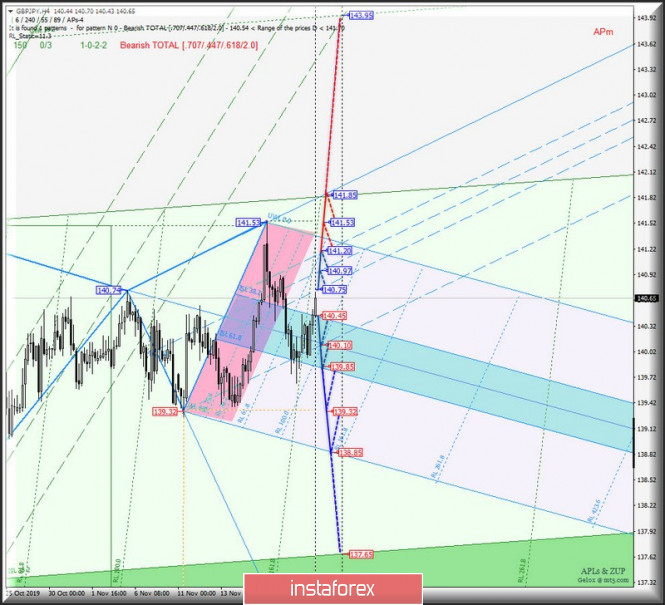
| Posted: 21 Nov 2019 04:53 PM PST Let's see what will happen with the movement of the currency of the "land of the rising sun" USD/JPY and its cross-instruments EUR/JPY and GBP/JPY, as well as the dollar index #USDX on November 22, 2019. Minuette (H4 timeframe) ____________________ US dollar Index The dollar index continues to remain in the 1/2 Median Line channel (98.10 - 97.87 - 97.62) of the Minuette operational scale forks, respectively, further development of the #USDX movement from November 22, 2019 will be due to the development and direction of the breakdown of the above levels. Look at the details of this movement on the animated chart. The breakdown of the support level of 97.52 on the lower boundary of the 1/2 Median Line Minuette channel will determine the further development of the movement of the dollar index to the boundaries of the 1/2 Median Line channel (97.55 - 97.35 - 97.15) and the equilibrium zone (97.25 - 97.00 - 96.75) of the Minuette operational scale forks. In case of consecutive breakdown of resistance levels: -98.10(the upper boundary of the channel is the 1/2 Median Line Minuette); -98.20(control line UTL of the Minuette operational scale forks); upward movement of the #USDX will continue to be confirmed to the local maximum 98.45 and the lower boundary of ISL38.2 (98.55) of the equilibrium zone of the Minuette operational scale forks. The markup of #USDX movement options on November 22, 2019 is shown on the animated chart. ____________________ US dollar vs Japanese yen The currency of the country of the rising sun is also located in the 1/2 Median Line channel of the Minuette operational scale forks, so further development of the USD / JPY movement on November 22, 2019 will be determined by the development and direction of the breakdown of the boundaries of the levels (108.90 - 108.63 - 108.35) of this channel. Look at the animated chart for the movement details. The breakdown of the lower boundary of the 1/2 Median Line Minuette channel (108.35) with the subsequent update of the local minimum 108.25 will determine the continuation of development of the downward movement of the currency of the "land of the rising sun" to the boundaries of the equilibrium zone (107.90 - 107.50 - 107.10) of the Minuette operational scale forks. Combined breakdown of resistance levels : - 108.90 at the upper boundary of the 1/2 Median Line Minuette channel; - 109.00 on the lower boundary of the 1/2 Median Line Minuette channel; will determine the development of the USD/JPY movement within the 1/2 Median Line channel (109.00 - 109.15 - 109.33) of the Minuette operational scale forks with the prospect of updating the local maximum 109.50 . The movement details of USD/JPY, depending on the direction of the breakdown of above 1/2 Median Line Minuette channel, are shown on the animated chart. ____________________ Euro vs Japanese yen The development of the cross-instrument movement EUR/JPY on October 22, 2019 will be determined by the development and direction of the breakdown of the boundaries of the equilibrium zone (120.00 - 120.22 - 120.45) of the Minuette operational scale forks. The details are shown on the animated chart. At the same time, a combined breakdown of the upper boundary of ISL61.8 (resistance level of 120.45) equilibrium zone of the Minuette operational scale forks and the start line SSL (120.60) of the Minuette operational scale forks, will confirm the development of the movement of EUR/JPY in the 1/2 Median Line Minuette channel (120.45 - 120.95 - 121.40) with the prospect of updating the local maximum 121.45. On the contrary, the breakdown of the lower boundary of ISL38.2 ( support level of 120.00) of the equilibrium zone of the Minuette operational scale forks will make it urgent to develop the downward movement of this cross-instrument to the boundaries of the 1/2 Median Line Minuette channel (119.45 - 119.30 - 119.10) with the prospect of reaching the upper boundary of ISL38.2 (118.75) equilibrium zones of the Minuette operational scale forks. The details of the EUR/JPY movement, depending on the development of the boundaries of this equilibrium zone, are presented on the animated chart. ____________________ Great Britain pound vs Japanese yen Meanwhile, the development of the GBP / JPY cross-instrument movement on November 22, 2019 will be determined by the direction of the breakdown of the range:
The breakdown of the resistance level of 140.75 is the development of the GBP/JPY movement in the 1/2 Median Line channel (140.75 - 140.97 - 141.20) of the Minuette operational scale forks with the prospect of updating maximum 141.53 and reaching the SSL start line (141.85) of the Minuette operational scale forks. However, a return below ISL61.8 Minuette (support level of 140.45) will determine the development of the movement of this cross-instrument in the equilibrium zone (140.45 - 140.10 - 139.85) of the Minuette operational scale forks.But in case that there will be a breakdown of ISL38.2 Minuette (139.85), then the downward movement of GBP/JPY can be continued to the local minimum 139.32 and the final line FSL Minuette (138.85). The details of the GBP/JPY movement, depending on the direction of the breakdown of above equilibrium zone, are shown on the animated chart. ____________________ The review is made without taking into account the news background. Thus, the opening of trading sessions of the main financial centers does not serve as a guide to action (placing orders "sell" or "buy"). The formula for calculating the dollar index: USDX = 50.14348112 * USDEUR0.576 * USDJPY0.136 * USDGBP0.119 * USDCAD0.091 * USDSEK0.042 * USDCHF0.036. where the power coefficients correspond to the weights of the currencies in the basket: Euro - 57.6%; Yen - 13.6% ; Pound Sterling - 11.9%; Canadian dollar - 9.1%; Swedish krona - 4.2%; Swiss franc - 3.6%. The first coefficient in the formula leads the index to 100 at the start date of the countdown - March 1973, when the main currencies began to be freely quoted relative to each other. The material has been provided by InstaForex Company - www.instaforex.com |
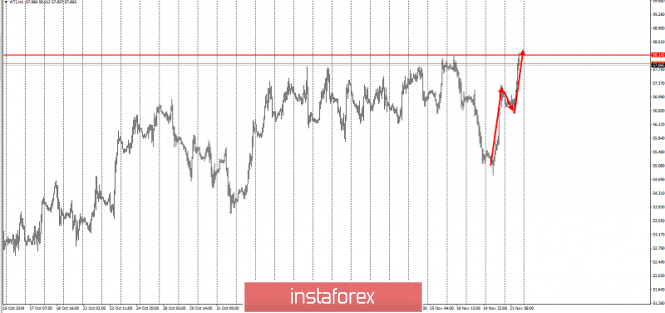
| Developing the trading idea for oil Posted: 21 Nov 2019 04:46 PM PST Good evening, dear traders! Congratulations to those who took advantage of our trading recommendation for oil. So, the trading idea for oil was to develop the increase according to the plan which was mentioned a while ago. At the end of the day, we have the perfect development: It can be recalled that the idea was based on fundamental data on low oil reserves in the United States and thus, we should actually develop the third wave from this news. As you already know, the three-wave in trading is a fairly stable pattern, however, the fundamental three-wave is actually a terrible force for profit. Good luck in trading and see you on new trading ideas! The material has been provided by InstaForex Company - www.instaforex.com |
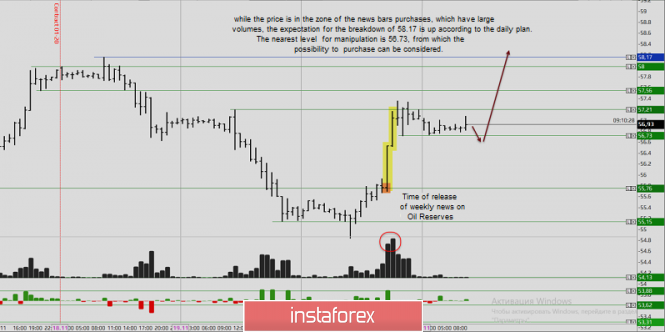
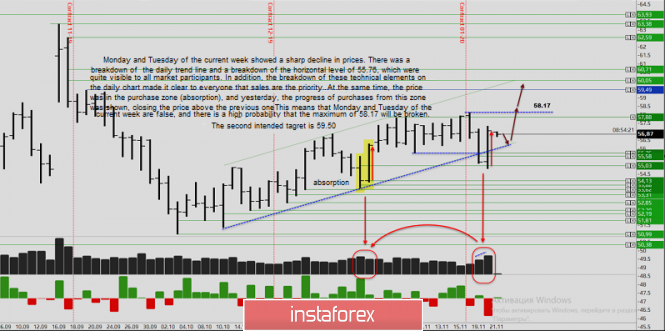
| Volume analysis and trading idea for oil Posted: 21 Nov 2019 03:45 PM PST Greetings, dear traders! I present to you the volume analysis for oil. Monday and Tuesday of the current week showed a sharp decline in prices. There was a breakdown of the daily trend line and a breakdown of the horizontal level of 55.76, which were quite visible to all market participants. In addition, the breakdown of these technical elements on the daily chart made it clear to everyone that sales are the priority. At the same time, the price was in the purchase zone (absorption), and yesterday, the progress of purchases from this zone was shown, closing the price above the previous one. This means that Monday and Tuesday of the current week are false, and there is a high probability that the maximum of 58.17 will be broken. The second intended target is 59.50. Yesterday, very weak data on oil reserves was published in the United States, which pushed oil to increase. On the other hand, while the price is in the zone of the news bars purchases, which have large volumes, the expectation for the breakdown of 58.17 is up according to the daily plan. The nearest level for manipulation is 56.73, from which the possibility to purchase can be considered. Have a successful trading! The analysis is given on the futures of American oil. Thus, it is recommended to move trading levels which are relative to the candlestick bodies. The material has been provided by InstaForex Company - www.instaforex.com |
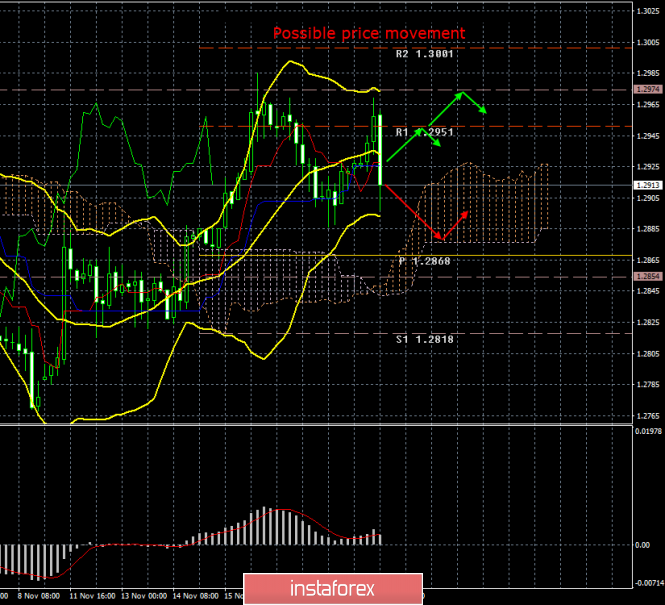
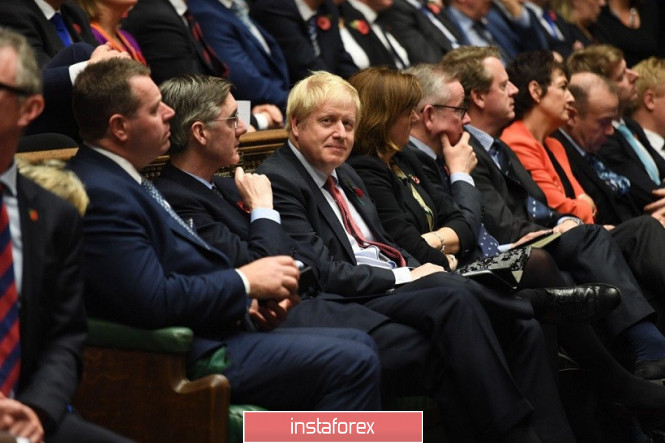
| Posted: 21 Nov 2019 02:43 PM PST 4-hour timeframe Amplitude of the last 5 days (high-low): 63p - 52p - 81p - 60p - 44p. Average volatility over the past 5 days: 60p (average). The British pound paired with the US dollar started to come to life today in the afternoon. So far, the movement of the GBP/USD pair is still characterized as "semi-lateral" and low volatility, nevertheless, the US dollar rose by 60 points in just a few hours today at the US trading session. There are certain hopes that the period of uncertainty for the pair will end. From our point of view, the general fundamental background does not change at all. We still believe that the pound can only move in one direction now - down. In recent weeks, the bulls have been able to restrain the bearish outbursts for the pair's new sales thanks to optimism regarding the victory of Conservatives in the Parliament elections. However, above the level of 1.3000, the bulls failed to consolidate their success, which means that there are a sufficient number of doubts among market participants about the unequivocal victory of the Conservatives. There are several factors that make it doubtful that the election will end with the necessary Conservative victory.The first, probably the most important, is historical. In an attempt to consolidate their political influence, which would allow Brexit to be realized, Theresa May arranged for re-election to Parliament. However, then the Conservatives not only failed to increase their presence in Parliament, they only worsened it. Who said that now the election results will be radically opposite? Many experts and the electorate note the strength of Boris Johnson as a politician. Many support him as prime minister. However, this does not mean that the Conservative Party will collect 50% of the vote. The second factor is coalition. If in total the Conservatives will collect more seats in the Parliament, but the Labour Party will cooperate with other opposition forces, then Brexit will again be blocked. Then the question will be posed differently: with whom can Conservatives cooperate and how many votes will they have in Parliament in this case? From our point of view, all these calculations are fortune-telling on coffee grounds. You need to wait for the elections, wait for the results, then draw conclusions. Meanwhile, the Labour party, feeling that the Conservatives were ahead of them in all ratings, unveiled a manifesto detailing the party's program. Among the main promises of Corbyn - the construction of social housing, a new deal on Brexit, a referendum at which residents of the UK will be asked to choose between a deal and the cancellation of Brexit. The Labour leader also promises to make education at universities in the UK free. "This is a manifesto of hope. A manifesto that will bring real change," Corbyn said. Also, the Labour leader once again pricked Johnson, saying that he was going to steal the British health care system and sell it to American companies. The Labour leader did not forget about the main supporters of the Conservatives - bankers and billionaires, saying that taxes for the rich will be raised, as well as the level of minimum wages in the country. All of these promises, according to Corbyn should help Labour collect more votes. Well, the pound, despite a small uptick in activity today, generally remains in an incomprehensible movement. It was not possible to escape above the level of 1.3000 even from the third attempt, a new approach to the downward trend? From a fundamental point of view, this is a reasonable option for the development of events, given the failed reports from the UK last week, which were not worked out by market participants. Trading recommendations: GBP/USD continues to adjust. Thus, traders are advised to wait until the situation is cleared up, since there is no possibility to trade for an increase due to the location of the price below the Kijun-sen line. Short positions are formally relevant now, but in small lots, since there is no dead cross at the moment, and quotes are located above the Ichimoku cloud. Explanation of the illustration: Ichimoku indicator: Tenkan-sen is the red line. Kijun-sen is the blue line. Senkou Span A - light brown dotted line. Senkou Span B - light purple dashed line. Chikou Span - green line. Bollinger Bands Indicator: 3 yellow lines. MACD indicator: Red line and bar graph with white bars in the indicator window. Support / Resistance Classic Levels: Red and gray dotted lines with price symbols. Pivot Level: Yellow solid line. Volatility Support / Resistance Levels: Gray dotted lines without price designations. Possible price movements: Red and green arrows. The material has been provided by InstaForex Company - www.instaforex.com |
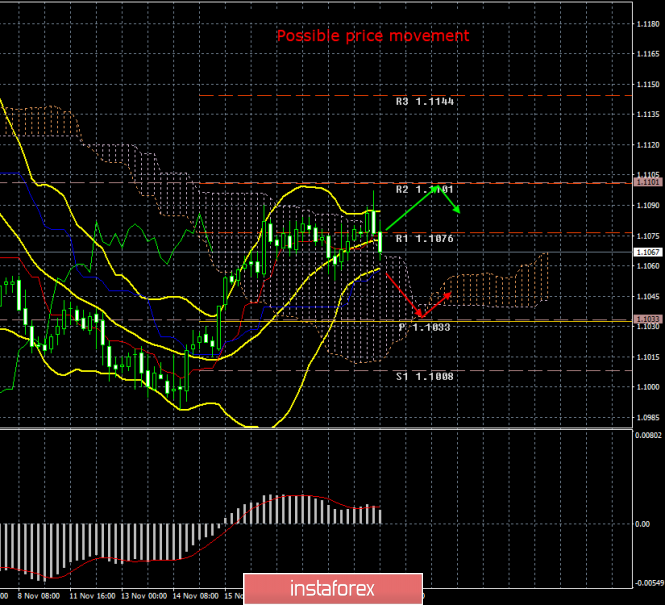
| Posted: 21 Nov 2019 02:43 PM PST 4-hour timeframe Amplitude of the last 5 days (high-low): 39p - 42p - 40p - 21p - 28p. Average volatility over the past 5 days: 34p (low). The EUR/USD currency pair was still bored and uninteresting on the penultimate trading day of the week. This is due to the same lack of any macroeconomic reports in the United States and the European Union. If you look at the pair's movement chart, you get the impression that today there was quite a frisky movement, but in fact the pair's volatility remains ultra-low and today is no exception. Yesterday's publication of the minutes of the last meeting of the Federal Reserve's monetary committee did not cause any reaction today, either at the European trading session or at the US one. The US currency slightly strengthened in the second half of the day, but it does not mean anything at all and does not specify the current picture for the euro/dollar pair. The euro bulls managed to update the highs of two days ago with grief in half, but, as usual, they did not have enough strength. At the moment, quotes have again returned to the Kijun-sen critical line. Meanwhile, headlines regarding the topic of the trade conflict between the US and China do not disappear from the tabloids. We have already written in recent days that the main snag at the moment is the overstated requirements of both parties. China is demanding the abolition of almost all duties, and the United States is demanding that China buy agricultural products from American farmers by no less than $50 billion a year, and also solve the main problems related to intellectual property. In addition, today it became known that the US Senate is considering a bill that provides support for activists in Hong Kong who are protesting against the new policy of China regarding the extradition of Hong Kong residents. At the moment, Hong Kong has a special autonomy status and some Chinese laws do not apply to it. China decided to pass an appropriate law allowing it to control Hong Kong more, and so mass protests began and have not stopped for several months. The US Senate decided to enact the Hong Kong Human Rights Act to curb violence against protesters. If China does not stop the violence, the United States will impose new economic sanctions. That is, if Hong Kong's autonomy continues, then a special trade status and trade preferences remain, if not, a new round of economic pressure on China will begin. It is clear that the Chinese government does not like such interference in internal problems by America and the country has already made an official statement warning the White House that any serious adoption of laws on Hong Kong will be followed by a serious response. As you can see, in this situation we are not talking about the movement of the parties towards each other. Yesterday, US President Donald Trump said: "I do not think that they (negotiations) are moving to the level that I want." Earlier, the odious US leader also said that it was China that should make concessions and sign the agreement that is beneficial to the United States. Based on the fact that the parties are not ready to meet each other's requirements, the signing of the agreement can be postponed to 2020. And, from our point of view, it is not worth expecting a deal before 2020. Now it is already a matter of preventing the parties from introducing new portions of duties and economic sanctions. If the US Senate approves the Hong Kong Act, Beijing is unlikely to stand aside and will certainly take countermeasures. This means a new round of escalation of the trade conflict, which this time can no longer be identified as a trade. All this potentially means new problems for the global economy, as well as for the economies of the US and China. And in terms of the euro/dollar currency pair, this means a possible new slowdown in economic indicators and the growth of the US economy, but also of the European Union, whose economy is closely connected with both the Chinese and the American. It is unlikely, of course, that this will happen in the near future, but in the future it is quite possible to expect such a scenario. So far, the parties are continuing a verbal skirmish. Chinese Foreign Minister Geng Shuang said: "We urge the United States to sort out the situation and stop its illegal activities before it is too late, not allowing this act to become law and immediately stop interfering in Hong Kong's affairs and China's internal affairs." So now everything is Donald Trump, who can either sign the law or veto it. However, according to experts, even a veto may not save the situation if more than two-thirds of the Senate supports the bill. Thus, traders can only follow the development of events and hope that the trade conflict does not escalate even more. The currency pair has not yet responded to news on this topic, but in the future, everything may change. And in the case of the introduction of new sanctions or the abolition of trade preferences to Hong Kong, this will again be reflected in the slowdown in the global economy. At the moment, the euro/dollar is again adjusted. A price rebound from the Kijun-sen critical line could trigger a new round of upward movement. But given the low volatility, the trading pair is now extremely uncomfortable anyway. Trading recommendations: The EUR/USD pair has started to correct again. Thus, it is now recommended to wait until the completion of the current correction, and then consider the pair's purchases, but only in small lots, since the current movement is still identified as corrective. We recommend that you wait until the level of 1.1101 is overcome for euro purchases. It is recommended to return to the pair's sales no earlier than consolidating the euro/dollar pair below the critical Kijun-sen line with the target level of 1.1033, but also with very small lots. Explanation of the illustration: Ichimoku indicator: Tenkan-sen is the red line. Kijun-sen is the blue line. Senkou Span A - light brown dotted line. Senkou Span B - light purple dashed line. Chikou Span - green line. Bollinger Bands Indicator: 3 yellow lines. MACD indicator: Red line and bar graph with white bars in the indicator window. Support / Resistance Classic Levels: Red and gray dotted lines with price symbols. Pivot Level: Yellow solid line. Volatility Support / Resistance Levels: Gray dotted lines without price designations. Possible price movements: Red and green arrows. The material has been provided by InstaForex Company - www.instaforex.com |
| GBPUSD atmosphere: the pound only reacts to political battles in Britain Posted: 21 Nov 2019 02:43 PM PST While the main dollar pairs are closely monitoring the news flow regarding the prospects for US-Chinese relations, the pound-dollar pair continues to trade in its "coordinate system", responding to local fundamental factors. The election campaign in the UK is in full swing, so all the news related to the possible outcome of the plebiscite has a strong influence on the dynamics of GBP/USD All other fundamental factors have traditionally been indirect and secondary. For example, the day before yesterday, a televised debate took place between Boris Johnson and Jeremy Corbyn. Despite the nominal victory of the current prime minister, the pound was under pressure as it fell against the dollar by the middle of the 28th figure. Traders expected more from Johnson: more convincing rhetoric, more decisive theses and a more impressive distinction from the main competitor. But according to a YouGov poll, he did not impress the British, defeating Corbyn by a margin of only 2 percentage points. 51% of the viewers voted for Johnson while 49% for the Labour Party. And although this survey cannot be projected onto the ranking positions of Conservatives and Labour (since only one and a half thousand citizens took part in the survey), traders were concerned about such an uncertain result. Neither Johnson nor Corbyn announced any fundamentally fresh ideas. The prime minister insisted that his deal with Brussels is the best option for the deal, while his opponent expressed a radically different opinion - according to Corbyn, Johnson only worsened Britain's position in the negotiations, and the deal he proposed was even worse than Theresa May's Chequers Plan. The head of the British government insisted that Brexit should take place before January 31 on the basis of his deal, while the opposition leader urged him to put the document to a referendum. When Johnson asked his opponent if he would support the deal in this case or would actually call for a "hard Brexit," Corbin did not give a clear answer. After that, the prime minister criticized him for populism and the lack of any constructiveness. Nevertheless, according to the respondents, Corbyn was more convincing in other areas, for example, 54% felt that he coped well with the topic of health. Despite the nominal victory, the results of the debate were not in favor of the British prime minister: according to the latest YouGov polls, the gap between Conservatives and Labour is narrowing: Tories support at 42% (three points less than last Saturday), Labor at 30% (an increase of two points). In addition, other participants in the election race also recalled themselves: the leaders of the Liberal Democratic and Scottish National Parties expressed their indignation that only Johnson and Corbyn (who in one way or another advocate Brexit) were invited to the debate, while the opinion of millions of British who want stay in the European Union was ignored. Such a fundamental background forced GBP/USD traders to shift to the middle of the 28th figure - the pair showed a sluggish, but still a downward movement at the beginning of the week. True, the bears could not fall below 1.2860. In general, downward impulses must now be treated with particular caution: the pound is keenly reacting to negative political news, but is recovering just as quickly on any positive. For example, today the results of the Savanta ComRes study, according to which the Labour Party continues to lose electoral points, was announced today, as the positions of the Conservatives look more confident. Now the Tories are ahead of the opposition by 12 percentage points - this is the highest gap since the last election held in 2017. In addition, according to surveys by British newspaper The Telegraph, many Labour supporters revised their political views in favor of Conservatives. Almost 20% of those who have previously voted for Corbyn are now ready to cast their votes to Johnson. Most of them do not believe in his ability to withdraw the country from the European Union. But Johnson, according to "ex-Labour supporters", will fulfill this mission without any hesitation. Such results are explained by the fact that many Britons are tired of years of uncertainty, while Corbyn can significantly prolong this period. In addition, Johnson does not insist on a hard Brexit, but on a civilized one, while the leader of the Labour Party changed his position on this issue several times: at first he wanted to hold a second referendum on Brexit, then he abandoned this idea, and now he is lobbying the referendum again - but with regard to the conditions for withdrawal from the EU (the Brexit issue itself is no longer in dispute with them). Conservatives continue to gain momentum amid such inconsistency of the Labour Party, thereby supporting the British currency. I repeat - the GBP/USD prices should be taken with extreme caution to the downward "arches". Let me remind you that according to Johnson, each candidate from the Conservative Party signed a written pledge that, if elected, he would vote for the draft deal with Brussels proposed by the prime minister. Therefore, the possible victory of the Conservatives is now quite reasonably associated with the resolution of the long-term "divorce proceedings". If the gap between the Conservatives and the Labour Party continues to increase, the pound paired with the dollar will enjoy a kind of immunity from the influence of other fundamental factors (including American ones). Another poll from YouGov (if it will be in favor of the Tories) will help the GBP/USD bulls again approach the 30th figure. The material has been provided by InstaForex Company - www.instaforex.com |
| Analysts have given the most accurate USD/JPY annual forecast in history Posted: 21 Nov 2019 02:43 PM PST Analysts forecast for USD/JPY at the end of this year was the most accurate since 2006, according to Bloomberg. The success of the forecasters is due to the fact that the annual trading range in this currency pair has become the narrowest in the history of observations. At the beginning of 2019, a consensus assessment of analysts surveyed by the agency suggested that the USD/JPY rate would be 108 yen per dollar at the end of December. Despite three Federal Reserve interest rate cuts, the yen has now strengthened against the greenback by only 1%. This year, the USD/JPY currency pair was trading in the band of 104.46–112.40 - the narrowest trading range in history. The trade war between the US and China, as well as concerns about a slowdown in the global economy, stimulated the demand for the yen. However, seasonal factors and the Japanese investors' steady demand for foreign assets did not allow JPY to firmly strengthen. Moreover, the range of opinions on what to expect from the Japanese currency next year is quite wide. The most bullish forecast implies strengthening to 96 yen per dollar, and the most bearish forecast - weakening to 116. In particular, Citigroup experts note that the USD/JPY rate has shown a downward trend since 2015. They expect this trend to continue in 2020. "The difference in yields between the US and Japan already indicates a return of the USD/JPY rate to 100 yen per dollar or even lower," they said. The material has been provided by InstaForex Company - www.instaforex.com |
| Dollar could disappoint investors next year, while the euro and the pound might be pleasing Posted: 21 Nov 2019 02:43 PM PST The single European currency could rise in price to $1.19 by the end of 2020, as the greenback is likely to weaken, UBS strategists predict. "In recent years, high interest rates in the United States, aversion to the risks associated with a downturn in world trade, and US government measures to repatriate income have supported the dollar," they said. "Over the next year, economic growth and interest rates in the United States will become closer to what other countries in the world have. At the same time, the uncertainty ahead of the US presidential election and the weakening influence of trading tariffs on Forex suggest a weaker dollar," according to UBS. NatWest analysts recommend holding long positions on the euro, provided that Germany decides to provide significant fiscal stimulus. "While investors are skeptical of Germany's budget incentives, we think they will follow. If we are right, then we will go through Germany's lowest growth rate next year. At the same time, the era of monetary stimulus in Europe is finally coming to an end. Other factors that bode well for the single European currency include a weakening of political risks in the region and a recent decrease in the ECB's deposit rate by 10 basis points," they said. "A cocktail of three cuts in the Federal Reserve's interest rate, outflow of investments and potential US and Chinese deal is likely to weaken the dollar," Insight Investment analysts said. According to them, this will benefit the exhausted euro, which can strengthen by about 4% to $1.15 next year. Strategists at Merrill Lynch and Bank of America predict that by the end of 2020, the pound will rise by almost 8% against the US dollar and reach $1.39. It is assumed that in the early elections in the UK, which will be held on December 12, Conservatives will receive an absolute majority in Parliament. This will allow ratifying the agreement on the United Kingdom's exit from the European Union, and the country will be able to leave the bloc before January 31, 2020. Recent opinion polls show that Tories are ahead of their competitors ahead of a key date. Other reputable US banks also expect the strengthening of the British currency. So, Morgan Stanley advises buying the pound against the US dollar with a target of $1.40 and calls this recommendation one of the best strategies for the coming year. JPMorgan Chase predicts a rise in the British currency to $1.33 by mid-2020, while Goldman Sachs predicts it will strengthen to $1.35 in the coming months. The material has been provided by InstaForex Company - www.instaforex.com |
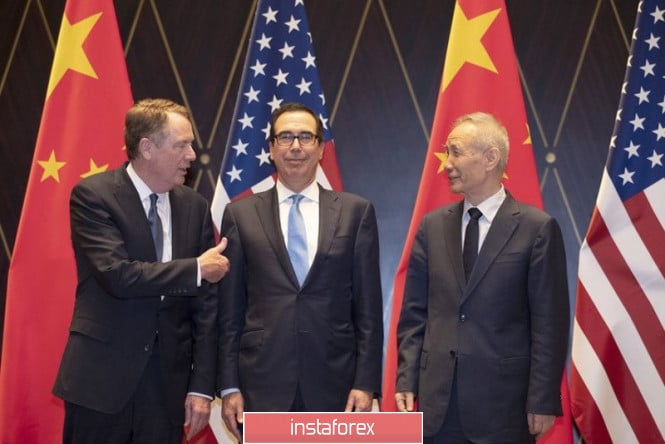
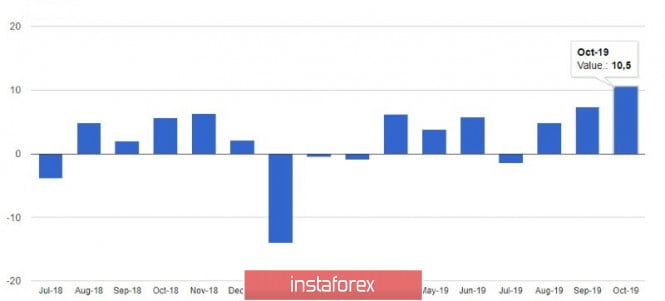
| Posted: 21 Nov 2019 02:43 PM PST The news that the chief negotiator from China invited American colleagues to hold new trade negotiations, supported the euro in the morning and reduced the tension that emerged earlier this week after Donald Trump said Beijing deliberately slows down and drags out negotiations, refusing to make concessions. As it became known today, a telephone conversation took place in which Liu He, who heads trade negotiations with Washington, invited US Trade Representative Robert Lighthizer and Finance Minister Stephen Mnuchin to Beijing. The American side expressed its readiness for a personal meeting, which allows counting on progress in the negotiations and the signing of its first phase. However, White House representatives also noted that the meeting can only take place if China makes it clear that it is ready to assume the obligations set forth in the trade agreement regarding the purchase of agricultural products, as well as with the protection of intellectual property and technology transfer. The Chinese side expects the aforementioned meeting to take place next Thursday, which is due to Thanksgiving in the United States. As for the fundamental data, in the morning there was only an index of sentiment in the business circles of France, which showed growth to 100 points in November this year against 99 in October, indicating positive changes. Economists predicted that the index would remain 99 points in November. The report, which was published today by the Organization for Economic Cooperation and Development, clearly coincides with the expectations of many economists and experts in this field, and therefore the reaction to it was corresponding. According to the data, the OECD no longer expects acceleration of global economic growth until 2021, and this is directly related to the escalation of the trade conflict between the US and China, which can only complicate the situation in the global economy. Global economic growth is expected to be 2.9% in 2020 and 3% in 2021. The OECD previously forecast global economic growth in 2020 at 3%. In this regard, economists have urged countries to engage more actively in fiscal policy to support growth. US GDP growth is expected to slow down to 2% in 2020 and 2021, and China's GDP growth is projected to slow down in 2021 to 5.5%. The German economy will generally show growth of only 0.4% in 2020 against the latest forecast of 0.6%. The resolution of the US trade conflict with developed countries, including China, of course, will support the global economy, returning it to its former path of development. As for the technical picture of the EURUSD pair, the bulls again failed again and failed to break above the resistance level of 1.1090. However, the bullish scenario can still be realized after it is possible to overcome this maximum. This will continue the upward correction to the area of levels 1.1110 and 1.1140. However, the probability of a downward correction should not be ruled out, since a break of the major support of 1.1050 may push the pair even lower and return it to the lows of 1.1020 and 1.0990. GBPUSD The British pound is gradually strengthening its position against the US dollar, but the growth is quite moderate, as traders are waiting for the publication of the election manifesto of the British Labour Party, which will attract new voters to its side. Reducing the advantage of Conservatives, of course, will negatively affect the position of the British pound, which is growing on expectations that the Tory party will get a majority in the elections scheduled for December 12 this year, and British Prime Minister Boris Johnson will be able to withdraw the country from the EU under an agreement that he agreed at the end of this summer. The data on the number of borrowings of the UK public sector were of no interest to anyone. The report indicated that growth amounted to 11.2 billion pounds in October against 8.9 billion pounds a year earlier. Economists predicted an increase in borrowing from the UK public sector in October at 9.2 billion pounds. The public sector's net cash requirement fell by 0.7 billion pounds in October from -4.2 billion pounds a year earlier. As for the technical picture of the GBPUSD pair, the buyers regained the resistance of 1.2935, which now acts as a support, which could positively affect the further strengthening of the trading instrument. Bulls are aiming for new highs around 1.2980 and 1.3020. The downward correction will be limited by the large level of 1.2890, which was formed yesterday. The material has been provided by InstaForex Company - www.instaforex.com |
| EUR/USD: the Fed did not provide new information to the market, the ECB's turn Posted: 21 Nov 2019 02:43 PM PST A Reuters report stating that the trade deal between Washington and Beijing will not be signed in 2019 has excited market participants more than the publication of the minutes from the October meeting of the Federal Reserve. China is demanding more concessions from the United States for a deal. The American side is heating up the situation. The US Senate passed a bill to support protesters in Hong Kong, and White's head Donald Trump said that without signing the first phase of the agreement, tariffs on Chinese goods will be increased. Five weeks ago, US Treasury Secretary Stephen Mnuchin announced that this deadline would be enough to complete trade negotiations under phase 1. However, time has passed, but the situation has not changed. Although Beijing representatives claim that the deal can be concluded in early December, and Chinese Vice Premier Liu He remains cautiously optimistic, so far these are just words. The Rubicon could be on December 15. The next increase in US tariffs by $156 billion in Chinese imports is scheduled for this day. If the White House postpones this decision, it will be an indication that the negotiations between Washington and Beijing are going well. Otherwise, another escalation of the trade conflict will follow. It should be noted that the trade war is one of the important factors in changing the Fed's worldview. A minutes released yesterday from the October FOMC meeting stated that the US central bank continues to significantly consider the risks of the prospects for global economic growth and international trade. The regulator also expressed concern that the problems of industry, export and business investment may have a negative impact on the US labor market, which will slow down consumer activity and the growth of national GDP. At the last meeting, Fed officials talked a lot about the threats to the US economy, but they ignored factors that could lead to tightening monetary policy. This allowed Nordea to evaluate the mood inside the FOMC as dovish. The EUR/USD pair reacted to the publication of the minutes from the October meeting of the Fed by declining, but then it managed to recover quite quickly. Now the filing goes to the side of the ECB. However, investors are unlikely to see anything new in the report from the last meeting of the Governing Council. Most likely, the denouement will come on Friday. Data on business activity in Germany and the eurozone for November will be released tomorrow, and ECB President Christine Lagarde will unveil her views on monetary policy. If the latter will differ from the position of its predecessor, Mario Draghi, then the EUR/USD bulls will receive a serious argument in favor of continuing the rally, at least to 1.1200. The material has been provided by InstaForex Company - www.instaforex.com |
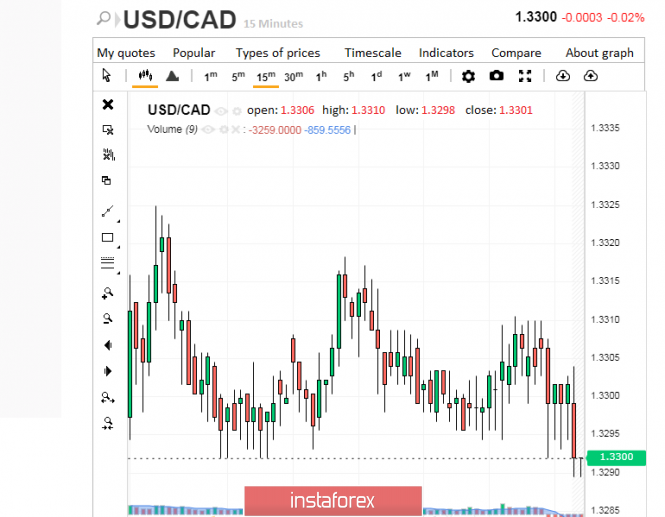
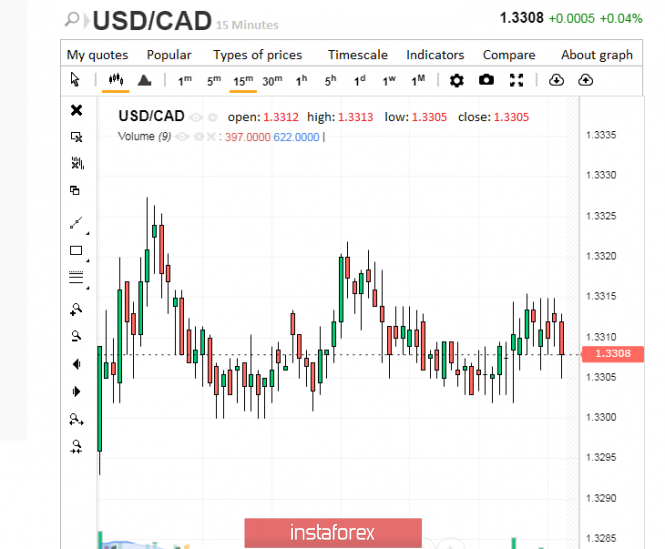
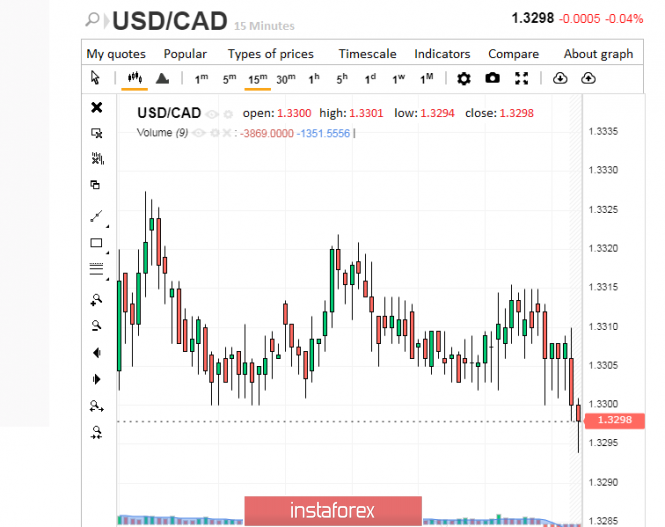
| Competitor suppresses: Canadian dollar is hard to resist USD Posted: 21 Nov 2019 02:43 PM PST The Canadian currency came under strong pressure this week from its neighbor, the US dollar. Fuel added to the fire risks associated with the difficulty of concluding a "first phase" trade agreement between Washington and Beijing. The current situation strengthened the greenback and weakened the Canadian dollar, analysts said. At first glance, nothing portended a noticeable subsidence of the Canadian currency. According to Carolyn Wilkins, Deputy Governor of the Bank of Canada, the country's economy is "in good shape" and can even cope with the worsening situation in the global economy. The ministry believes that Canada's financial system is very stable, and the regulator has room to maneuver at a key rate of 1.75%. However, the rainbow mood quickly gave way to a more critical understanding of reality. Wilkins further stated that increasing risks for the global economy, such as the escalation of trade confrontations, could create problems for the Canadian economy. The Bank of Canada also noted increased uncertainty around global trade, creating a tense external background. The sharp collapse in oil prices was also a source of pressure for the loonie. Last week, WTI oil futures fell 3.2%, while the light grade was trading at $55.21 a barrel. This is the lowest figure since October 31 this year, experts said. Investors are worried that in 2020, the market may face excessive oil supply and weak demand for raw materials. Currently, the Canadian dollar, along with the Australian and New Zealand, has come under pressure from the growing US currency. Despite rising inflationary pressures, The loonie dropped to a five-week low against the greenback. The USD/CAD pair returned to 1.3300 on Wednesday, November 20. It tested this level again on Thursday. Analysts believe that the pair is preparing to storm the October highs. The Canadian dollar sharply fell at the beginning of the week, but USD/CAD pair was able to slightly strengthen its position yesterday. The pair rose to the level of 1.3308 on Thursday, November 21, but could not stay at this height. In the future, the USD/CAD pair was in the grip of a downward trend. Passing the key level of 1.3300, it dropped to 1.3398–1.3299. Now the pair is trading in this range, trying to get out of it and rise higher. Analysts suggest that the USD/CAD pair may fall to a significant support level of 1.3227. In the case of this scenario, analysts recommend using long positions. Market players consider a breakout of this level of support as a signal for selling the loonie. However, experts believe that the best times will come for the Canadian dollar, and Canada's strong economy will help it rise. The material has been provided by InstaForex Company - www.instaforex.com |
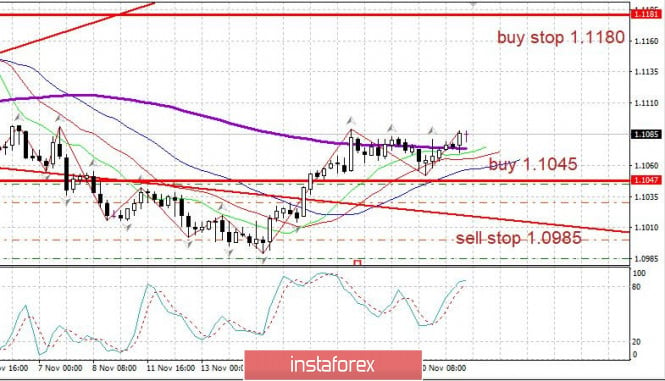
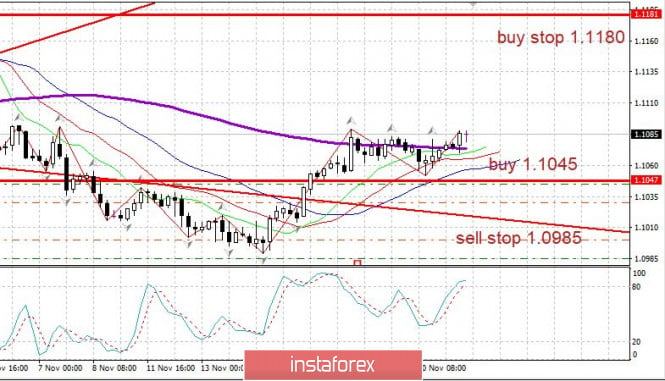
| Trader's diary 11/21/19 EURUSD Posted: 21 Nov 2019 02:42 PM PST About politics. The elderly political giant of the US - Henry Kissinger - warned: the US and China are on the verge of a new Cold War -2 - and the consequences from it will be no less than from War-1, if this is not stopped. Kissinger - in politics, is roughly like Alan Greenspan - in finance. There are reasons. Trump unleashed a tariff war against China - this could be attributed to Trump's tyranny, but the problem of China exists in reality. It all started in the late distant 1970s. In China, another great one - Deng Xiao Ping - turned China to a market economy after Mao's insane state socialism. The US enthusiastically supported China's turn to the United States - especially despite the fact that it broke the united front of the socialist countries led by the USSR against the west. Thus, the 40-year history of economic embrace of the US and China began. China has greatly benefited from the opening of US trade and investment. At the same time, the United States almost always turned a blind eye to the clearly non-democratic order in China, maintaining power in the hands of the Communist Party, and violating human rights. However, China has grown so much that it presses the United States from first place in the world in terms of economy. If you count on PPP - China's GDP is already greater. than the US GDP (at face value so far less). China has almost caught up with the US in terms of technology - "almost" - is of tremendous importance. The USSR, which was highly developed technologically - in the defense sphere - approached the United States in the most key defense technologies for a distance of about five years - by 1980 - but could not bridge the gap and could not withstand the strain of the race. All that China could get from borrowing open technology - it received. Next, the issue of critical technologies. The question is about US leadership and security. And of course, the United States began to seriously fear China. Therefore, Trump is just an expression of collective fear of China. This is the background of the Trump-China trade talks. EURUSD: The great standing under 1.1085 - 1.1100 continues. We buy at the breakout of 1.1085. We sell from 1.0985. The material has been provided by InstaForex Company - www.instaforex.com |
| Dollar seeks to conquer the throne Posted: 21 Nov 2019 02:42 PM PST This week, the European currency managed to briefly strengthen its position and even encroach on the leadership, traditionally for the dollar. However, the greenback, having gathered his strength, again began the struggle for the throne in the EUR/USD pair. Experts are sure that the greenback will quickly restore the lost balance. The relative balance in the EUR/USD pair was violated due to the disruption of the "first phase" deal, which was planned to be signed between Washington and Beijing. Recall that the United States refused to abolish all duties on Chinese goods, and China, in turn, does not consider itself obligated to buy agricultural products from American farmers. At the same time, US President Donald Trump threatened another increase in tariffs in case Beijing refuses to sign the agreement. According to experts, the new deal is more beneficial to America than China, so the solution to this issue has stalled. The escalation of trade contradictions helps strengthen the US currency. The greenback has a powerful recharge thanks to a trade conflict between the two powers, analysts emphasize. The US economy is considered less vulnerable to a trade war and able to withstand colossal pressures. It was not very much influenced by such an event as the publication of the minutes of the meeting of the Federal Open Market Committee (FOMC) of the Fed, although the market feared unnecessarily hawkish policy of the regulator. However, the Federal Reserve decided to dwell on the issue of further rate cuts, believing that a sufficiently strong economy of the country does not require changes in current monetary policy. No change is expected in the near future, analysts emphasize. The European currency tried to rise amid instability, but these attempts were unsuccessful. The euro put the weak data on inflation in Germany, released on Wednesday, November 20. The report said that in October this year, the German producer price index fell by 0.2% after a slight increase of 0.1% in September. Experts consider the weakness of inflation indicators to be an important problem that the ECB is facing, which had previously lowered the negative deposit rate and launched an asset buyback program. The current problems of the euro were in the hands of the dollar. The greenback took advantage of the situation to once again strengthen. The EUR/USD pair reached a correction level of 1.1066 on Wednesday, November 20, which gave traders hope for continued growth in quotations. The pair began with a minor note on Thursday morning, November 21, which quickly turned into a major note. The EUR/USD pair has slightly grown since yesterday, but continued to remain at around 1.1073. In the future, the EUR/USD pair actively went up. At the moment, the pair runs in the range of 1.1079–1.1080, trying to move even higher. According to analysts, the bulls on the EUR/USD pair have long been trading near a strong level of 1.1080 and can not overcome this barrier. In order to get things off the ground, they need to reach the psychologically important mark of 1,1100, experts said. Only having overcome this level will they be able to count on moving to 1.1200 and testing this bar. According to experts, the US currency is confidently moving towards its goal - to maintain leadership positions and squeeze out not only the euro, but also safe haven currencies, like the yen. Currently, the greenback has managed to cope with its task, showing the market steady growth. Analysts are confident that fortune will be on the side of the dollar in the near future, which aims to win and never surrenders. The material has been provided by InstaForex Company - www.instaforex.com |
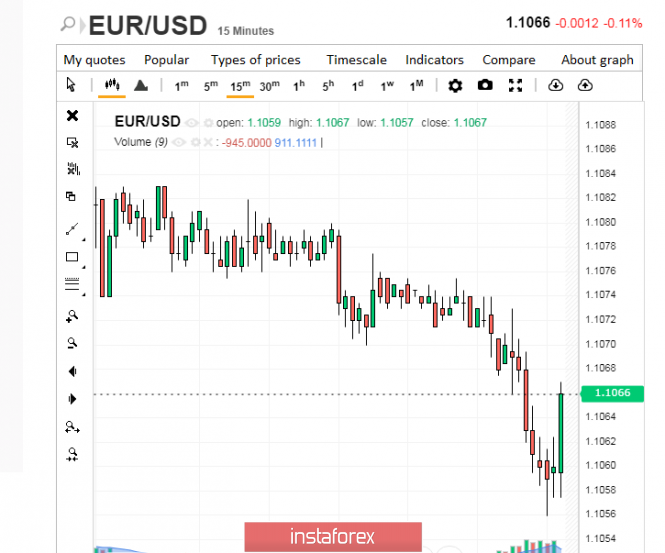
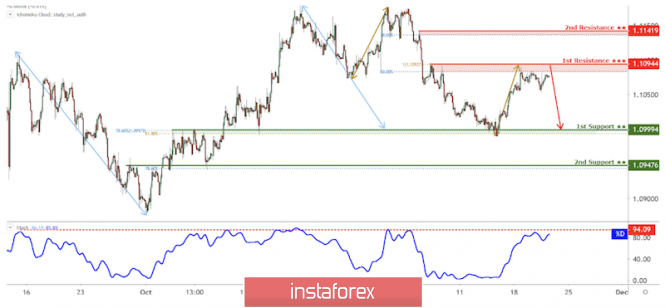
| EUR/USD approaching resistance potential drop! Posted: 21 Nov 2019 09:39 AM PST Price is approaching our first resistance where we are expecting a drop below this level. Entry: 1.10944 50% Fibonacci retracement, 100% Fibonacci extension, horizontal swing high resistance Take Profit : 1.09994 Why it's good : 61.8% Fibonacci retracement, 78.6% Fibonacci extension, horizontal overlap support
|
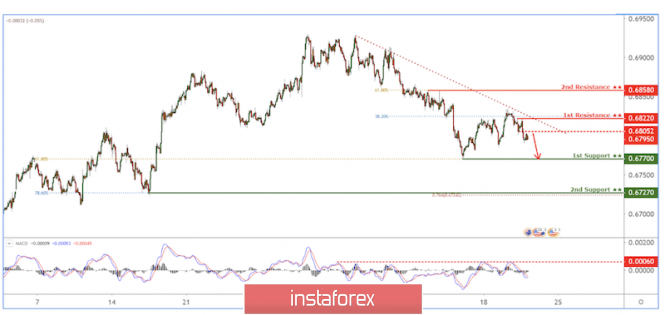
| Posted: 21 Nov 2019 09:36 AM PST AUDUSD drop in progress below resistance at 0.68220 Entry: 0.68220 38.2% Fibonacci retracement Take Profit : 0.6770 Why it's good : 61.8% Fibonacci retracement, Horizontal Swing Low
|
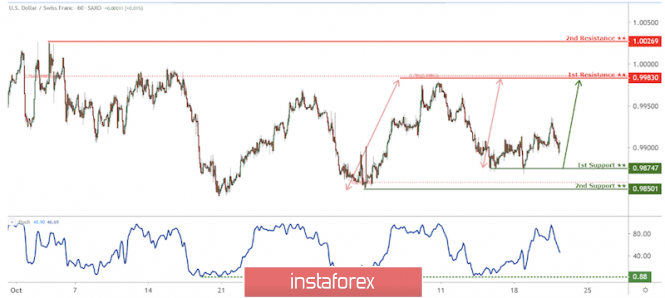
| USD/CHF to bounce from 1st support, potential rally! Posted: 21 Nov 2019 09:35 AM PST Entry: 0.9875 Why it's good: Horizontal swing low support 78.6% Fibonacci retracement Take Profit : 0.9983 Why it's good : 78.6% Fibonacci extension 76.4% Fibonacci retracement
|
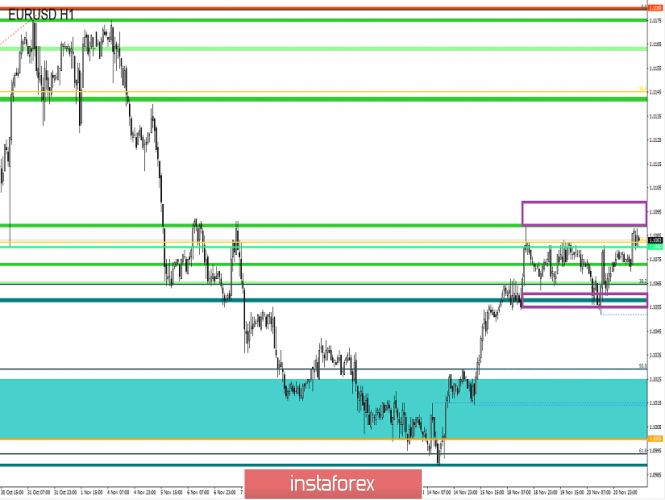
| Trading recommendations for the EURUSD currency pair – placement of trade orders (November 21) Posted: 21 Nov 2019 06:42 AM PST The control level has become a stumbling block, what to expect next and whether it is still necessary to consider the recovery process - we will answer these questions in the article. From technical analysis, we see how the range level of 1.1080 during the three trading days focused on itself, having a narrow accumulation phase of 1.1065/1.1080. There was an attempt of a downward move, but a clear breakdown of the area of 1.1060/1.1055 was not recorded, which resulted in a reverse movement, returning the quote to the range level. The characteristically low dynamics of the market did not give rest to many traders, as the decline in volatility paired with the accumulation gives a signal of momentum, which could not come. According to the law of logic and rational technical analysis, the acceleration, or the momentum, was considered in the downward direction, in the light that now, as it were, there is a recovery process and the first stage of 1.1080 plays the role of resistance. But it was not there, the earlier rebound from the second stage of 1.1000 quite strongly affected the volume of short positions, which are not just thinned, but, due to ambiguity, moved to the off-market stage. That is, trading volumes are low and they are expressed in sluggish sideways. This stage should not be delayed for a long time since this is not characteristic of the market, there is either a span or an expansion of the framework and the transition of accumulation to a full-fledged flat. Analyzing hourly past day, we see that the activity is low, but it can be found in the characteristic interesting candles. So, please note that at the time of the attempt to break the area of 1.1060/1.1055, long positions rose sharply, which just brought us back to the level of 1.1080. (15:00-17: 00 trading terminal time). As discussed in the previous review, speculators closely followed the framework of 1.1065/1.1080, in particular, the area of 1.1060/1.1055, where there was an attempt to breakdown, but there was a clear fixation of the price, while maintaining interest, and did not occur. Looking at the trading chart in general terms (daily period), we see the same tedious recovery process, which was hampered by external factors, and in fact, the quote is still in an oblong correction (min-1.0879; max-1.1180). The news background of the last day did not have in itself noteworthy statistics on Europe and the United States, but there was a publication of the text of the minutes of the meeting of the Federal Committee on Open Market Operations. Now, according to the minutes, most Fed members believe that the measures taken can support economic growth, a strong labor market and inflation near the 2% target. The most remarkable point was that the Fed officials consider negative interest rates an inappropriate tool of monetary policy in the United States. According to the regulator, negative rates can create complexity or distortion of the financial system. Regarding the December meeting, the information about the pause in the movement of the refinancing rate was confirmed. Today, in terms of the economic calendar, we have the publication of the minutes of the ECB meeting, but the most interesting event will be tomorrow's speech by its head Christine Lagarde, who has long remained silent about the further actions of the regulator. Let me remind you that, according to recent data, the inflation rate in the EU has slowed down, which further pushes the regulator from the set target levels. In terms of statistics, we have data on applications for unemployment benefits in the US, which should fall by 4K. After that, there will be data on sales in the secondary housing market, where an increase of 1.4% is expected. Further development Analyzing the current trading chart, we see a small impulse move that drove the quote just above the mark of 1.1080, but the pressure of the range level will remain. The breakdown of the control level has not yet occurred, so the area of 1.1095/1.1100 was not touched, and the fixing points are located below. In terms of volatility, the acceleration was conditional, as the indicators are still very low. Detailing every minute available portion of time, we see the same jump, expressed in the period 10:00. Probably, the entry of Europeans into the market locally fueled interest, but the keyword here is "locally". In turn, speculators are closely monitoring the control areas and points of flight relative to them, since, in connection with a three-day stop, there should be a jump in which you can make money. It is likely to assume that the existing fluctuation within the range level will continue for some time, and special attention will be paid to areas such as 1.1060/1.1055 and 1.1095/1.1100. That is, in this case, the work carries a wait-and-see process, where in the case of identification of fixation points relative to the specified areas will allow the most optimal entry into the market. When analyzing fixation points, it is necessary to look at the breakdown structure of these areas to understand whether we have a false touch. Based on the above information, we derive trading recommendations:
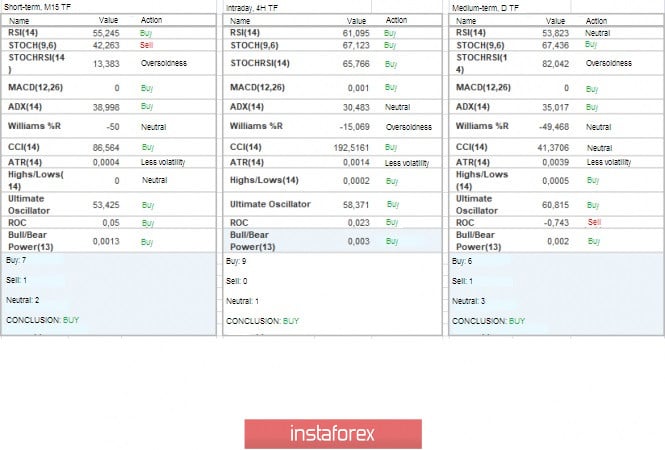
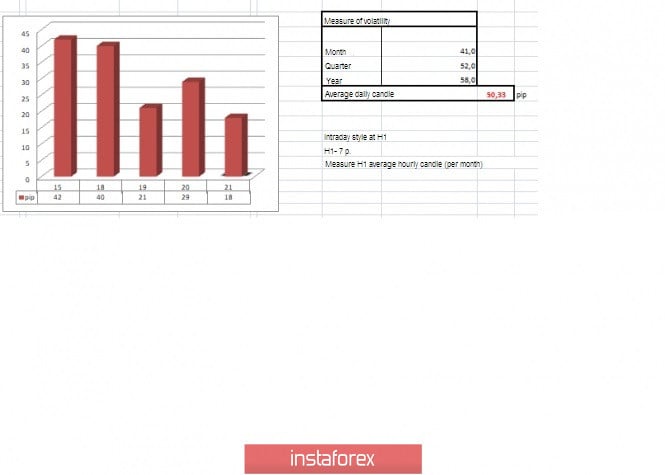
Indicator analysis Analyzing different sector timeframes (TF), we see that the indicators have taken an upward position relative to all major time areas. It is worth considering that while the quote is still within the range level, the ambiguity expressed in unstable readings remains in terms of indicator analysis. Volatility per week / Measurement of volatility: Month; Quarter; Year. Measurement of volatility reflects the average daily fluctuation, calculated for the Month / Quarter / Year. (November 21 was built taking into account the time of publication of the article) The volatility of the current time is 18 points, which is still far from the daily average. It is likely to assume that if the hovering within the given areas continues, then volatility will still be at low levels. At least some acceleration can occur in the case of the passage of the specified coordinates. Key levels Resistance zones: 1.1080**; 1.1180* ; 1.1300**; 1.1450; 1.1550; 1.1650*; 1.1720**; 1.1850**; 1.2100. Support zones: 1.1000***; 1.0900/1.0950**;1.0850**; 1.0500***; 1.0350**; 1.0000***. * Periodic level ** Range level *** Psychological level ***** The article is based on the principle of conducting transactions, with daily adjustments. The material has been provided by InstaForex Company - www.instaforex.com |
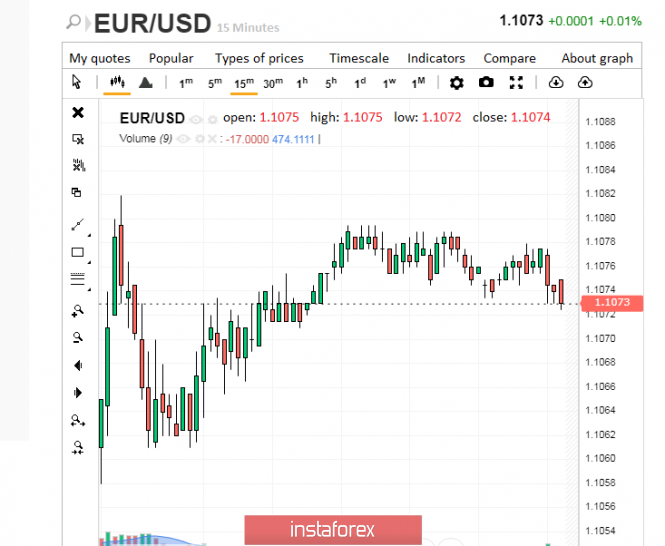
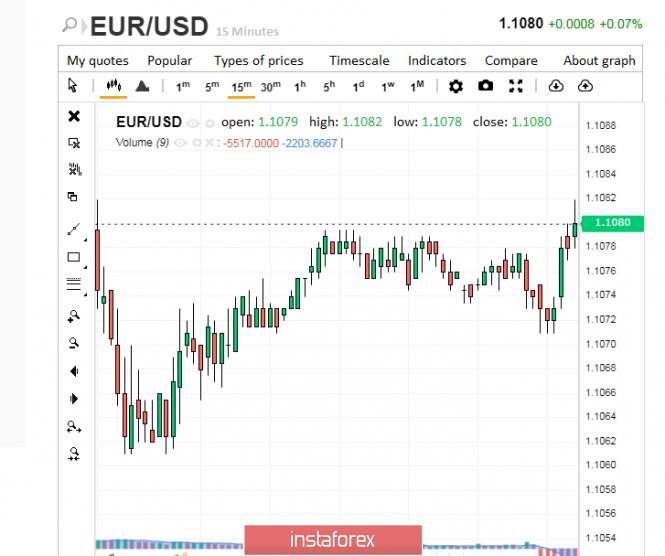
| Evening review EURUSD 11/21/2019 Posted: 21 Nov 2019 06:42 AM PST
In the market, the EURUSD pair makes a new attempt to break above the resistance zone 1.1080-1.1100. The strength of buyers is very weak, however, sellers still cannot push the euro down significantly - therefore, we consider the probability of a breakthrough higher. We keep purchases from 1.1045 and it already makes sense to put a stop at breakeven. You can buy from 1.1090. In the case of a reversal down, we sell from 1.0985. There is no new important news - the vicious struggle continues around the impeachment of Trump and the elections in Britain. The material has been provided by InstaForex Company - www.instaforex.com |
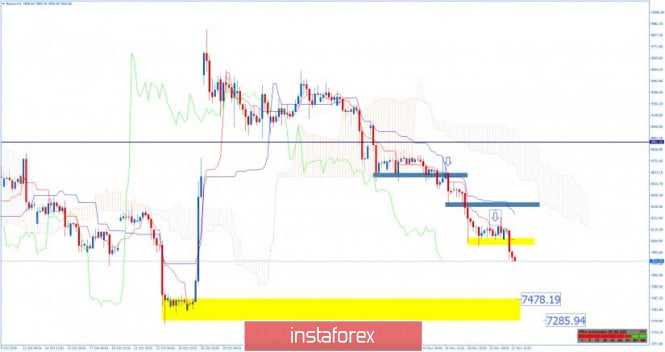
| BTC 11.21.2019 - All trends down, Bitcoin is aproaching our main downward target at $7.500 Posted: 21 Nov 2019 06:33 AM PST My analysis from yesterday is progress good and BTC is on the way to test my main target at the price of $7.478. All short-term trends are down and my advice is to hold sell position and add new sell position in case of the rally into the resistance at $8.000
Based on the Ichimoku analysis, all trends are down and there is no indication of the any reversal pattern yet, which is good confirmation that sellers are in total control. Downward targets are set at the price of $7.478 and $7.285. The material has been provided by InstaForex Company - www.instaforex.com |
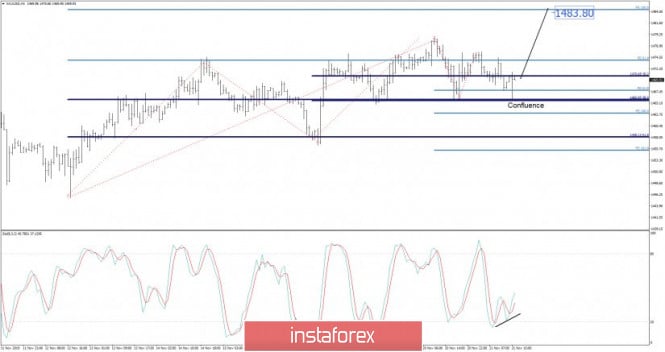
| Posted: 21 Nov 2019 06:11 AM PST Gold has been trading downwards at the price of $1.465 but I saw strong rejection and potential for upside rotation. I found major Fibonacci confluence at the price of $1.465 and exactly of that level buyers came in, which is for me strong sign the level was seen and accepted by most of traders.
My advice is to watch for buying opportunities on the dips on the lower frames 5/15 minute time-frames in order to time your entry better. Upward targets are set at the price of $1.477 and $1.483. Stochastic oscillator is showing oversold condition on the 1H time-frame and bullish divergence, which is sign that sellers got no power for further downside at the moment. The material has been provided by InstaForex Company - www.instaforex.com |
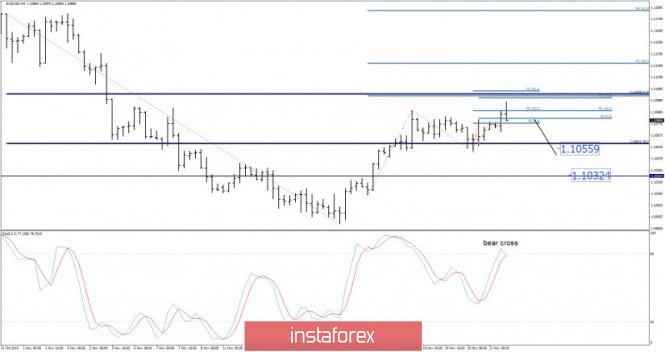
| Posted: 21 Nov 2019 06:02 AM PST EUR/USD has been trading upwards at the price of 1.1098 but I saw strong rejection and potential for more downside. A lot of Fibonacci confluence levels are set around the price of 1.1100, which is sign that there is still more potential for downside.
My advice is to watch for selling opportunities due to rejection of the multi Fibonacci node and strong resistance at 1.1100. Good level to place stop will be at 1.1120. Downward targets are set at the price of 1.1055 and 1.1032. Stochastic oscillator is showing overbought condition and fresh bear cross, which only adds more confirmation to my bear view. The material has been provided by InstaForex Company - www.instaforex.com |
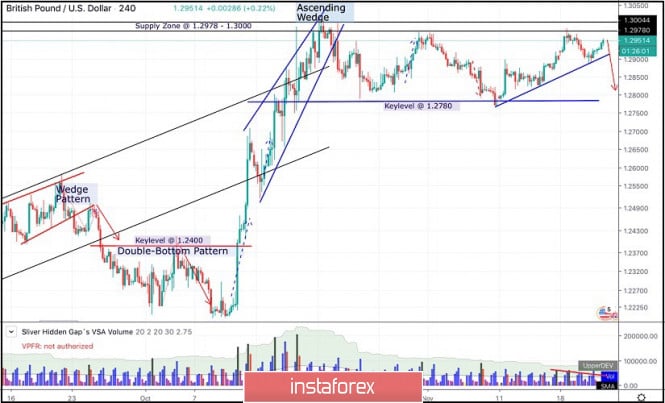
| November 21, 2019 : GBP/USD Intraday technical analysis and trade recommendations. Posted: 21 Nov 2019 04:43 AM PST
Few weeks ago, Further Bullish advancement was demonstrated towards 1.2650 then 1.3000 after the neckline of the depicted Double-Bottom pattern (1.2400-1.2415) was breached to the upside. Since October 21, the GBP/USD pair has failed to achieve a persistent bullish breakout above the depicted SUPPLY-zone (1.2980-1.3000) which corresponds to a previous Prominent-TOP that goes back to May 2019. Moreover, an ascending wedge reversal pattern was confirmed on October 22. This indicated a high probability of bearish reversal around the mentioned price zone. Hence, a quick bearish movement was anticipated towards 1.2780 (Key-Level) where bullish recovery was recently demonstrated on two consecutive visits. Recent bullish rejection around the price levels of 1.2780 indicated another bullish movement towards 1.2980-1.3000. Since then, the GBP/USD pair has been trapped between the mentioned price levels (1.2780-1.2980) until now. Technical outlook remains bearish as long as consolidations are maintained below 1.3000 on the H4 chart. Moreover, negative divergence is being demonstrated on the H4 chart. That's why, high probability of bearish rejection exists around the price levels of (1.2980-1.3000). A quick bearish breakout below 1.2875 (short-term uptrend) is needed to enable further bearish decline towards 1.2780 where a better decision can be taken upon recent price action. The material has been provided by InstaForex Company - www.instaforex.com |
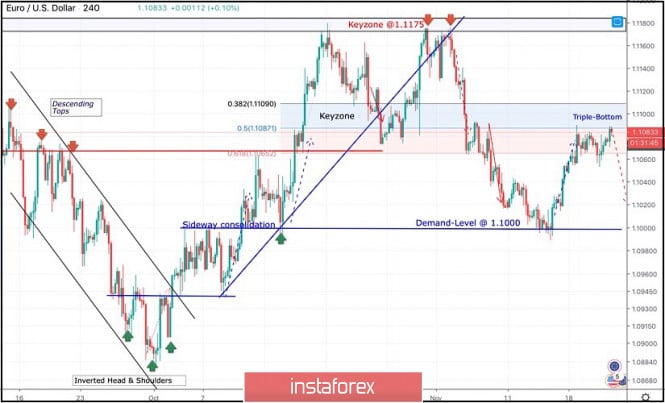
| November 21, 2019 : EUR/USD technical outlook predicts bearish reversal around 1.1090. Posted: 21 Nov 2019 04:42 AM PST
On October 2, an Inverted Head & Shoulders reversal Pattern was confirmed after a bullish breakout above 1.0940 (neckline) was achieved. This enabled further bullish advancement towards (1.1000 -1.1020) maintained above the depicted bullish trend. On October 7, temporary sideway consolidation range was demonstrated between the price levels of (1.1000 -1.0940) before further bullish movement was resumed towards 1.1175 where significant bearish rejection was originated. The price zone around (1.1175 - 1.1190) stood as a significant SUPPLY-Zone that demonstrated bearish rejection for two consecutive times in a short-period. Hence, a long-term Double-Top pattern was demonstrated with neckline located around 1.1075-1.1090 which offered valid bearish positions two weeks ago. That's why, further bearish decline was executed towards 1.1025 and 1.0995 where the current bullish pullback was initiated. Recently, the mentioned episode of bullish pullback was demonstrated towards 1.1065-1.1085 where a cluster of supply levels are located (61.8% Fibo - 50% Fibo levels). The current price levels 1.1065-1.1085 demonstrated early bearish rejection and another valid SELL entry can be taken here (Triple-Top reversal pattern). Estimated initial bearish targets are located at 1.1020 and 1.1000 provided that an early bearish breakout below 1.1055 (neckline of the triple-top pattern) is achieved Please note that any bullish breakout above 1.1110 invalidates the mentioned bearish scenario allowing further bullish advancement towards 1.1150. The material has been provided by InstaForex Company - www.instaforex.com |
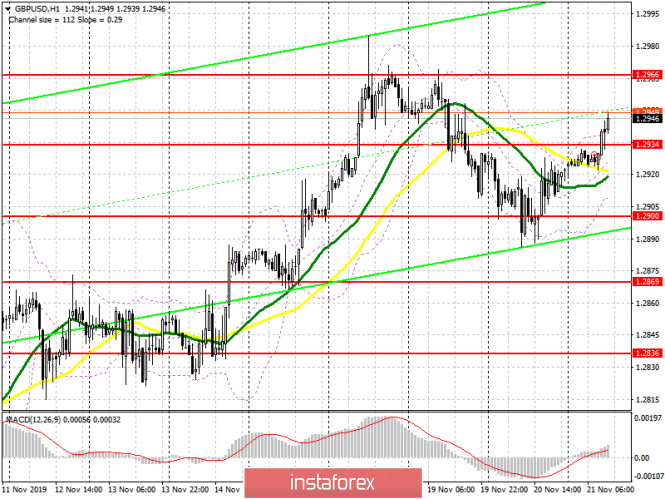
| Posted: 21 Nov 2019 03:51 AM PST To open long positions on GBP/USD, you need: In the first half of the day, I paid attention to the resistance level of 1.2935, in the area of which I could not wait for active sales. Fixing this range with the test on smaller timeframes allows us to count on the continued growth of the pound and its return to the area of weekly highs to the level of 1.2966. However, the more important goal of the bulls will be to update the resistance at 1.3017, where I recommend taking the profits. If the bulls do not find the strength to continue the growth of the pound, and good fundamental statistics will lead to the return of the pair under the support of 1.2935 already in the US session, then in this scenario, it is best to return to long positions after the update of the support of 1.2900 or buy GBP/USD immediately on the rebound from the minimum of 1.2869. To open short positions on GBP/USD, you need: The sellers did not cope with the task for the first half of the day and missed the resistance of 1.2934, which I emphasized in my morning review. Only a return to this level in the second half of the day, which may occur after a good report on the number of initial applications for unemployment benefits in the US, will return the market to bearish momentum, as a result of which you can count on the update of the minimum of 1.2900 and its breakthrough, with a return to the support of 1.2869, where I recommend fixing the profits. In the scenario of further upward correction of GBP/USD, it is best to consider short positions after the formation of a false breakdown in the resistance area of 1.2966 or sell for a rebound from the maximum of 1.3017. Indicator signals: Moving averages Trading is above the 30 and 50 daily averages, indicating a possible rise in the pound in the short term. Bollinger Bands The downward correction will be limited to the lower level of the indicator around 1.2910, a breakthrough of which will lead to a larger decline in the pound.
Description of indicators
|
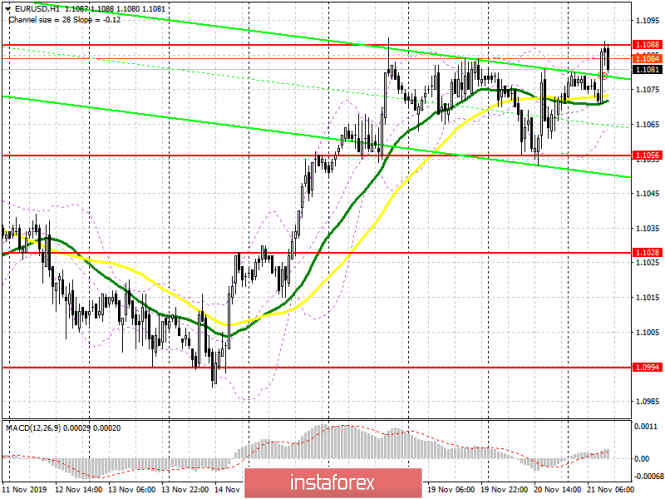
| Posted: 21 Nov 2019 03:51 AM PST To open long positions on EURUSD, you need: The lack of important fundamental statistics and the publication of the minutes of the European Central Bank, expected closer to the second half of the day, all this limits the demand for the European currency, which continues to push near the highs of this week, failing to overcome them in the first half of the day. The first resistance level has shifted slightly and now the important task of buyers is to break and consolidate above the maximum of 1.1090, which will resume the upward trend and lead to an update of the levels of 1.1109 and 1.131, where I recommend taking the profits. However, the publication of the minutes of the European Central Bank could significantly harm buyers if traders find hints of further weakening of the monetary policy. In the scenario of EUR/USD decline, it is best to consider new long positions after updating the minimum of 1.1056, which coincides with the lower border of the side channel or buy the euro immediately on the rebound from the area of 1.1028. To open short positions on EURUSD, you need: Although the sellers did not fully cope with the morning task, pushing the resistance level of 1.1082 to the area of 1.1090, a larger upward trend was not formed. In the afternoon, the bears will try to take advantage of the weakness of the euro after the publication of the minutes of the European Central Bank, as well as good statistics on the US economy and return the pair to the support area of 1.1056. However, only a breakthrough of this support will push EUR/USD even lower to the lows of 1.1028 and 1.0994, where I recommend taking the profits. If the demand for the euro returns in the first half of the day, it is best to return to short positions on a false breakdown of the resistance of 1.1109, but you can sell EUR/USD on a rebound from the maximum of 1.131. Indicator signals: Moving Averages Trading is just above the 30 and 50 moving averages, but it is too early to talk about building a new upward trend. Bollinger Bands A break of the lower border of the indicator around 1.1065 will lead to a larger sell-off of the euro, but a break of the upper border around 1.1090 will lead to the continued growth of the euro.
Description of indicators
|


| You are subscribed to email updates from Forex analysis review. To stop receiving these emails, you may unsubscribe now. | Email delivery powered by Google |
| Google, 1600 Amphitheatre Parkway, Mountain View, CA 94043, United States | |
No comments:
Post a Comment