
Forex analysis review |
- Short-term technical analysis of EURUSD for April 30, 2019
- Short-term technical analysis of Gold for April 30, 2019
- April 30, 2019 : EUR/USD Intraday technical analysis and trade recommendations.
- Analysis of Bitcoin for April 30, 2019
- April 30, 2019 : GBP/USD Intraday technical analysis and trade recommendations.
- Fundamental Analysis of EUR/JPY for April 30, 2019
- Bitcoin analysis for April 30, 2019
- Is it time to buy the euro?
- EURUSD: the euro continued to grow due to strong reports indicating the recovery of the eurozone economy
- Fundamental Analysis of GBPUSD for April 30, 2019
- GBP / USD plan for the American session on April 30. Pound buyers have actively declared themselves and breaks through the
- EUR / USD plan for the US session on April 30. The demand for the euro returned due to good data on the GDP growth in eurozone
- Oil scared of the president
- EUR/USD Update for 30.04.2019; Two targets met, third target awaiting
- Analysis of Gold for April 30, 2019
- The Fed will show the way to the greenback
- Without risk appetite: investors will choose the US dollar and gold
- The dynamics of the dollar will depend on the position of the Fed: selling EUR/USD pair, the likely continued growth of the
- Technical analysis of NZD/USD for April 30, 2019
- Technical analysis of USD/CHF for April 30, 2019
- Technical analysis of AUD/USD for April 30, 2019
- Control zones of USD / CHF pair on 04/30/19
- GBP/USD. April 30th. The end of the month. The pound rose by 120 points but the overall picture remains the same
- EUR/USD. April 30th. The end of the month. Eurozone GDP report helps the euro to recover against the dollar
- EURUSD: Data on eurozone GDP and inflation in Germany will set the direction of the market at the end of this month
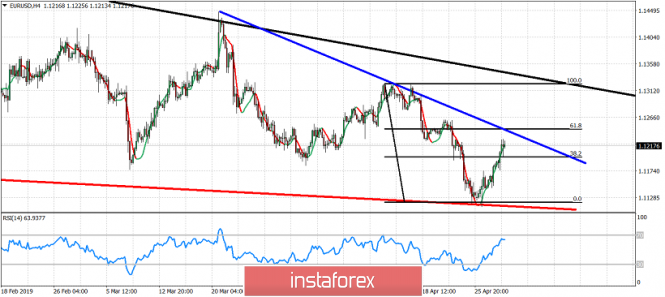
| Short-term technical analysis of EURUSD for April 30, 2019 Posted: 30 Apr 2019 01:01 PM PDT EURUSD has reached our first short-term target at 1.12 and is trading above it but below short-term trend line resistance. Medium-term trend remains bearish as long as price is below 1.13-1.1350.
Blue line - short-term resistance trend line Black line - major resistance trend line EURUSD has bounced as expected towards 1.12. Price has reached the 50% Fibonacci retracement and just below the blue short-term trend line resistance. A rejection at current levels will open the way for a move back to 1.11. RSI has not reached overbought levels yet and this implies that we may see this short-term bounce continue higher. Breaking above 1.1250 will open the way for a move towards 1.13-1.1330 where we find major trend resistance. The material has been provided by InstaForex Company - www.instaforex.com |
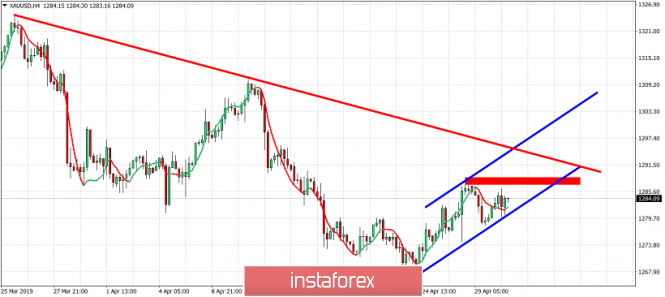
| Short-term technical analysis of Gold for April 30, 2019 Posted: 30 Apr 2019 12:57 PM PDT Gold price has held short-term support at $1,280 where we find the lower channel boundary. Bulls need to break above $1,289 in order to push higher towards the major resistance of $1,300.
Red line - major resistance trend line Blue lines - short-term bullish channel Red rectangle - short-term resistance area Gold price has short-term resistance area at $1,289. Breaking above this level will open the way for a move towards the red trend line major resistance. This will be a short-term bullish signal. However medium-term trend remains bearish as long as we trade below $1,300 and any bounce is considered as selling opportunity. Support is at $1,280 and bulls do not want to see that level broken. A break below this support will open the way for a move towards $1,250-60 or lower. The material has been provided by InstaForex Company - www.instaforex.com |
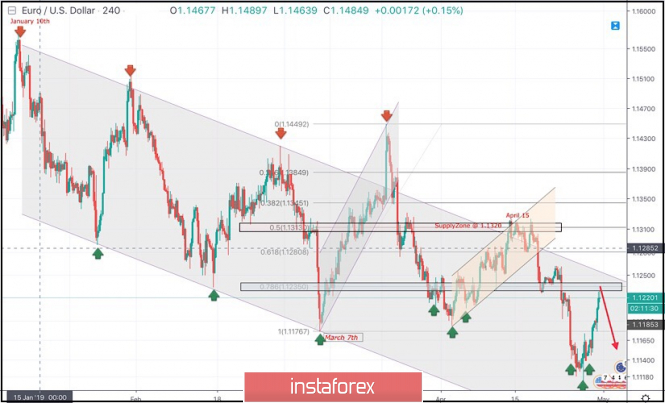
| April 30, 2019 : EUR/USD Intraday technical analysis and trade recommendations. Posted: 30 Apr 2019 08:03 AM PDT
Few weeks ago, a bullish Head and Shoulders reversal pattern was demonstrated around 1.1200. This enhanced further bullish advancement towards 1.1300-1.1315 (supply zone) where significant bearish rejection was demonstrated on April 15. Short-term outlook turned to become bearish towards 1.1280 (61.8% Fibonacci) then 1.1235 (78.6% Fibonacci). For Intraday traders, the price zone around 1.1235 (78.6% Fibonacci) stood as a temporary demand area which paused the ongoing bearish momentum for a while before bearish breakdown could be executed on April 23. Currently, the price zone around 1.1235 has turned into supply-zone to be watched for bearish rejection. Yesterday, a recent bullish head and shoulders pattern was being demonstrated around 1.1140 on the H4 chart. That's why, conservative traders were suggested to wait for another bullish pullback towards 1.1230-1.1250 for a valid SELL entry. Trade recommendations : Conservative traders can have a valid SELL entry anywhere around 1.1230-1.1250. S/L should be located above 1.1270. Target levels to be located around 1.1170 and 1.1130. The material has been provided by InstaForex Company - www.instaforex.com |
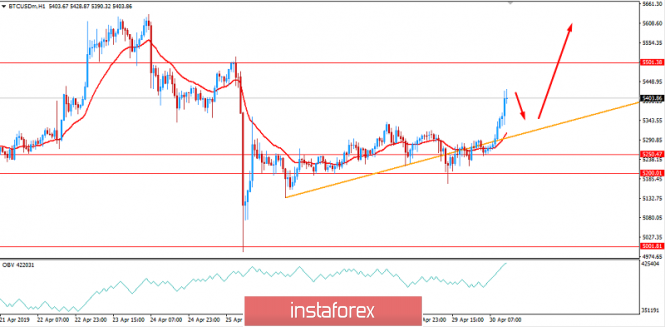
| Analysis of Bitcoin for April 30, 2019 Posted: 30 Apr 2019 07:44 AM PDT Bitcoin has been quite impulsive recently after consolidation at the edge of $5,200-50 area. The price is currently heading towards $5,500 in an impulsive manner and expected to break above it as the upward trend persists. The price, being held by the trend line support at the edge of $5,200-50 area, managed to push the price higher. With the current market momentum, the price is expected to rebounce towards the dynamic level of 20 EMA where the trend line support lies as well. According to the On-balance volume indicator, the increase in volume indicates the strength of bulls. At the same time, formation of the resistance in the indicator level is a sign of a possible decrease in volume which would result in a pullback along the way before the bullish pressure continues. As the price remains above $5,000 area with a daily close, the bullish bias is expected to continue with the target towards $6,000 area. The price area of $6,000 is the key resistance level. A break above it can push the price to new highs with the target towards $10,000 area in the coming days. SUPPORT: 5000, 5250 RESISTANCE: 5500, 5850, 6000 BIAS: BULLISH MOMENTUM: VOLATILE
|
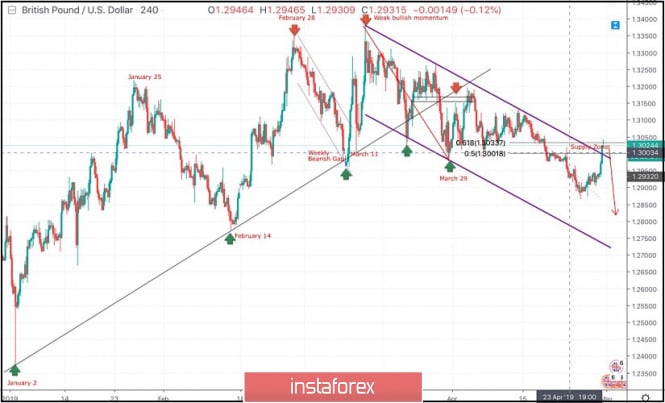
| April 30, 2019 : GBP/USD Intraday technical analysis and trade recommendations. Posted: 30 Apr 2019 07:43 AM PDT
On January 2nd, the market initiated the depicted uptrend line around 1.2380. On March 11, a weekly bearish gap pushed the pair below the uptrend line (almost reaching 1.2960) before the bullish breakout above short-term bearish channel was achieved. Shortly after, the GBPUSD pair demonstrated weak bullish momentum towards 1.3200 then 1.3360 where the GBPUSD failed to achieve a higher high above the previous top achieved on February 27. Instead, the depicted recent bearish channel was established. Significant bearish pressure was demonstrated towards 1.3150 - 1.3120 where the depicted uptrend line failed to provide any bullish support leading to obvious bearish breakdown. On March 29, the price levels of 1.2980 (the lower limit of the depicted movement channel) demonstrated significant bullish rejection. This brought the GBPUSD pair again towards the price zone of (1.3160-1.3180) where the upper limit of the depicted bearish channel as well as the backside of the depicted uptrend line demonstrated significant bearish rejection. Since then, Short-term outlook has turned into bearish with intermediate-term bearish targets projected towards 1.2900, 1.2800 and 1.2750 where the lower limit of the depicted channel comes again to meet the GBPUSD pair. Yesterday, we expected a bullish pullback to occur towards the depicted supply zone 1.3000-1.3033 which constitutes a major resistance zone on the short-term. Trade Recommendations: Conservative traders can have a valid SELL entry anywhere around the current price levels (1.3020-1.3035). TP levels to be located around 1.2950, 1.2905 and 1.2800 and S/L to be located above 1.3100. The material has been provided by InstaForex Company - www.instaforex.com |
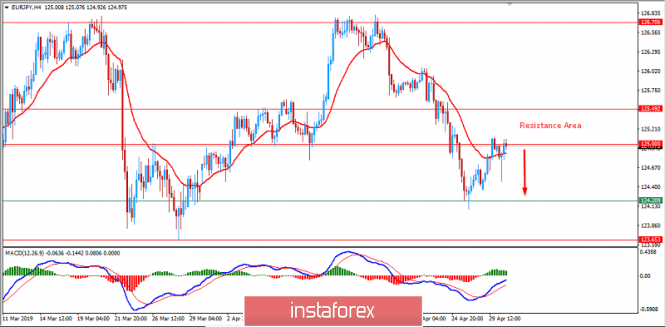
| Fundamental Analysis of EUR/JPY for April 30, 2019 Posted: 30 Apr 2019 07:13 AM PDT EUR gained ground against JPY recently which is viewed as a pullback towards the resistance area of 125.00-50. EUR has been weighed down by with the economic slowdown in the eurozone which is proved by mixed economic reports. So, EUR's rally is likely to be short-lived. EUR is trading firmly lower amid the economic slowdown and worse economic data published recently. EUR is going to extend weakness if upcoming ECB events and economic reports do not meet expectations. This week the economic calendar does not contain macroeconomic events to support EURO gains over USD. The European Union won backing from the bloc's top court on Tuesday for its system to protect foreign companies that is essential for future trade agreements, but critics say unfairly favors multinationals. Recently the eurozone provided a raft of upbeat economic data which helped EUR to rally for a while. However, it is unpredictable how long EUR could sustain a rally. Today the eurozone's M3 Money Supply report was published with an increase to 4.5% from the previous value of 4.3% which was expected to decrease to 4.2% and Private Loans contracted to 3.2% which was expected to be unchanged at 3.3%. Today the eurozone's Prelim GDP report was published with an increase to 0.4% from the previous value of 0.2% which was expected to be at 0.3% and Unemployment Rate dipped to 7.7% which was expected to be unchanged at 7.8%. On the JPY side, this week Japan's markets are closed for public holidays. So, the economic calendar lacks reports from Japan. Following the policy meeting of the Bank of Japan, Governor Kuroda made optimistic comments in the domestic economy. JPY is expected to regain momentum after certain corrections along the way. BOJ decided to examine the uncertainties about the economic activity along with the effect of the scheduled consumption tax hike and planned to continue the QQE on a large scale. The extreme QQE might make the JPY weaker against all other major currencies. The bank projected a strong labor market with consumer price index at below 2% target. The industrial production showed a weaker than expected reading which dropped from 1.4% to 0.7%. Retail sales increased at 1.0% while Core Consumer improved at 0.8%. Trade Balance came in at -0.18T when the forecast was -0.30T. Tomorrow, Japan's Flash Manufacturing PMI report is going to be published which is expected to be unchanged at 49.5. To sum up, JPY is still the stronger currency in the pair whereas EUR is struggling with the mixed economic data. EUR is expected to extend weakness in the coming days. As the Japanese economy thrives further and the BOJ remains optimistic, it provides JPY with solid support. Now let us look at the technical view. The price is currently being held by the resistance area of 125.00-50 from where as per preceding strong bearish trend, the price is expected to push lower towards 123.50 to 124.00 support area in the coming days. As the price remains below 125.50 area with a daily close, the pair is going to trade under the bearish bias.
|
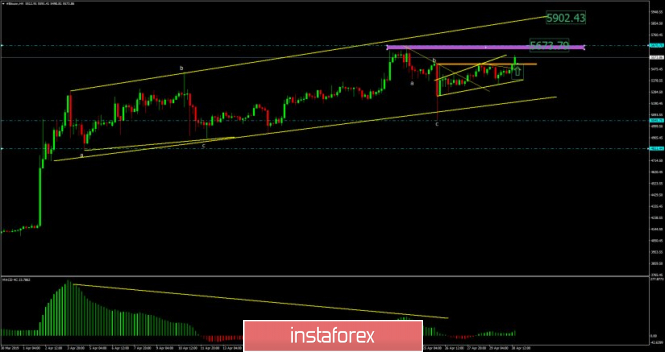
| Bitcoin analysis for April 30, 2019 Posted: 30 Apr 2019 07:03 AM PDT BTC price did break new created bullish flag pattern on the 4H time-frame and confirmed the rejection of the lower diagonal of the upward channel. Watch for buying opportunities.
Orange rectangle – Resistance level, which became support Purple rectangle - major short-term resistance The bearish correction is completed in our view since the orange supply trendline got broken. The smaller bullish flag pattern did create just after the breakout of the support, which is sign for the further near-term upward movement. BTC Is still trading inside of the upward channel and BTC is expected to trade towards the resistance levels at $5.673 and $5.902. Support levels are seen at the price of $5.530 and $5.340. The material has been provided by InstaForex Company - www.instaforex.com |
| Posted: 30 Apr 2019 06:55 AM PDT Societe Generale experts believe that the time has come to buy the euro, as pessimism about the prospects of the European economy will gradually come to naught. "Market sentiment towards the single European currency has improved significantly. It allows counting on the growth of the euro against the dollar to the level of $ 1.16," representatives of the financial institution said. According to them, the determining factor for the EUR/USD pair now is not the difference in interest rates or government bond yields, but the expectation of economic growth. "Last year, negative expectations led to a sharp decline in the euro. However, now these expectations are unjustified and it is time to rethink," the Societe Generale believes. Today, the EUR/USD pair, noting weekly highs, rose above 1.12 against the background of strong Eurozone statistics. According to Eurostat, in the first quarter, the GDP of the currency bloc expanded by 1.2% in annual terms with a growth forecast of 1.1%. Compared to the fourth quarter, the indicator increased by 0.4%, while previously it was expected that the indicator will accelerate by 0.3%. The data released today on unemployment in the eurozone also exceeded the expectations of experts. In March, the indicator fell to the lowest level since September 2008 and amounted to 7.7% against 7.8% in February. Analysts predicted that the indicator would remain unchanged. Thus, the region's economy is still developing despite the pessimistic predictions of the ECB, but there are still few reasons for optimism, given the political risks associated with Brexit and the upcoming parliamentary elections in the EU. The material has been provided by InstaForex Company - www.instaforex.com |
| Posted: 30 Apr 2019 06:55 AM PDT The euro was able to continue its upward correction in the first half of the day after a more than optimistic report on the growth of the eurozone economy in early 2019. Despite the uncertainty of global economic growth and the prospects for international trade, such indicators can return hope to traders to resume talks from the European Central Bank on raising interest rates in the Eurozone next year. According to the EU Statistics Agency, the eurozone's GDP in the 1st quarter of this year grew by 1.5% on an annualized basis, after rising by 0.9% in the 4th quarter of 2018. Compared to the same period last year, eurozone GDP grew by 1.2% in the first quarter. Traders also took a positive view of the unemployment report in the Eurozone, which in March this year fell to 7.7% against 7.8% in February. Economists had expected unemployment to remain unchanged. A good contribution to the overall GDP growth was made by the French economy, which continued to grow steadily in the 1st quarter of 2019 due to the recovery of consumer spending. According to the statistics agency Insee and the first preliminary estimate, France's GDP in the first quarter of this year grew by 0.3% compared with the previous quarter, which coincided with the forecasts of economists. Inflation in France was worse than expected. Thus, the CPI consumer price index in April rose only by 0.2% compared to March, where the growth was recorded at 0.8%. Compared to the same period of the previous year, the growth was 1.2%. Economists had expected growth of 0.5% and 1.2%, respectively. France's consumer price index, harmonized by EU standards, rose 1.4% per annum in April against 1.3% per annum in March. Spain also saw economic growth in the 1st quarter of this year. According to the report, the preliminary GDP of Spain in the 1st quarter increased by 0.7% compared to the 4th quarter of 2018 and 2.4% compared to the 1st quarter of 2018. Inflation in Spain increased by 1.6% per annum in April, with a forecast of 1.5%. Good support for the European currency was provided by reports on the German economy, which continues to recover after a period of recession, which almost led to a recession. According to the data, consumer prices in Germany rose in April due to prices for energy carriers and services. The report of the Federal Bureau of Statistics of Germany indicated that the consumer price index, harmonized according to EU standards, rose by 1.0% in April compared with the previous month and 2.1% compared with the same period of the previous year. Economists had expected growth of 0.5% compared with the previous month and 1.6% compared with the same period of the previous year. Consumer confidence in Germany is also stable in May. According to leading data from the research company GfK, the consumer confidence index in Germany in May was at the level of 10.4 points, remaining unchanged compared with April. Economists had expected the figure to decline and be equal to 10.3 points. The Gfk noted that the main factors constraining confidence include the uncertain situation around Brexit, as well as the trade conflict with the United States. As for the technical picture of the EURUSD pair, the main focus of buyers will now be at the resistance level of 1.1240, above which it is unlikely to break through the first time. More acceptable areas for opening long positions in risky assets are reviewed after correction to the area of 1.1200 and 1.1180. The material has been provided by InstaForex Company - www.instaforex.com |
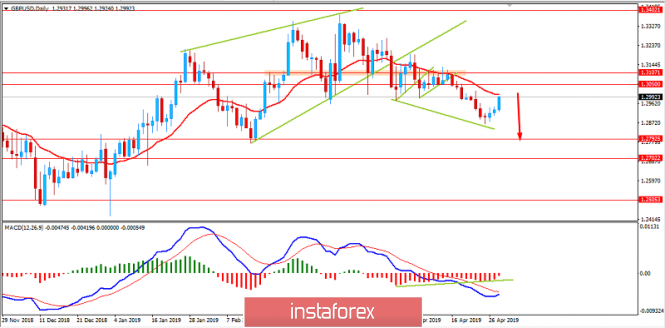
| Fundamental Analysis of GBPUSD for April 30, 2019 Posted: 30 Apr 2019 06:51 AM PDT The GBP/USD pair moved upwards after the recent decline which pushed the daily close below the 1.3000-50 area. This week's FOMC and NFP reports are expected to provide support to the US dollar. Therefore, the British pound is likely to give in to its American rival. The 6-month delay of Brexit gives Britain's central bankers space to take a broader view of the economy. However, they are not likely to raise interest rates in the coming months due to ongoing uncertainty around the UK's exit from the European Union. An average forecast is for a rate to rise in the first quarter of the next year when Governor Mark Carney will hand power over to a successor. Some analysts do not expect rates to be raised at all this or next year, financial market pricing said. Unlike the European Central Bank, the Bank of England is dealing with inflation that is likely to rise above target soon. Also, in contrast to the US Federal Reserve, it has only raised its rates twice in the current economic cycle, in August 2018. Moreover, Retailers are weighed down by Britain's uncertainty, while households pulled back from the big purchases and the Gfk Consumer Sentiment report showed a negative result. Tomorrow 's UK Manufacturing PMI report is anticipated to reflect a decrease to 53.2 from the previous figure of 55.1, and the Net Lending to Individuals is expected to decrease to 4.5B from the previous figure of 4.6B. Additionally, on Thursday, the Bank of England Inflation report, Monetary Policy Summary, and Official Bank Rate of UK are going to be published. The central bank's rate is forecast to remain at 0.75%. On the other hand, the strong US GDP excelled the estimates and provided support for USD. The annual pace of the GDP growth turned out to be 3.2 percent in the first three months of the year, comparable to last year's pace. The 3 percent growth achieved in 2018 surprised many at the central bank, and, in their March statement, officials said they thought the economy had slowed in the first weeks of the year. On Friday, the Nonfarm Payrolls report for April tops the list of this week's data releases. Economists expect to see a gain of 181,000 jobs, while the unemployment rate is forecast to hold steady at 3.8%. The US economy added 196,000 jobs in March, rebounding after a gain of just 33,000 jobs in the previous month. Moreover, by evaluating the recent data, today's consumer confidence is expected to be boosted to 126.2 from the previous figure of 124.1. This will be underlined by another decent rise in payrolls and a renewed uptick in wage growth after the last month's surprising dip. Additionally, Pending Home Sales are expected to increase to 1.1% from the previous value of -1.0%, while Chicago PMI is forecast to grow to 59.1 from the previous figure of 58.7. On Wednesday, the FOMC Meeting and the Federal Funds Rate report are going to be published. The rate is to remain unchanged at 2.50%. Additionally, Fed Chair Jerome Powell will hold a press conference following the meeting, investors await his insights on the policy outlook. As of the current scenario, the US dollar is quite firm amid the upcoming economic reports, even though the expectations are not that great. As the UK struggles with issues like BREXIT and mixed economic results, the pound is likely to be sluggish against the greenback in the coming days. Now, let us look at the technical view. The price managed to move higher towards the 1.30 area after a Bullish Divergence lead the price to the edge of the dynamic level of 20 EMA. As for the current trend, the price is expected to drop towards the 1.2700-1.2800 support area as it remains below the 1.3050-1.3100 area with a daily close.
|
| Posted: 30 Apr 2019 06:10 AM PDT To open long positions on the GBP / USD pair, you need: In the morning review, I focused on the level of 1.2946 and the expected breakout led to the continuation of the upward correction in the GBP/USD pair. At the moment, the target of bulls is the resistance of 1.3017 and a breakthrough will maintain the upward momentum and lead the pound to highs in the area of 1.3046 and 1.3091, where I recommend taking profits. In case of unsuccessful consolidation above 1.3017 in the second half of the day, it is best to return to long positions after correction from support 1.2983 or to rebound from a larger level 1.2946. To open short positions on the GBP / USD pair, you need: The bears failed to seriously declare themselves and so far their return to the market remains in question. Only an unsuccessful consolidation and decline below the level of 1.3017 will lead to a downward correction of GBP/USD pair to the support area of 1.2980, where I recommend taking profits. The main task of the sellers of the pound will be a breakthrough of support 1.2980 and a test of a minimum of 1.2946. In case of further growth scenarios, it is best to rely on short positions after updating the resistance of 1.3046 or to rebound from a larger high 1.3091. Indicator signals: Moving averages Trading is conducted above 30 and 50 moving averages, which indicates a continuation of the upward correction. Bollinger bands In the case of a decrease in the pound in the second half of the day, support will be provided by the average indicator border in the region of 1.2955. Description of indicators MA (moving average) 50 days - yellow MA (moving average) 30 days - green MACD: fast EMA 12, slow EMA 26, SMA 9 Bollinger Bands 20 The material has been provided by InstaForex Company - www.instaforex.com |
| Posted: 30 Apr 2019 06:06 AM PDT To open long positions on EUR / USD pair, you need: Good data on the euro area, including GDP and the German consumer price index, helped euro buyers cope with all the tasks that were set for them in the first half of the day. Now, a test with a fixation above 1.1233 resistance is expected. Only after that you can count on the continuation of the upward correction in the area of maximum 1.1262, where I recommend fixing the profit. In the case of a downward EUR / USD correction in the second half of the day, long positions can return on a false breakdown from the intermediate support of 1.1203 or on a rebound from the minimum of 1.1174. To open short positions on EUR / USD pair, you need: Bears were absent in the area of resistance at 1.1203 and you can count on their return only after updating the resistance of 1.1233. However, it is best to wait for a false breakdown to open short positions from there, considering what good data came out on the eurozone economy. Otherwise, it is best to sell the EUR/USD on a rebound from a maximum of 1.1262. The main goal of sellers in the afternoon will be to return to the support level of 1.1203. Indicator signals: Moving averages Trading is conducted above 30 and 50 moving averages, which indicates a continuation of the upward correction. Bollinger bands In the event of a decline in the euro in the second half of the day, support will be provided by the average indicator boundary around 1.1195. Description of indicators MA (moving average) 50 days - yellow MA (moving average) 30 days - green MACD: fast EMA 12, slow EMA 26, SMA 9 Bollinger Bands 20 The material has been provided by InstaForex Company - www.instaforex.com |
| Posted: 30 Apr 2019 05:49 AM PDT While oil has been marked as the best start in the first four months of the year since 1999, it is argued on the market what this may all end with. Since the 1970s, every rapid rally of black gold has turned into problems for the global economy. Consumer spending on gasoline and diesel fuel grew, as well as the cost of production increased and accelerated inflation, caused the central banks to tighten monetary policy. Donald Trump, whose appeal to OPEC to cut production, led to a 3% collapse of Brent and WTI at auction on April 26, is perfectly aware of such a scenario. Most likely, it was about closing speculative positions since the market as a whole remains under the control of the bulls. Changes in oil prices in January-April The appeal of the US President to the cartel came at a time when the participants in the production-reduction agreement evaluated the impact of Washington's sanctions against Tehran and thought about whether black gold had risen too high because of them? According to BofA Merrill Lynch, oil production in Iran will decline from 3.6 million bpd in the third quarter of 2018 to 1.9 million bpd in the second half of 2019. Nevertheless, the bank believes that there will not be much growth in the market surplus as reserve capacities of other countries will cover it. Judging by the behavior of financial markets, investors do not particularly panic about the negative impact of the Brent and WTI rally on the global economy. First, the rise in prices was primarily due to supply disruptions. If so, then global demand will cope with the current value of black gold as the eurozone and China recover. Secondly, the market has changed. Costs have dropped and mining in the United States is growing at a record pace. In this regard, it can be assumed that future shocks will be less painful than before. Oil production in the largest producing countries It should be noted that Riyadh has good reason to ignore Donald Trump's calls for OPEC to cut production. According to IMF research, to balance the budget of Saudi Arabia, oil is required at $ 85 a barrel. Donald Trump had no special effect. On the contrary, Saudi Arabia stated that the cartel is likely to prolong the agreement on reducing production outside of June. Most likely, until the end of the year. Coupled with the US sanctions against Iran and the increased risk of a military coup in Venezuela, as well as problems with pipelines in Russia and an increase in global demand, Brent and WTI are fully capable of continuing the northern campaign. According to the median estimate of the 31st Reuters expert, the average cost of a North Sea variety in 2019 will be $68.57, which is 2% higher than predicted in March, and a Texan with $60.23 per barrel. Technically, if Brent bulls fail to return futures quotes above $72.75 (61.8% of the Shark pattern CD wave) in the near future, it will be the first indication of the weakness and increase the risk of further decline of oil in the framework of the transformation of the model Shark in 5-0. Brent daily chart |
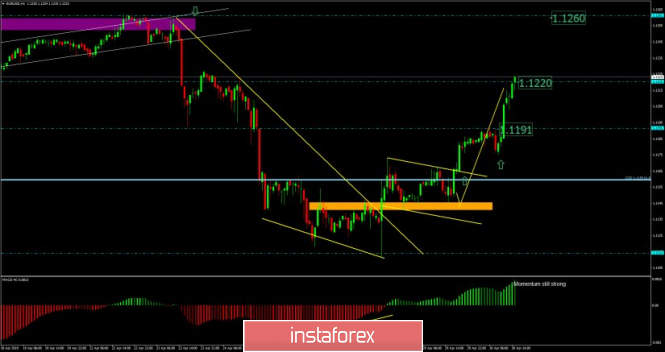
| EUR/USD Update for 30.04.2019; Two targets met, third target awaiting Posted: 30 Apr 2019 05:47 AM PDT EURUSD traded higher as we expected yesterday. The price tested the level of 1.1220. Strong bullish momentum is present and we still expect further upside.
Orange rectangle – 20EMA acting like support Blue horizontal line – Resistance level EURUSD did exactly how we expected yesterday. After the breakout of supply trendline (yellow diagonal) in the background and after the breakout of the bullish flag yesterday, the odds were on bullish movement. MACD oscillator is showing that increase in the upside momentum and that is good sign for the further upward continuation. Both our upward targets from yesterday were met at 1.1191 and 1.1220 but the third target is added and it is set at the price of 1.1260. Support levels are seen at the price of 1.1203-1.1192. Watch for buying opportunities on the dips with target at 1.1260. The material has been provided by InstaForex Company - www.instaforex.com |
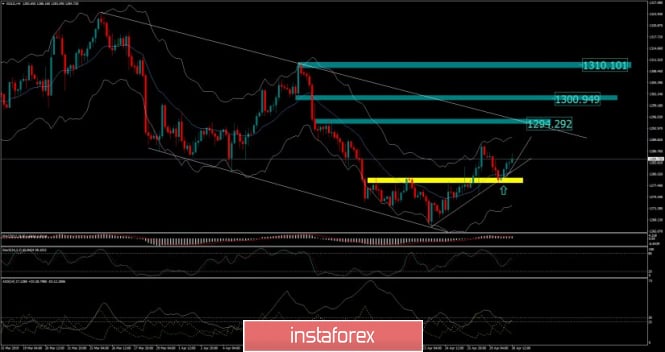
| Analysis of Gold for April 30, 2019 Posted: 30 Apr 2019 05:34 AM PDT Gold traded higher in past 24h period as we expected and level of $1.278 provided great support. We expect further upward movement and potential test of upper references.
Yellow rectangle – Short-term resistance, which became key support Blue moving average – 20EMA acting like support Green rectangle – Resistance based on price action Green rectangle – Resistance 2 based on price action Green rectangle – Resistance 3 based on price action Gold did successful rejection of the key support at the price of $1.278, which is good sign for further upward price. Our advice is to watch for buying opportunities. Upward references are set at the price of $1.294.30, $1.300.95 and $1.310.00. As long as the Gold is trading above the $1.265.00, the short term-trend remains bullish. Medium Keltner average (20EMA) is acting like support together with rising ADX reading, which adds more potential for upside. The material has been provided by InstaForex Company - www.instaforex.com |
| The Fed will show the way to the greenback Posted: 30 Apr 2019 05:32 AM PDT Tomorrow, the United States Federal Reserve System (FRS) will announce its decision on monetary policy. Recently, the US Central Bank made a dovish reversal, which eliminates the interest rate increase by the end of this year and announces its intention to complete the program to reduce its balance in September. Greenback was depressed for a while until investors remembered that the United States was still at the forefront of the global economy and other global central banks were also following a dovish course. It is expected that following the results of the next meeting, the Fed will leave the interest rate unchanged and the pause, which the regulator took earlier, will continue. However, the short-term dynamics of the dollar exchange rate will depend on what the Central Bank says and exactly how they will do it. In analyzing the tone of the statements of the regulator and the comments of Jerome Powell, one should pay attention to the following points, which can shed light on further steps of the Fed: 1. Employment The American economy continues to actively create new jobs, approximately 200 thousand a month, which can only inspire, as well as unemployment at the level of 3.8%. Along with this, wages are rising. The rate of their annual growth a few months ago exceeded the level of 3% and confidently settled there. However, now that strong employment rates are reflected in increased earnings, it may result that the pace of job creation may slow down. What does the Fed think about this? Does he prefer to focus on the positive or negative aspects of the labor market? It should be noted that market expectations regarding employment are quite high, so any signs of caution on the part of the Fed in this matter may put pressure on the US currency. 2. Inflation In March, consumer spending in the United States grew for a maximum of more than nine and a half years but price pressure remained restrained, Moreover, one of the main inflation indicators (baseline PCE) showed the smallest increase over the past 14 months in annual terms. How will the Fed respond to such results? The regulator most likely recognizes the fact of slowing inflation but the expectation of this has already been set by the market at prices. If the Central Bank leaves this question without comment or does not express any concern on this matter, then this may provide support to the dollar. 3. Economic growth Despite the fact that the latest release of US GDP gave a pleasant surprise, demonstrating an unexpected growth of 3.2% in the US economy in the first quarter, the market reacted rather coolly to this result. Firstly, the report showed weak inflation and secondly, the main driver of GDP growth was such an unstable factor as stocks. How will the Fed comment on the latest figures? If the regulator decides that the glass is half full and once again marks the strength of the US economy, the dollar can strengthen. If the Central Bank retains a cautious attitude in this matter, then we should expect a weakening of the greenback. "At the moment it is difficult to see something that could cause a greater dollar reversal," noted by currency strategists at Swedbank. "What keeps moving greenback forward when the Fed behaves dovish, risk appetite is high, and the financial situation does not correspond to strong demand for USD? The answer, perhaps, lies in the fact that as long as the United States is ahead of other countries in terms of economic growth. The market will give preference to the US dollar", say by analysts at Saxo Bank. "The events taking place in the global economy confirm the correctness of our" bullish "views on the American currency. However, it is not at all necessary that the growth of the dollar will turn out to be stable and aggressive," experts said. The material has been provided by InstaForex Company - www.instaforex.com |
| Without risk appetite: investors will choose the US dollar and gold Posted: 30 Apr 2019 05:17 AM PDT Currently, many market participants have begun to sell US currency and invest in "risk assets" - stocks, raw materials and emerging markets due to the suspension in raising rates by the US Federal Reserve. However, this trend is fading away. Last week, the US dollar struck many-month highs against most world currencies. At the same time, the dollar stabilized against the backdrop of a stronger and gold prices began to rise. Last Friday, April 26, Washington surprised experts with strong data on GDP growth. In the first quarter of 2019, the figure unexpectedly increased by 3.2% year-on-year. The tax cut initiated by the US president played a key role in stimulating economic activity in the country. Against the background of general political and economic instability in Europe, as well as a possible liquidity crisis, big business began to flow into the US dollar and US markets, analysts said. On top of that, a Fed rate of 2.5% makes American securities more profitable than European ones. However, further growth of the US currency may cause a chain reaction of sales of "risk assets" that were bought with borrowed dollars, experts warned. Currently, risk assets are considered to be raw materials and debt securities of developing countries, such as Turkey. Here, the debt crisis is raging, turned into a currency crisis, during which the devaluation of the lira to the US dollar has reached an impressive 40%. Another category of risky assets includes the Russian ruble and federal loan bonds (OFZ). Experts draw attention to the gigantic size of world debt, reaching $250 trillion and exceeded 300% of world GDP. All over the world, a high debt load of the population was recorded. In China, household debt over the past 10 years has increased 4 times. The debt burden of the American corporate sector has almost doubled. In 2021, the maturity of corporate bonds in the amount of $2 trillion will come, which may cause a serious liquidity crisis and an uncontrolled increase in interest rates. According to experts, this can provoke a significant increase in the cost of the yellow metal. Experts are confident that in the case of the implementation of such a scenario, the price of gold will react the same as in the period from 2007 to 2011 when the precious metal prices rose from $650 to $1900 for 1 troy ounce. According to specialists, the price of gold has already noted the local minimum and will retain its position until August of this year, when the season of high demand for the yellow metal starts in Asia. Until that time, experts are counting on continued consolidation in the range of $1,250 to $1,350 for 1 ounce of precious metal. Taking into account the above factors, analysts expect a new wave of "flight from risk" against the background of sales in stock markets, which can lead to a significant strengthening of the US dollar to the entire spectrum of currencies. However, this time the strengthening of the American currency will not entail a fall in the value of gold since the liquidity crisis creates an expectation of a new issue. The material has been provided by InstaForex Company - www.instaforex.com |
| Posted: 30 Apr 2019 05:13 AM PDT Tomorrow, May 1, there will be a one-day meeting of the Federal Reserve on monetary policy. Investors consider it a landmark, as they believe that because of the results, the regulator may give a signal about the decision to soften monetary policy by lowering interest rates in the second half of this year. Such predictions are based on the opinion that ambiguous signals about the state of the American economy, as well as its future prospects, may force the Fed to lower rates in order to avoid stalling the country into recession on the one hand and to stimulate demand for US assets on the other. Moreover, the state of the global events such as the difficult economic situation in Europe, the ongoing trade war with China and brewing with the EU increases the risks of a negative scenario relative to all of these. In addition, an important point is strong pressure from Donald Trump on the Central Bank, who believes that his presidential rating is completely dependent on the dynamics of the local stock market. Yes, indeed such dependence is noted. The positive attitude towards the American leader coincides with the growing dynamics of stock indices and their fall lowers the rating. Markets noticed this and actually began to direct Trump's mood and then the actions of the regulator, which was most pronounced at the end of last year and at the beginning of this. If the Fed fails to preserve its independence and such a risk exists, then in a hidden form in the form of hints if not explicit it will signal about likely such plans at tomorrow's meeting it will signal about likely such plans. If this happens, the local stock market will receive good support and the dollar will undoubtedly be under pressure, as the prospects for lowering central bank rates will negatively affect the attractiveness of the currency. At the same time, if the Fed again makes it clear that it will not do anything in the expected future and decides to continue to monitor the development of events - whereby prolonging the state of uncertainty - it can hit the dollar and it will resume its local decline. Forecast of the day: The EUR/USD pair found resistance at 1.1190. If it is not overcome, there is a probability of a local price reduction to 1.1125. The USD/CAD pair is trading in the middle of a short-term uptrend. If oil prices continue to be adjusted downward, there is a chance that the pair will continue to grow to 1.3600. In this case, it must be bought after rising above the level of 1.3500. At the same time, the resumption of growth in oil prices will support the Canadian currency and the pair after declining below 1.3455 may further fall to 1.3400 with the prospect of a decline to the lower limit of the trend already. |
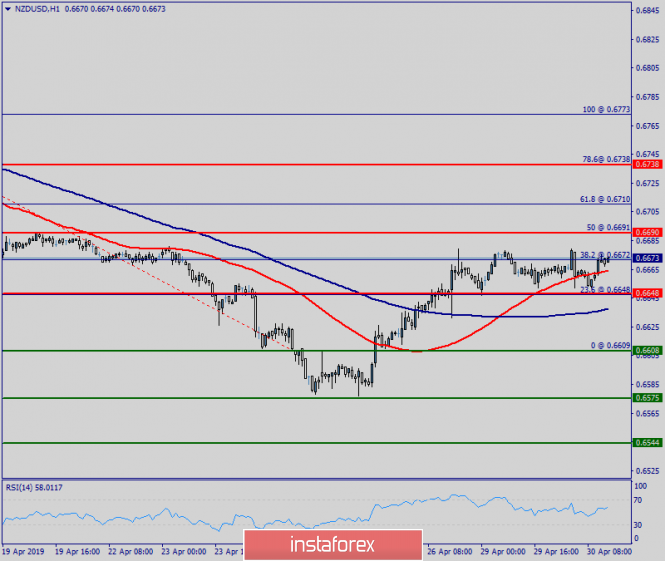
| Technical analysis of NZD/USD for April 30, 2019 Posted: 30 Apr 2019 04:40 AM PDT |
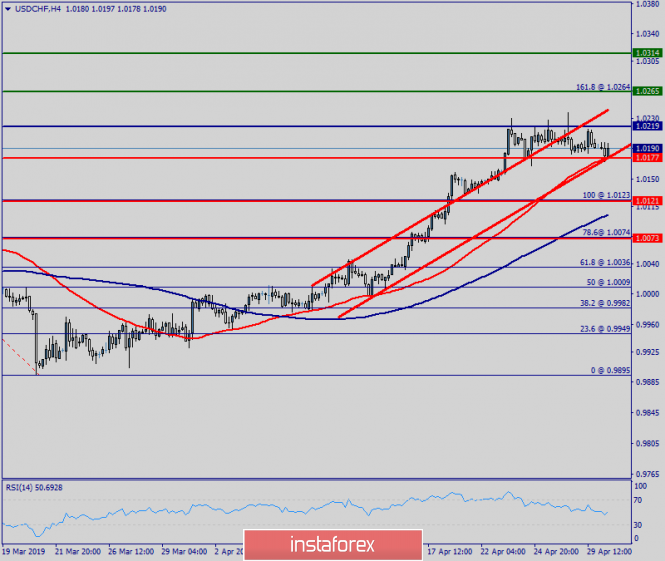
| Technical analysis of USD/CHF for April 30, 2019 Posted: 30 Apr 2019 04:38 AM PDT |
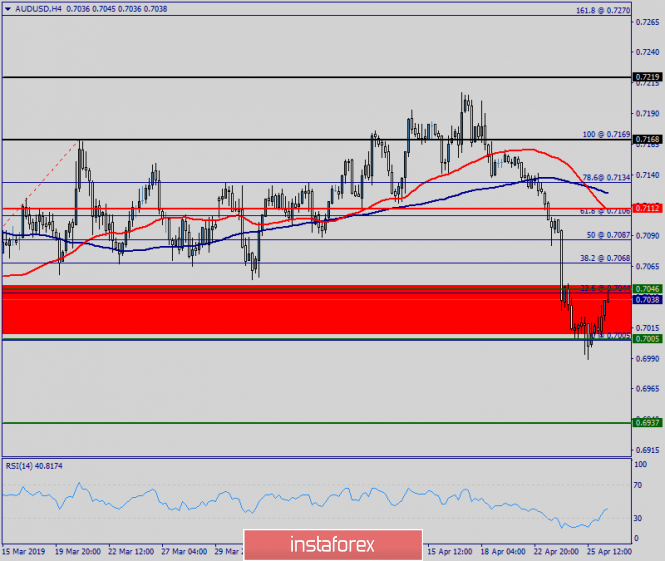
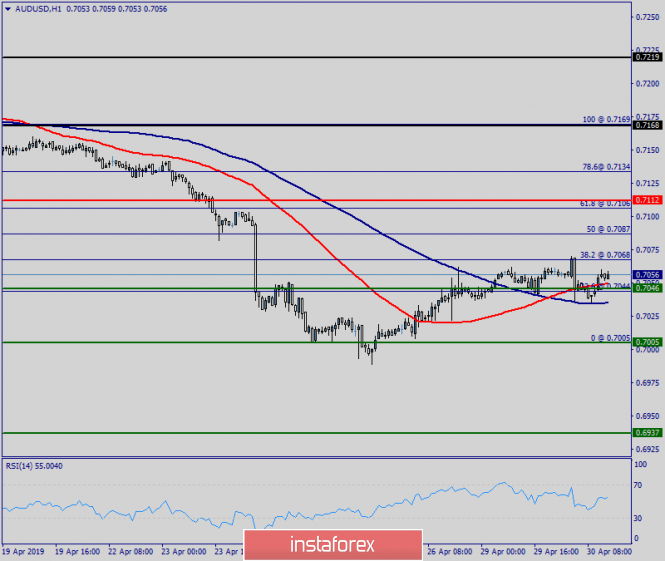
| Technical analysis of AUD/USD for April 30, 2019 Posted: 30 Apr 2019 04:35 AM PDT Overview: Pivot: 0.712. The AUD/USD pair is set above strong support at the levels of 0.7046 and 0.7168. This support has been rejected four times confirming the uptrend. The major support is seen at the level of 0.7046, because the trend is still showing strength above it. Accordingly, the pair is still in the uptrend in the area of 0.7046 and 0.7168. The AUD/USD pair is trading in the bullish trend from the last support line of 0.7112 towards thae first resistance level of 0.7168 in order to test it. This is confirmed by the RSI indicator signaling that we are still in the bullish trending market. Now, the pair is likely to begin an ascending movement to the point of 0.7168 and further to the level of 0.7290. The level of 0.7389 will act as the major resistance and the double top is already set at the point of 0.7389. At the same time, if there is a breakout at the support levels of 0.7112 and 0.7046, this scenario may be invalidated.
|
| Control zones of USD / CHF pair on 04/30/19 Posted: 30 Apr 2019 04:23 AM PDT Work is carried out to this week within the local accumulation zone formed by the highs of the past week. As long as the pair is trading above the 1/4 WCZ of 1.0183-1.0178, the upward movement will remain an impulse. The probability of violation of the upward impulse and the formation of a deep correctional model is 90%, which determines the work within the day. Purchases from current grades are not profitable, therefore a search for a pattern for sale from extremes is required. The supply zone is already visible to the naked eye, so entering into its limits makes it necessary to consider the possibilities for selling the instrument. Orientation is necessary for the closure of the latest US sessions. An alternative model will be developed if the current closure of the American session happens below the level of 1.0178. This will indicate a change in priority and movement to the next target zone at 1/2 WCZ of 1.0129-1.0119, where the fate of the medium-term impulse will be determined. Working in the sale to the specified levels allows you to get an advantage in our direction up to 70%. Daily CZ - daily control zone. The area formed by important data from the futures market that change several times a year. Weekly CZ - weekly control zone. The area formed by marks from important futures market which change several times a year. Monthly CZ - monthly control zone. The area is a reflection of the average volatility over the past year. The material has been provided by InstaForex Company - www.instaforex.com |
| Posted: 30 Apr 2019 03:43 AM PDT 4-hour timeframe The amplitude of the last 5 days (high-low): 91p - 76p - 51p - 69p - 42p. Average amplitude over the last 5 days: 66p (62p). On Tuesday, April 30, the British pound continues its upward movement against the background of a small drop in demand for the US dollar. Or profit-taking on dollar positions at the end of the month. The Brexit theme frankly faded into the background. This is a good opportunity for the pound to roll back as much as possible up. Unfortunately, the downward trend persists in the GBP/USD pair. Thus, we expect a resumption of the downward movement sooner or later. To consider not only short-term purchases in small lots, but it will also be possible not earlier than the Bulls overcome the Ichimoku cloud. But even in this case, the growth potential of the British currency is not too great. The political crisis in the UK, the lack of a decision on Brexit, complete uncertainty with this very decision, as well as the future of Theresa May - it clearly does not benefit the British currency. Tomorrow will be an important day for the pair, as the outcome of the next Fed meeting will be known. The "pigeon" will be the comments of representatives of the regulator, the greater the chance for the pound to continue to grow. The rate is unlikely to be changed, so all the attention to the press conference. Trading recommendations: The currency pair GBP/USD continues its upward movement. Thus, it is now recommended to consider long positions in small lots with targets at 1.2998 and 1.3055. Short positions will become relevant only after the reverse consolidation of the price below the critical line with the target at 1.2845. Most likely, tomorrow the pair will determine the direction of movement for the next few days. In addition to the technical picture should also take into account the fundamental data and the time of their release. Explanation of the illustration: Ichimoku indicator: Tenkan-sen - the red line. Kijun-sen - the blue line. Senkou Span A - light brown dotted line. Senkou Span B - light purple dotted line. Chinkou Span - green line. Bollinger Bands indicator: 3 yellow lines. MACD Indicator: A red line and a histogram with white bars in the indicator window. The material has been provided by InstaForex Company - www.instaforex.com |
| Posted: 30 Apr 2019 03:43 AM PDT 4-hour timeframe The amplitude of the last 5 days (high-low): 69p - 84p - 45p - 63p - 42p. Average amplitude over the last 5 days: 61p (58p). The last trading day of the month ends with the strengthening of the European currency. Finally, the euro has waited for fundamental support. Although this is only one report, and it hardly means a serious change in the state of the EU economy for the better, nevertheless, it has supported the euro. The unemployment rate in March also pleased, as it dropped to 7.7%. Thus, the Foundation today is completely on the side of the euro. Unfortunately, the general trend is not in favor of the euro. In technical terms, it is possible to count on a more or less serious strengthening of the euro, not to mention a full-fledged upward trend, not before overcoming the Ichimoku cloud. Looking at the higher timeframe, a downward trend is clearly visible, which will not be very easy to break. The main factor not in favor of the euro is that the US monetary policy is much stronger than the European one, as well as the economy. Therefore, traders prefer long-term investment in the US economy rather than in Europe. Thus, we believe that in the medium term, the balance of forces between currencies will not change. Especially against the background of the growing trade war between the EU and the US. Trading recommendations: The EUR/USD pair continues to move up and now buy orders with targets at 1.1234 and 1.1272 have become relevant, but with small lots, as the "Golden Cross" is rather weak. It is recommended to consider sell orders in small lots in order to reach the level of 1.1082 not earlier than the reverse consolidation of the price below the critical line. In this case, the downward trend may resume. In addition to the technical picture should also take into account the fundamental data and the time of their release. Explanation of the illustration: Ichimoku indicator: Tenkan-sen - the red line. Kijun-sen - the blue line. Senkou Span A - light brown dotted line. Senkou Span B - light purple dotted line. Chinkou Span - green line. Bollinger Bands indicator: 3 yellow lines. MACD Indicator: A red line and a histogram with white bars in the indicator window. The material has been provided by InstaForex Company - www.instaforex.com |
| Posted: 30 Apr 2019 02:05 AM PDT The US dollar declined against the euro and the pound, despite the fact that American consumers continued to increase their spending in February and March of this year, which will favorably affect the pace of economic growth. The increase in spending is directly linked to household confidence in their economic prospects. According to the US Department of Commerce, personal household spending rose 0.1% in February this year, while in March the growth was just a little bit below the level of 1.0% and amounted to 0.9% compared to the previous month. Let me remind you that the data for February were not published in March due to the suspension of government work earlier this year. However, not everything is as good as it seems at first glance. Despite rising costs, Americans' personal incomes in March rose by only 0.1% compared with the previous month, after rising 0.2% in February. Weak income growth, along with low unemployment, could have a negative impact on sentiment in the future. Personal savings of Americans increased in February by 7.3% but decreased in March by 6.5%. The price index for personal consumption expenditures in the US rose by 0.2% in March and by 1.5% compared to the same period in 2018. The speech of the US Treasury Secretary Mnuchin, which took place on Monday evening, did not make serious changes in the market situation. The head of the Ministry of Finance said that the Trump administration policy contributed to GDP growth of 3.2% in the first quarter of this year, and that strong growth in the US economy is expected to continue over the next year. Mnuchin also noted that the slowdown of the European economy will have a modest impact on the US economy, as a trade agreement with China may be concluded in the coming weeks. The Minister of Finance also said in an interview that last week, there was a meeting with representatives of the Japanese authorities on trade issues. The White House wants Japanese markets to be open to American agricultural products. Most likely, another trade conflict is brewing, but much will depend on the reaction of the Japanese authorities. As for the technical picture of the EURUSD pair, further growth may be limited by the resistance of 1.1205 in the next few days. The bullish correction will continue only if there are good reports on inflation in Germany and GDP growth in the Eurozone in the 1st quarter of this year. The breakthrough of resistance 1.1205 will open a direct way to buyers of risky assets in the area of 1.1240 and 1.1280. If the data turns out to be worse than economists' forecasts, and it has been repeatedly said that the growth rate of the European economy is slowing again, then it is likely that the pressure on EURUSD will return, and the decline under the support of 1.1170 will bring back speculative sellers actively pushing the euro down to a minimum of 1.1115. The material has been provided by InstaForex Company - www.instaforex.com |


| You are subscribed to email updates from Forex analysis review. To stop receiving these emails, you may unsubscribe now. | Email delivery powered by Google |
| Google, 1600 Amphitheatre Parkway, Mountain View, CA 94043, United States | |
No comments:
Post a Comment