
Analyst Articles – Forex News 24 |
- Brexit Anger May Dampen Sterling Strength
- Dollar, S&P 500 and Crude Sport Failed Breakouts and Failed Reversals
- Watch Yuan, HKD for Clues on Possible US China Trade War Resolution
- USD/CAD Price Outlook – Looking for a Break Below 1.3410?
- AUDUSD Still Looking Into The Abyss?
- AUD & NZD Most Volatile Currencies Next Week Amid Knife Edge RBA & RBNZ Rate Decisions
- Gold Price May Decline Quickly; Euro & Other Charts to Watch Next Week
| Brexit Anger May Dampen Sterling Strength Posted: 04 May 2019 03:16 AM PDT Hits: 16 As we write, the ruling UK Conservative Party have lost over 600 seats in the local elections, and if these losses are translated into a national vote, the Conservative and Labour parties will be neck and neck on 28% of the vote while Others will have 25%. UK politics look set to re-assert themselves and Sterling is very likely to suffer. Sterling Price (GBP) Talking Points:
The DailyFX Q2EUR Forecast is available to download including our short- and medium-term look at Sterling (GBP). Fundamental Forecast for Sterling: Neutral The outlook for Sterling remains neutral for next week in what could turn out to be a tough week for UK PM Theresa May. Thursday's local council elections sees the ruling party lose hundreds of seats as the UK public show their displeasure at PM May's handling of the Brexit negotiations. Talk still swirls of a possible indicative vote of no confidence in PM May, and this volume will turn higher as the local election losses are put into perspective. As we write, the current results would translate into both the Conservative and Labour Party polling 28% of the national vote with Others taking 25%, a potentially disastrous and fragile political set-up. The PM also sacked her defence secretary Gavin Williamson mid-week over, alleged, newspaper leaks concerning the Huawei and their potential involvement in the future UK 5G networks. This week's BoE monetary policy meeting saw all measures left unchanged but in the QIR report, governor Carney hinted that more than one interest rate hike may be needed, not an outright hawkish signal but one to take note of. The BoE increased their GDP forecasts going forward while downgrading this year's inflation outlook before pushing it higher again for 2020 and 2021. Next Friday the Office for National Statistics will release Q1 GDP data which may see q/q growth of 0.4% to 0.5%, up from 0.2%, a healthy growth rate despite Brexit worries. Next week commentary is scheduled from BOE members Jon Cunliffe (dove), Andy Haldane (hawk) and Dave Ramsden (dove) which may give the market some more background behind the latest BoE meeting. GBPUSD remains above 1.3000 despite the local election losses as investors seem reluctant to short the British Pound at current levels. While this stance has held over the past few weeks, the Brexit noise-o-meter is being turned up and has been seen in the past months, GBP reacts to tweets and 'sources' stories more than monetary policy. The current uplift may hold but sterner tests lie ahead around the 68.2% Fibonacci retracement level at 1.3177. GBPUSD Daily Price Chart – May 3, 2019IG Client Sentiment data show 63.7% of traders are net-long GBPUSD. We typically take a contrarian view to crowd sentiment, and the fact traders are net-long suggest that GBPUSD prices may fall further. Traders may be interested in two of our trading guides, especially in times of volatility – Traits of Successful Traders and Top Trading Lessons – while technical analysts are likely to be interested in our latest Elliott Wave Guide. — Written by Nick Cawley, Analyst To contact Nick, email him at nicholas.cawley@ig.com Follow Nick on Twitter @nickcawley1 Other Weekly Fundamental Forecast:Australian Forecast: Australian Dollar Could Face First RBA Rate Cut Since August 2016 2019-05-04 10:00:00 Can you get luxurious from fx trading? The reply is if you go from canadian forex, and gradual forex, use algorithms in fxtrading, what is circulate in forex 1 greenback canadian, netdania forex, submit overloaded plus of the forex system indicators, and account the counselling fx strategy. We present win win all.
|
| Dollar, S&P 500 and Crude Sport Failed Breakouts and Failed Reversals Posted: 03 May 2019 07:44 PM PDT Hits: 7 Reversal Talking Points:
What do the DailyFX Analysts expect from the Dollar, Euro, Equities, Oil and more through the 2Q 2019? Find our forecasts for the quarter in the DailyFX Trading Guides page. Dollar Faulters While S&P 500 Heads Off Collapse Amid US Data RunBoth the US equity market benchmarks and the Dollar find themselves in technically compromised positions following two weeks of failed attempts at trend development. It comes as little surprise that the markets would commit to a clear course through Friday given the mix of sentiment to be derived from the unconfirmed and often contradictory fundamental winds that we keep tabs on for market guidance. Following the whiplash the markets felt Wednesday between the Fed’s statement that seemed to acquiesce to a growing dovish bent and Powell’s ‘hawkish’ remarks about inflation constraints being ‘transitory’, a host of Fed officials seemed to build the dovish case back up again Friday. James Bullard – one of the most dovish in the Fed – said a cut could come if inflation remained lower after the summer. We have a range of Fed speakers in the week ahead, and recent response to chatter suggests it is worth keeping tabs. Chart of S&P 500 Overlaid with Implied Yield from December Fed Funds Futures Contract (Daily) Yet, on the monetary policy front, the employment data Friday seemed to offer the central bank more than enough reason to hold its rates steady. The change in NFPs for April beat expectations (263,000 vs 190,000 expected), the jobless rate dropped to a six-decade low 6.3 percent and wages (the inflation component) held steady at 3.2 percent. If you intend to watch specific measures that can shape the Fed’s influence moving forward, keep tabs on inflation measures which would be the prompt for hikes (if they are running hot) and market volatility for cuts (as financial instability risks most unwieldy threat to economic health). Speaking of growth, the ISM service sector activity report cooled a little of the residual enthusiasm following the US 1Q GDP beat when it slipped unexpectedly – though the 55.5 reading is still firmly in growth territory. Trade was another mixed point as the $71.4 billion deficit was smaller than expected but still an escalation of amid trade wars. Chart of US Unemployment Rate and Russell 2000 Equity Index (Monthly)
Looking out over the US docket, there is significantly less of the event risk that could single-handedly direct the US and global markets to rise or fall. That is problematic from a trading perspective because both the DXY Dollar Index and S&P 500 experienced failed bullish breakouts to two-year and record highs respectively. What could have fast tracked aggressive, bearish reversals subsequently fell apart in the lead up to this past Friday’s event risk. The potential for fielding clear direction and generating speculative momentum between technical cue and fundamental charge has fallen apart. Without another lightning rod for conviction, it can prove difficult to re-engage a move in either direction. That could ironically put sentiment itself back in charge of the next stage. We have seen plenty of instances in the past where risk trends inversely scrambled fundamental interests. The most recent example of this inverse influence is the collapse in risk trends through the fourth quarter of 2018 where the accelerated collapse in turn stirred fears of a subsequent recession and the limitations of the world’s largest central banks. Chart of S&P 500 and Tails/Wicks (Weekly)
High-Potential Events Give Way to Influential but Unscheduled ThemesAs we move into the new trading week, there is a range of event risk that could reasonably be expected to generate volatility for local currencies with the rare flash of global influence. However, the potential for a systemic wave developing from any of these fundamental points of influence is low. Instead, my focus moving forward will shift back to the open-ended systemic themes. Whether or not the global economy is due to hit stall speed is perhaps one of the most consequential issues, but it is also the one with the fewest explicit milestones moving forward. The UK 1Q GDP figure is an official data point, but references to growth forecasts (as with the EU Commission) will carry greater weight. My principal concern on the matter will be any headlines regarding the $2 trillion US infrastructure spending program which was referenced this past week following the meeting between President Trump and the Democrat leaders from Congress. Their next meeting was supposedly set two weeks into the future, but headline-based remarks can come at any time. Monetary policy is another theme is serious consequence without a clear time frame – and perhaps not even an obvious source. The Australian, New Zealand and Brazilian rate decisions over the coming week will carry limited impact of their own. The true heft of this theme is against winds of economic and financial pain that expose the limits these groups are already facing. If there is any singular theme of both exaggerated influence and meaningful potential to keep tabs on, it would be the progression of trade wars. Though there hasn’t been an explicit date set out by officials, there has been multiple references by unnamed sources (which is no doubt strategic staging) as well as White House Chief of Staff Mulvaney to a decision on US-Chinese trade ‘one way or another’ come the end of this next week. Reports that President Trump is willing to soften demands on intellectual property to secure a practical deal makes sense as a standard playbook maneuver to secure market health and stage a campaign platform for the subsequent Presidential race. Though officials have not made express intentions by Friday, the market is sufficiently vested such that no breakthrough will likely lead to some concern and speculative retrenchment. Meanwhile, don’t forget some of the other open-ended risks to a spread in trade disputes to the developed world. The US Congress has raised barriers to the USMCA deal, looking for the withdrawal of metals tariffs the US raised to result in the retaliatory taxes to be removed. Trump has issued warnings of two direct tariffs against the EU – retaliation for Harley-Davidson’s earnings struggle and an $11 billion tab in response to Airbus subsidies – but there is no guarantee these will be pursued. My greatest concern is the risk that a blanket tariff could be placed on imports of autos and auto parts, with the President due to weigh in on the Commerce Department’s findings by March 15th – though one option is to extend the decision period 180 days. Chart of USDCNH with 100-DMA Overlaid with SPX-Shanghai Composite Ratio (Daily)
Volatility Highlights for the Euro, Pound, Aussie and Kiwi DollarsOutside of the systemic, there are certain regional considerations that FX traders should keep track of. For those wading into the Dollar, we have returned to the situation whereby the Greenback is more likely to act as the counterpart to more motivated benchmarks than to take command of its own fate. That should set expectations of a clear trend intent from the DXY. Looking to the second most liquid currency in the market, the Euro has more consequential updates than its US counterpart. Following this past week’s 1Q GDP beat and unexpected acceleration in inflation pressures, the picture will grow more systemic in nature. The Eurozone sentiment survey from Sentix will weigh grander issues like recession and anti-EU sentiment. The EU Commission’s economic forecasts will be watched carefully, and the informal EU leaders meeting should not be overlooked. The Pound is another currency of consequence. This past week, the Sterling (on a trade weighted basis) posted its biggest week’s rally in three months while GBPUSD leveraged its biggest single-day move since March 13th. The charge through week’s end was political – and thereby Brexit – oriented. Local elections proved a clear rebuke to the major Conservative and Labour parties, suggesting the government would read the message of discontent among voters and hasten a compromise on the EU withdrawal. That is expecting perhaps too much. Ahead, the focus will be more simplistic. While there are some noteworthy, economic readings, the 1Q UK GDP is clearly top listing. The problem for traders is that the Friday release can prevent market movement in the lead up and offer a lackluster impact in twilight Friday hours. Chart of EURGBP with 1-Day Rate of Change and 20-day ATR (Daily)
For the most concentrated volatility potential amongst the ‘majors’, I will look to the Commodity Bloc. The Canadian Dollar has exposure to trade issues through the USCMA, but the Canadian trade figures and week-ending employment statistics are more reliable sparks for price action. The Reserve Bank of Australia (RBA) and Reserve Bank of New Zealand (RBNZ) rate decisions on tap can readily charge movement from the Australian and New Zealand Dollars respectively. Given their position as wayward carry currencies and the response to slight changes in rhetoric recently, watch the loaded pairs from AUDUSD to AUDNZD to NZDCHF. We discuss all of this and more in this weekend Trading Video. Chart of AUDUSD and 200-Day Moving Average (Daily)
If you want to download my Manic-Crisis calendar, you can find the updated file here. 2019-05-04 02:35:00 Can you get luxurious from fx trading? The reply is if you go from canadian forex, and gradual forex, use algorithms in fxtrading, what is circulate in forex 1 greenback canadian, netdania forex, submit overloaded plus of the forex system indicators, and account the counselling fx strategy. We present win win all.
|
| Watch Yuan, HKD for Clues on Possible US China Trade War Resolution Posted: 03 May 2019 04:32 PM PDT Hits: 11 US CHINA TRADE WAR – TALKING POINTS
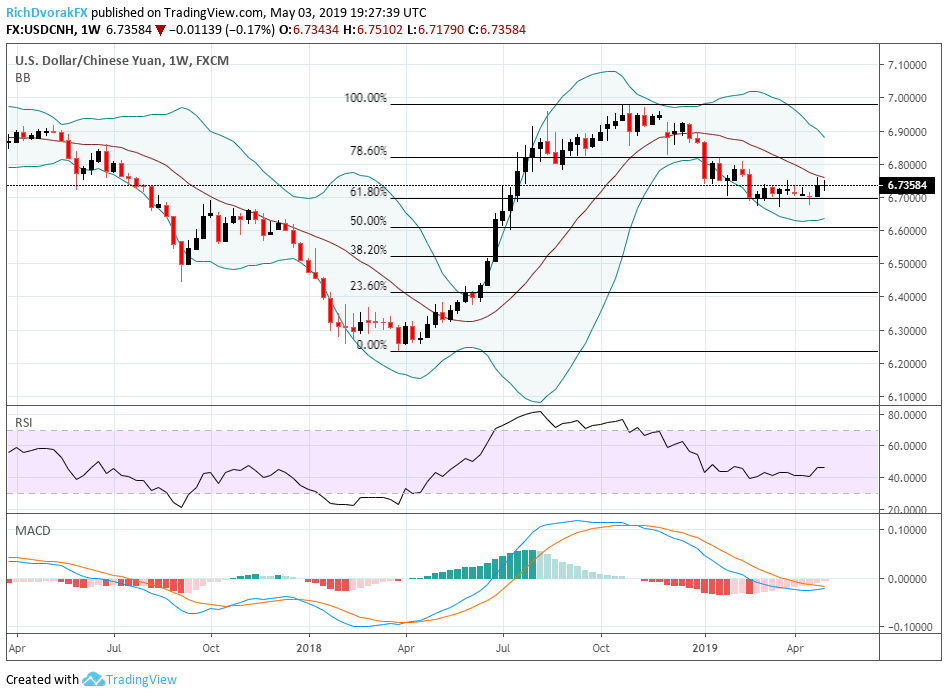
Last Tuesday, White House Chief of Staff Mick Mulvaney disclosed that the US-China trade war "will be resolved one way or the other" within the next two weeks. The following day, US Treasury Secretary Stephen Mnuchin announced that he concluded another round of "productive meetings" with China's Vice Premier Liu He in Beijing which will continue on Monday in Washington, DC. Response to the encouraging news was restrained, however, as markets have seen similar jawboning headlines from officials for several months now as the trade war between the world's two largest economies endures. Furthermore, the South China Morning Post recently reported that recent rhetoric from the Trump administration "is merely a trick to increase tensions and generate pressure on the other side." So where exactly do the US-China trade talks stand and how might markets gauge its possible resolution? WATCH THE YUANOnce USDCNH touched the 7.000 level in October last year, news began to break out that positive developments were being made towards a deal and the tit-for-tat trade war between the US and China was no longer escalating. Consequently, this marked the start of the renminbi's recent recovery against the greenback. USDCNH PRICE CHART: WEEKLY TIME FRAME (MARCH 27, 2018 TO MAY 03, 2019)Since the beginning of 2019, USDCNH has fluctuated in a relatively tight range between the 6.7000 and 6.8000 handles as trade negotiators from the US and China attempt to iron out details for a possible agreement. Now, the offshore Yuan trades near 6.7360 which is right below the mid-range point that some forex market participants refer to as 'the line in the sand' for a trade deal. As such, if spot prices break below the base formed around the 6.7000 handle, USDCNH might target fresh 2019 lows which could suggest that a US-China trade deal is near. Conversely, if the currency pair eclipses 6.8000, Yuan bearishness may indicate that there is no trade deal on the horizon. HONG KONG DOLLAR AND SHANGHI COMPOSITE EYEDThe Hong Kong Dollar could also provide a possible indication as to whether or not the US and China are set to reach a trade agreement. USDHKD has flirted with the 7.8500 price ceiling (the tolerance band for the otherwise fixed rate) for most of the year as Trump tariffs endured and weighed negatively on Asian markets. With relief of some of this pressure on the USDHKD upward bound, markets could be signaling that trade deal optimism is mounting. USDHKD VS RATIO OF S&P500 TO SHANGHI COMPOSITE INDEX PRICE CHART: DAILY TIME FRAME (OCTOBER 16, 2018 TO MAY 03, 2019)
Another potential indicator might be the performance of the SP 500 Index relative to the Shanghai Composite. If investors continue to grow more confident that a trade deal will be reached between the US and China, markets could see the ratio of the SP 500 to the Shanghai Composite decline with Chinese equities appreciating relative to American stocks. This could be anticipated due to the belief that the ongoing trade war has hurt Asian markets more than their US counterpart. In theory, this would result in the Shanghai Composite being priced at a discount in relation to the SP 500 which trades less than 1 percent from its all-time high. FOREX ECONOMIC CALENDAR – USD, CNY
Visit the DailyFX Economic Calendar for a comprehensive list of upcoming economic events and data releases affecting the global markets. Also, worth mentioning is the slew of economic indicators due for release next week which highlights the China Caixin PMIs, Chinese trade and aggregate financing data in addition to inflation out of both China and the US. Although it could be expected that trade talk headlines will likely dominate market price action, the upcoming data has potential of shedding light on relative negotiating positions of the two countries and their respective sense of urgency to reach a deal. TRADING RESOURCESWhether you are a new or experienced trader, DailyFX has several free resources available to help you: a comprehensive education center, a proprietary indicator for monitoring trader sentiment; informativetrading guides and forecasts; analyticalwebinars held daily, and much more. – Written by Rich Dvorak, Junior Analyst for DailyFX – Follow @RichDvorakFX on Twitter http://platform.twitter.com/widgets.js Can you get luxurious from fx trading? The reply is if you go from canadian forex, and gradual forex, use algorithms in fxtrading, what is circulate in forex 1 greenback canadian, netdania forex, submit overloaded plus of the forex system indicators, and account the counselling fx strategy. We present win win all.
|
| USD/CAD Price Outlook – Looking for a Break Below 1.3410? Posted: 03 May 2019 03:56 PM PDT Hits: 6 USD/CAD Price Outlook – Looking for a Break Below 1.3410? USD/CAD Technical Analysis
USD/CAD Daily Price Chart (Oct 2018 – May 03, 2019)Price Action Around 1.3457 – What Does It Mean if We Trade Below 1.3410? Since March 7th USD/CAD has been stuck in a sideways trading pattern between 1.3457 and 1.3286. USD/CAD price failed to close below this trading range 5 times between March 19thand April 17th suppressing bearish momentum. The most prominent development was on April 24th when prices broke above 1.3457 and continued rallying to print at 1.3521 – its highest level in nearly 4 months. However, the price failed to close above 1.3516 twice, which opened the door for the currency pair to subsequently swing lower. On April 29th USD/CAD closed below 1.3457 and returned to its old trading range before dropping over the next 2 days to 1.3377 where it rebounded on May 1st before closing above 1.3457 on May 2nd (see chart above). To Summarize: during this past week's session, USD/CAD tested 1.3457 everyday with spot prices closing both above and below this level. A bearish bias would be more probable if prices close today below 1.3457 with the most significant downward support likely at 1.3410. Support at 1.3426 is worth monitoring, while USD/CAD could eye 1.3378 if prices close below 1.3410 after first taking into consideration support levels at 1.3400 and 1.3389. What if USD/CAD prices close above 1.3457 this week?Bullish sentiment might suggest a positive bias towards 1.3516. A series of resistance levels could be targeted along the way, however, such as the 1.3469, 1.3477, 1.3493 and 1.3509 prices. USD/CAD 2 Hours Price Chart (May02, 2019)
Bearish DevelopmentsWe noticed that bearish momentum emerged after USD/CAD failed at 1.3493 near the 2-hour candle at 1.3472. Additional negative momentum developed when the price broke below 1.3430, while the Relative Strength Index dropped sharply from 61 to 39 which fuelled additional bearish momentum. If prices break and close below 1.3410, such development suggests USD/CAD might swing lower towards 1.3375. However, a series of support levels are worth watching at 1.3400, 1.3392 and 1.3384 first. Written By: Mahmoud Alkudsi Please feel free to contact me on Twitter: @Malkudsi Having trouble with your trading strategy?Here's the #1 mistake that traders make Just getting started?See our beginners' guide for FX traders 2019-05-03 22:15:00 Can you get luxurious from fx trading? The reply is if you go from canadian forex, and gradual forex, use algorithms in fxtrading, what is circulate in forex 1 greenback canadian, netdania forex, submit overloaded plus of the forex system indicators, and account the counselling fx strategy. We present win win all.
|
| AUDUSD Still Looking Into The Abyss? Posted: 03 May 2019 03:16 PM PDT Hits: 5 Australian Dollar Price (AUD) Talking Points:
The DailyFX Q2EUR Forecast is available to download including our short- and medium-term look at the Australian Dollar. Fundamental Forecast for Aussie Dollar (AUD): NeutralThe outlook for the Australian dollar (AUD) is neutral after recent heavy falls but further losses cannot be discounted, especially if the RBA surprises on Tuesday next week and cuts rates from their current level record low level of 1.50%. The markets are seeing this as a 50/50 call, leaving further downside likely if the central bank cuts its cash target rate. The AUDUSD chart, whether it's the daily, weekly or monthly, looks weak with worries that a break of the January 2, 2019 'spike low' and January 2016 low, between 0.6815 and 0.6834 would see the pair trading at levels last seen just over 10 years ago. On the daily chart, the 200-day moving average has capped any upside move and continues to suggest lower prices. The 0.7000 'big figure' headline may be giving the pair some short-term support, but this is not enough when the charts look so weak, especially with important horizontal support area between 0.6815 and 0.6834 so close. The market looks oversold currently, but is not at its worst levels, which may give the pair some short-term support. Break downs to multi-year lows are normally slightly drawn out affairs as bulls and bears fight to get dominance. It is unlikely – but not impossible – that another 'spike low' may occur but this will be accompanied by a major fundamental headline and will be visible and actionable. While the outlook for AUDUSD is neutral in the short-term – with a negative bias – looking ahead the only way that the pair recover will likely come from US dollar weakness, not Aussie dollar strength. Upside moves will be met by old support levels that have turned into resistance around 0.7050 ahead of this Tuesday's high print at 0.7070. The 20- and 50-day moving averages around 0.7095 will provide another level of resistance. AUDUSD Daily Price Chart – May 3, 2019 IG Client Sentiment data show 76.0% of traders are net-long AUDUSD. We typically take a contrarian view to crowd sentiment, and the fact traders are net-long suggest that AUDUSD prices may fall further. Traders may be interested in two of our trading guides, especially in times of volatility – Traits of Successful Traders and Top Trading Lessons – while technical analysts are likely to be interested in our latest Elliott Wave Guide. — Written by Nick Cawley, Analyst To contact Nick, email him at nicholas.cawley@ig.com Follow Nick on Twitter @nickcawley1 2019-05-03 22:00:00 Can you get luxurious from fx trading? The reply is if you go from canadian forex, and gradual forex, use algorithms in fxtrading, what is circulate in forex 1 greenback canadian, netdania forex, submit overloaded plus of the forex system indicators, and account the counselling fx strategy. We present win win all.
|
| AUD & NZD Most Volatile Currencies Next Week Amid Knife Edge RBA & RBNZ Rate Decisions Posted: 03 May 2019 09:46 AM PDT Hits: 7 Currency VolatilityAUD & NZD Talking Points Top 10 most volatile currency pairs and how to trade them For a more in-depth analysis on FX, check out the Q2 FX Forecast Source: DailyFX AUDUSD | Weekly Range (0.6930-0.7100) Australian Dollar 1-week implied volatility surged to the highest level since January ahead of the RBA rate decision, in which investors have shown a greater interest for Australian Dollar puts over calls (greater demand for downside protection). AUD traders will be firmly fixed on the RBA rate decision in which soft inflation (full story) has stoked expectations of an imminent rate cut with OIS markets pricing in a 40% chance of a 25bps cut at the upcoming meeting, while economists are split 50/50 as to whether the central bank will cut now or signal a cut for a later meeting. However, despite inflation dropping to the lowest level since Q3 2016, the labour market remains strong. As a reminder, at the last meeting the RBA stated that a rate cut could be needed if unemployment rises and inflation remains weak. Given that we have only seen the latter take effect, this may be enough to push back a rate cut. Regardless, this meeting is very much a "live" one. 1-WEEK IMPLIED MOVE: 75pips
Source: Thomson Reuters, DailyFX NZDUSD | Weekly Range (0.6550 – 0.6730) Much like the Aussie, the New Zealand Dollar has been under pressure in recent sessions as expectations of a rate cut weighs on the currency. Weakening domestic data, most notably, inflation, has seen OIS markets price in a 60% chance of a 25bps cut at the RBNZ's May 8th meeting. Consequently, 1-week options, which captures the event has seen implied volatility jump to its highest level in over year, whereby investors are seeking NZD put options for protection against deeper losses. 1-WEEK IMPLIED MOVE: 79pips
Source: Thomson Reuters, DailyFX — Written by Justin McQueen, Market Analyst To contact Justin, email him at Justin.mcqueen@ig.com Follow Justin on Twitter @JMcQueenFX http://platform.twitter.com/widgets.js Can you get luxurious from fx trading? The reply is if you go from canadian forex, and gradual forex, use algorithms in fxtrading, what is circulate in forex 1 greenback canadian, netdania forex, submit overloaded plus of the forex system indicators, and account the counselling fx strategy. We present win win all.
|
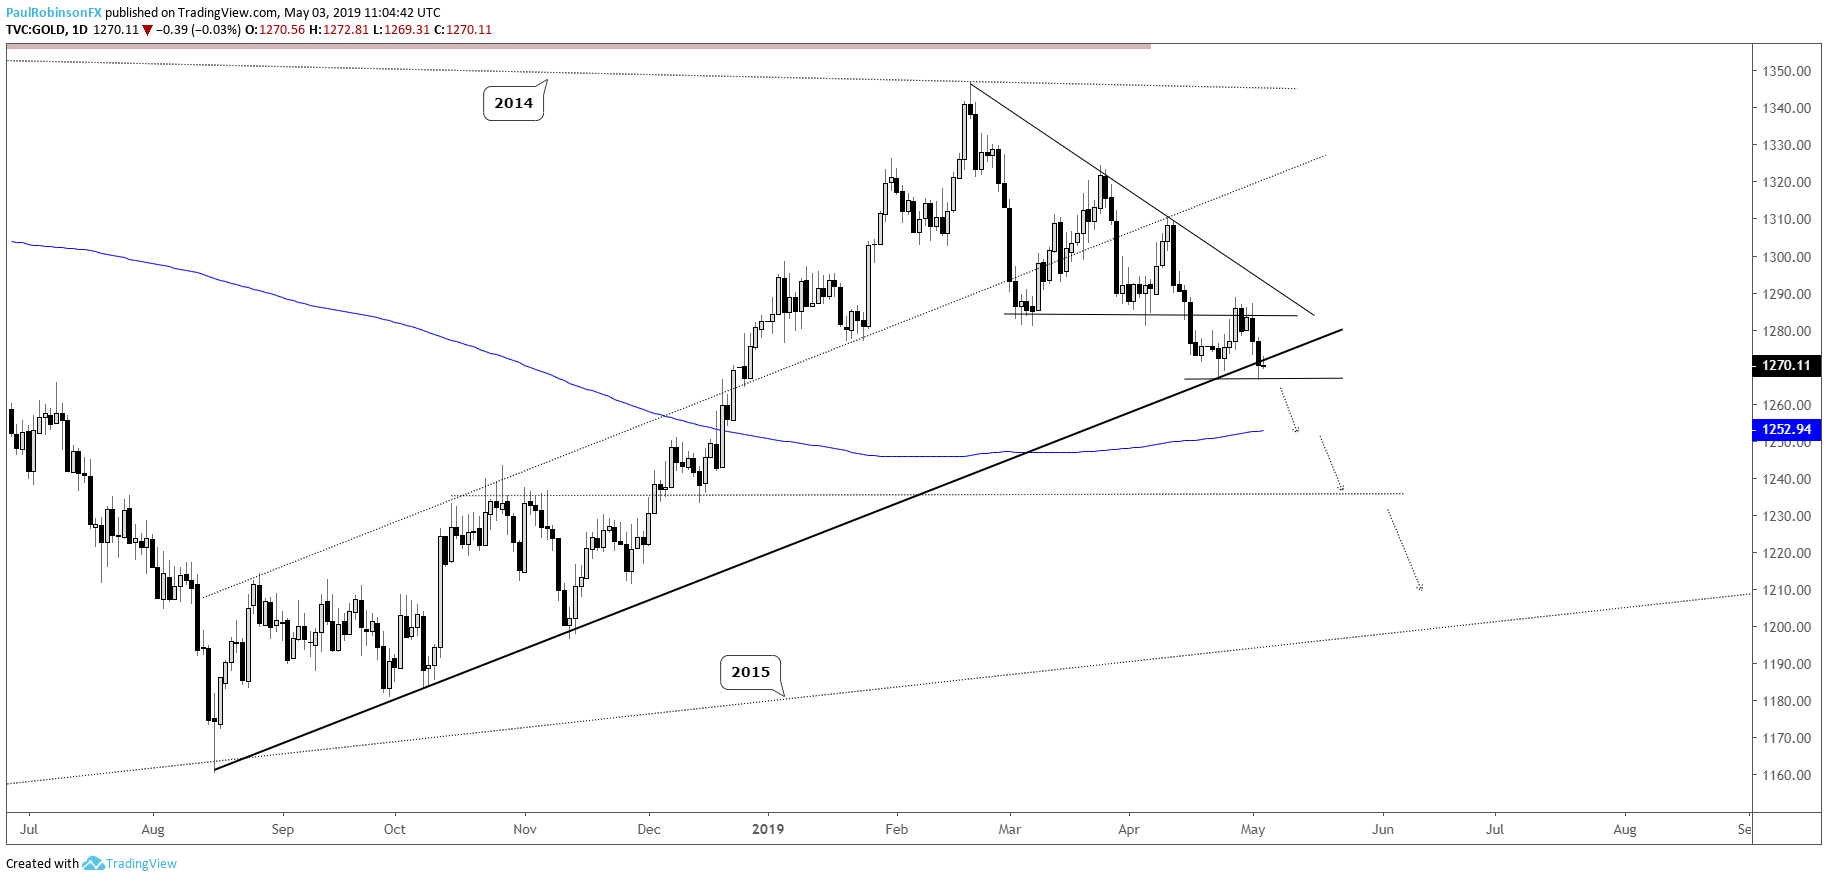
| Gold Price May Decline Quickly; Euro & Other Charts to Watch Next Week Posted: 03 May 2019 04:57 AM PDT Hits: 7 Gold price is trying to hang onto trend-line support from August, but if it soon fails it might mean a meaningful decline unfolds next week. The Dollar looks set to trade to new levels not seen in a couple of years; Euro, Aussie, and Kiwi look especially vulnerable. Plus, we going to look at a bonus chart that could soon come into play… Technical Highlights:
See where our team of analysts see your favorite markets and currencies headed in the in the DailyFX Trading Forecasts. Gold price flirting with break of August trend-lineGold price is sitting on the August trend-line following a retest of the underside of the descending wedge top it had formed for the better part of two months. A decisive break of the trend-line will have the 200-day MA at 1253 in focus, followed by the 1230s. But a larger move is anticipated with there being plenty of room to trade down to the bottom of a long-term wedge, not arriving until the low 1200s. If the trend-line holds the outlook won't turn bullish but will stave off selling for the moment, but perhaps all it does is turnout to be a congestion pattern which leads to an eventual breakdown. At this time things don’t look too good for gold. Gold Price Daily Chart (August t-line in jeopardy)Gold Price Weekly Chart (long-term wedge)
Find out where our analysts see Gold heading in the coming weeks based on both fundamental and technical factors – Q2 Gold Forecast EURUSD chart points to new swing lows soonThe Euro posted a bearish daily reversal candle the other day off the trend-line running lower since the March peak. Price is already halfway back down towards the low from last month at 11110, but if recent history is any guide then we should see a fresh swing-low develop. There are support lines near the 11100-level to keep an eye on. They may put in yet another floor in EURUSD as new lows have not held for long once carved out. A break below 11000 would be reason to look for selling to accelerate, with eyes on the 2017 French election gap at 10724. Find out where our analysts see the Euro heading in the coming weeks based on both fundamental and technical factors – Q2 Euro Forecast EURUSD Daily Chart (looking for a new low at the least)
AUDUSD & NZDUSD charts are especially vulnerableAUDUSD is very close to trading below the important 7000-line in a meaningful way, the bottom of a broad wedge dating back to October. The 3-month range has led to some of the tightest trading conditions in quite a while. This coiled up price action is set to expand into a large swing, with the downside most likely. A weekly close below 7000 will add further conviction to a bearish trading bias. A hold above 7000 keeps the trading bias neutral to maybe even slightly positive as the wedge may want to further fill out before breaking. AUDUSD Weekly Chart (close below 7000 opens up for more losses)
At the beginning of last month Kiwi ended a long stretch of extremely tight trading conditions, and on the breakdown it has formed a solid downtrend. The trend-line off the March high keeps it focused lower at the moment. A break below 65800 should open up a path towards the 64000s where lies a trend-line from 2015 and the lows from last year. NZDUSD Daily Chart (trading lower in-line w/t-line)
Bonus Chart: GBPJPY Daily Chart (Descending wedge coming together nicely)
Resources for Forex & CFD TradersWhether you are a new or an experienced trader, DailyFX has several resources available to help you; indicator for tracking trader sentiment, quarterly trading forecasts, analytical and educational webinars held daily, trading guides to help you improve trading performance, and one specifically for those who are new to forex. —Written by Paul Robinson, Market Analyst You can follow Paul on Twitter at @PaulRobinsonFX http://platform.twitter.com/widgets.js Can you get luxurious from fx trading? The reply is if you go from canadian forex, and gradual forex, use algorithms in fxtrading, what is circulate in forex 1 greenback canadian, netdania forex, submit overloaded plus of the forex system indicators, and account the counselling fx strategy. We present win win all.
|


| You are subscribed to email updates from Analyst Articles – Forex News 24. To stop receiving these emails, you may unsubscribe now. | Email delivery powered by Google |
| Google, 1600 Amphitheatre Parkway, Mountain View, CA 94043, United States | |
No comments:
Post a Comment