
Forex analysis review |
- Weekly EURUSD technical analysis
- Weekly Gold analysis
- May 17, 2019 : EUR/USD Intraday technical analysis and trade recommendations.
- EUR/USD: Chinese trick, Italian populism, and British failure
- Who seeks to take the place of May?
- EUR/USD. May 17. Results of the day. Inflation in the eurozone is not interested in foreign exchange market participants
- The dollar has a risk appetite
- Bitcoin analysis for May 17, 2019
- May 17, 2019 : GBP/USD Intraday technical analysis and trade recommendations.
- Analysis of Gold for May 17, 2019
- USD/JPY analysis for May 17, 2019
- Fractal analysis of major currency pairs on May 17
- Trading Plan for EUR / USD pair on 05/17/2019
- Markets are trying to believe in the strength of the American economy: we expect a continuation of the decline in EUR/USD
- A review of EUR / USD and GBP / USD pairs on 05/17/2019: A little bit of good
- Technical analysis of NZD/USD for May 17, 2019
- Technical analysis of USD/CAD for May 17, 2019
- In June, the dollar can update highs
- Simplified wave analysis and forecast for EUR/USD and AUD/USD on May 17
- EURUSD: The fall of the euro may slow down after inflation data, but the short-term trend is on the side of sellers
- GBP/USD. May 17. Trading system "Regression Channels". Theresa May can leave her post until mid-June
- EUR/USD. May 17. Trading system "Regression Channels". Inflation in the European Union may cause a new fall in the euro
- Bitcoin. The bulls were quick to take profits. Bitcoin exchange rate returned to the level of 7000 USD
- The forecast for EUR/USD and GBP/USD on May 17. The pound falls into the abyss. Theresa May will resign only after the completion
- Wave analysis of EUR / USD and GBP / USD for May 17. Euro may take a pause, pound sterling continues to collapse
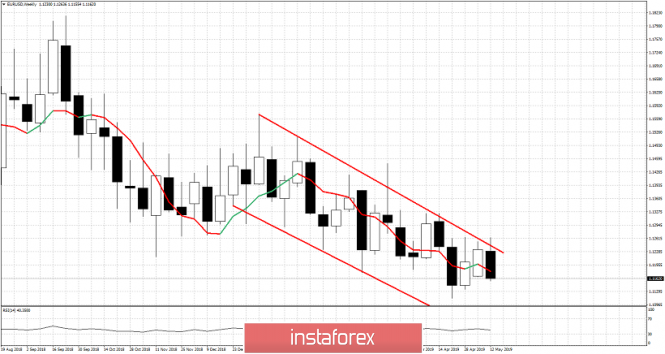
| Weekly EURUSD technical analysis Posted: 17 May 2019 12:22 PM PDT EURUSD is ending the week below 1.1170. Despite reaching 1.1260 resistance area price could not break out and above the long-term bearish channel. The rejection was a bearish sign and as we warned the inability to break above 1.1230 combined with a double rejection at 1.1230 has led us to expect a move towards 1.11 is coming.
EURUSD has been trading inside this red bearish channel for some time now. The upper channel boundary remains important and confirmed resistance as price could never close above it over the last few months. The rejection at 1.1260 has led to a break below 1.12 and we are now seeing a potential move towards 1.11 or lower as price has also broken below 1.1170. EURUSD remains in a bearish trend as long as price is below 1.1230-1.1260. The weekly black candle implies more downside is more probable, unless bulls retake 1.1260. The material has been provided by InstaForex Company - www.instaforex.com |
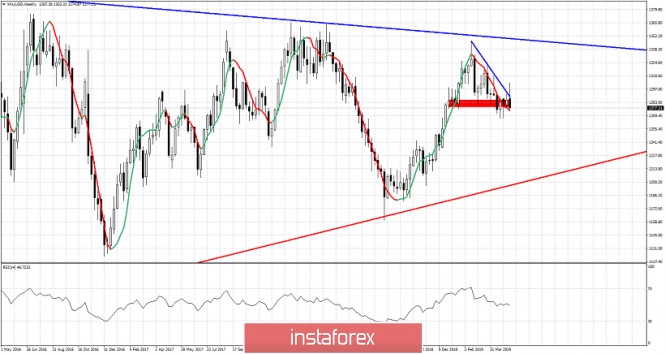
| Posted: 17 May 2019 12:17 PM PDT Gold price started this week on a strong foot breaking above $1,290 and reaching $1,302. However this strength was short-lived and it now looks more like a fake break out and a bull trap. Gold price ends the week below $1,280. The weekly candle cautions for more downside to come.
Red line - major trend line support Red rectangle - short-term support Gold price is ending the week below $1,280 and the bearish black candle with the long upper tail implies that the move above $1,290 was most probably a fake break out. Gold price has support at $1,276 as we mentioned in previous posts and a break below it will open the way for another leg down in Gold price towards $1,250-30 area. Resistance remains at $1,300 as we noted in previous posts. Bulls need to recapture and stay above of $1,300 in order for them to be in control of the trend. The major rejection back in January at $1,347 may lead to a move towards the red upward sloping major trend line support. This gives us a target between $1,200-$1,220. The material has been provided by InstaForex Company - www.instaforex.com |
| May 17, 2019 : EUR/USD Intraday technical analysis and trade recommendations. Posted: 17 May 2019 10:20 AM PDT
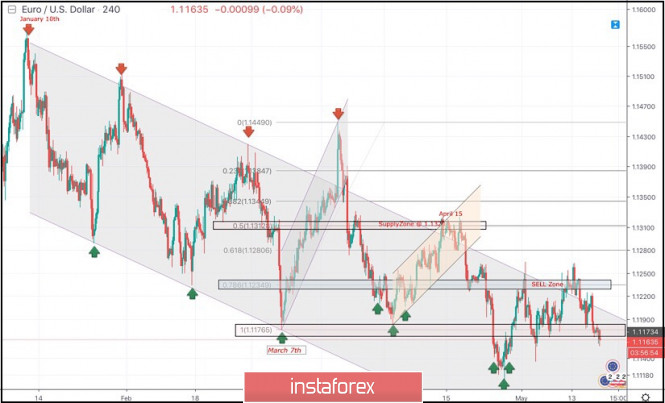
Few weeks ago, a bullish Head and Shoulders reversal pattern was demonstrated around 1.1200. This enhanced further bullish advancement towards 1.1300-1.1315 (supply zone) where significant bearish rejection was demonstrated on April 15. Short-term outlook turned to become bearish towards 1.1280 (61.8% Fibonacci) then 1.1235 (78.6% Fibonacci). For Intraday traders, the price zone around 1.1235 (78.6% Fibonacci) stood as a temporary demand area which paused the ongoing bearish momentum for a while before bearish breakdown could be executed on April 23. That's why, the mentioned price zone around 1.1235-1.1250 has turned into supply-zone to be watched for bearish rejection. Shortly-after, the market has failed to sustain bearish pressure below the price Level of 1.1175 during last week's consolidations. That's why, another bullish pullback was expected to occur towards the price zone of 1.1230-1.1250 where significant bearish pressure was expected to be existing there. Recently, the EURUSD pair has been maintained above the depicted key-zone (1.1175) since May 3. However, a bearish breakout below 1.1175 was achieved Today. This enhances further bearish decline towards 1.1115. Trade recommendations : Conservative traders who were advised to have a SELL entry around the supply zone (1.1235-1.1250) should lower their S/L towards 1.1190 to secure more profits. Remaining Target level should be projected towards 1.1115. The material has been provided by InstaForex Company - www.instaforex.com |
| EUR/USD: Chinese trick, Italian populism, and British failure Posted: 17 May 2019 09:53 AM PDT The currency market continues to be dominated by anti-risk sentiment. The news background is getting darker every day, putting pressure on both the euro and other high-yield currencies. The fundamental picture really leaves much to be desired: only in the last day, it became known that the Brexit talks finally failed, China is ready to withdraw from the negotiation process with the United States, and Italian politicians intend to violate the EU budget rules. And this is only the basic, most high-profile rumors that determine investor sentiment. Macroeconomic reports, whatever they were – with a plus or minus sign – faded into the background and actually lost their influence on the dynamics of trading. The financial world is frozen in anticipation of global changes and important decisions – and these decisions are primarily political in nature. Even during the Asian session, the market was stirred up by the news that China may withdraw from the negotiation process with Washington. Although this information is not official, it was circulated in the state media of China. According to journalists, the Chinese side "does not see sincere intentions" of the Americans to find a compromise and conclude a mutually beneficial deal. Instead, the White House, according to representatives of the PRC, professes a policy of trade protectionism that prevents negotiations. Most likely, we are talking about Huawei, for which Trump announced a state of emergency in the country in the field of information and communication infrastructure. This allowed the US Department of Commerce to blacklist Huawei and 70 associated companies from using US components and technology. It is worth noting that this company is one of the world's largest suppliers of telecommunications equipment so Beijing could not ignore Trump's actions. There is another version explaining the demarche of the Chinese side. According to some experts, Xi Jinping decided to take a wait-and-see position against the backdrop of the upcoming US presidential elections, which are only a year and a half away. It is worth noting that before Trump was almost an absolute favorite of the presidential campaign in 2020 – until the election scene came Joe Biden. The representative of the Democrats ahead of schedule won the primaries (he is much ahead of the nearest rivals), so now he focused only on one political "target", unleashing a flurry of criticism on the incumbent President. This tactic is already bearing fruit: according to the first survey, which was conducted by the influential American publication The Hill, former US Vice President Joe Biden is 6 points ahead of Donald Trump in the ranking of presidential candidates. So, 43% said they would choose Biden, and 37% said they would prefer Trump. This electoral advantage is rather indicative: the incumbent President has a real rival, who even at the start is ahead of him in terms of points. By the way, The Hill is considered a publication, "favor" relating to the Republicans. Given this disposition, the Chinese can continue to take a defensive position in the hope that the White House will change its owners next fall. Trump has already warned China against such intentions, hinting at the aggravation of their position during his (possible) second term – but Beijing's actions indicate that the Chinese are not ready to conclude a deliberately losing party for themselves. In this context, the G20 will be a significant event. A meeting of the leaders of the United States and China can take place on the "fields" of the G-20 summit, which will be held in late June – at least, the head of the White House National Economic Council Larry Kudlow did not rule out this possibility. If the de facto parties for any reason avoid in-person dialogue, the prospects for trade negotiations will indeed be in big question. Brexit also exerts pressure on the euro: today, it became known that the negotiations between the May government and the Labor Party finally failed. The parties put an end to the month-and-a-half dialogue and returned to mutual accusations of a political nature. Theresa May expressed confidence that the Conservative Party will be able to bring the Brexit process to its logical conclusion, while the Labor Party said that the current composition of the Cabinet of Ministers is similar to Titanic in the last moments before the collision with the iceberg. In other words, the situation with Brexit returned to zero, bringing down the pound and pulling the euro. The rhetoric of Italian politicians also puts pressure on the single currency. Just today, Italian Deputy Prime Minister Salvini said that the Italian government "wants to change the EU banking rules." He also noted that, in his opinion, such a structure as the European Union was created exclusively to defend German interests, including economic ones. But in this case, I would not jump to conclusions about the prospects of the conflict between Rome and Brussels: it is likely that after the elections to the European Parliament, the position of Italian politicians will significantly soften. Despite this negative array, the bears of the EUR/USD pair failed to overcome the key support level of 1.1130 (the lower line of the Bollinger Bands indicator on the daily chart) to enter the 10th figure. To help the bulls of the pair came, oddly enough, Trump, who decided to postpone for up to 6 months the decision to impose duties on imports of European cars and spare parts. Now, this information has acquired the shape of the official notification of the White House, and this fact helped buyers of EUR/USD to return to the mark of 1.1180. Nevertheless, the fundamental background for the pair still remains negative, so the bears retain the potential for a further decline to the above support level. The material has been provided by InstaForex Company - www.instaforex.com |
| Who seeks to take the place of May? Posted: 17 May 2019 09:35 AM PDT Theresa May will sooner or later leave her Prime Minister's chair, and this is already perceived as a fact. The interest now is something else: when will this happen and who will replace May. As is known, the current British Prime Minister has extended her time until the beginning of June. Another parliamentary vote on Brexit is scheduled for this period. The government expects to approve the deal and withdraw from the EU before the end of July. However, there is no certainty that an agreement three times rejected by Parliament will be adopted this time. It is rumored that May will resign before the expected time, and regardless of whether the vote on the Brexit bill passes in the first week of June or not. Now, one thing is very clear – this summer, the elections of the leader will be held. Ex-foreign minister and member of the Conservative Party, Boris Johnson, has already confirmed that he is in action. It should be noted that the Labor Party stopped negotiations with the Theresa May government since they no longer have incentives and reasons for meetings. Jeremy Corbyn said that the parties discussed everything that could be discussed. Besides, May is now mostly bankrupt for them. This topic has made the British pound the main outsider this week. In five days, the loss was 1.6%. The strongest decline in sterling was recorded on Thursday when the GBP/USD pair fell to the lowest level in three months. On Friday, the downward movement continued – the pound passed the four-month milestone. China and the USA Tensions between the two largest economies in the world increased after the White House virtually blocked Huawei and other Chinese companies from accessing the US market. In response, Beijing promised countermeasures and recalled that it would never make concessions on important issues of principle. Representatives of Huawei, in turn, said that US restrictions would lead the country to stay outside of 5G and that they would interact with the US government regarding product safety. They also announced their desire to maintain "close relations" with European countries and carriers. Donald Trump urged colleagues from Europe to follow the path of America – to ban Huawei in their markets, but they have not done it yet. I must say that Beijing and Washington are already moving on thin ice, and the situation with Huawei – if it increases significantly – can become a turning point that will lead to the collapse. Even if this does not happen, the tension will still increase, as the fire seems to have flared up. So, unexpectedly tough rhetoric was chosen by the state media of China, commenting on the course of trade negotiations. The WeChat blog on behalf of the Taoran Notes account, owned by the state publication Economic Daily, said that it was meaningless for Chinese officials to meet with the US delegations without their sincere desire to sign a trade agreement. The material has been provided by InstaForex Company - www.instaforex.com |
| Posted: 17 May 2019 09:26 AM PDT 4-hour timeframe The amplitude of the last 5 days (high-low): 41p – 42p – 43p – 47p – 58p. The average amplitude over the last 5 days: 46p (50p). The main indicator of the consumer price index in the eurozone for April was fully consistent with the forecasts of experts and amounted to +1.7% in annual terms and +0.7% in monthly terms. Only the basic consumer price index was higher than market expectations and amounted to +1.3% y/y. However, as we can see, this rather important report did not bring any changes to the current trend. The euro is still prone to fall, and the reaction to today's inflation report from traders was not even followed. Thus, we continue to draw the attention of traders to the fact that now in the first place are clearly technical factors. Namely: the non-renewal of the previous local maximum, frankly a downward trend in 2019, and the weakness of the bulls. If we add to this the absence of a positive fundamental background from Europe, it becomes clear that the path of the euro is one – to the South. Just moving down the pair will not be as fast and zealous as the pound. Now, we expect the EUR/USD pair to decline to 1.1100, but most likely the pair will go below this level. In a few hours, the US will publish a fairly important index of consumer confidence of the University of Michigan. It is expected that the value for May will exceed April. Thus, at the US session on Friday, May 17, the US dollar may receive additional support. The volatility of the instrument remains low. The downward movement is not recoilless, therefore, intraday positions are not entirely rational. The best time of deals for the pair is now 2-3 days. During this time, the pair can pass at least 70-100 points. Trading recommendations: The pair EUR/USD resumed its downward movement. Therefore, it is still recommended to consider sell positions with the targets at 1.1131 and 1.1118 and before the MACD indicator turns upwards. It will be possible to return to buy positions if traders manage to consolidate back above the critical line. In this case, the first target for the long positions will be the resistance level of 1.1268. In addition to the technical picture should also take into account the fundamental data and the time of their release. Explanation of illustration: Ichimoku Indicator: Tenkan-Sen – red line. Kijun-Sen – blue line. Senkou Span A – light brown dotted line. Senkou Span B – light purple dotted line. Chinkou Span – green line. Bollinger Bands Indicator: 3 yellow lines. MACD: A red line and a histogram with white bars in the indicator window. The material has been provided by InstaForex Company - www.instaforex.com |
| The dollar has a risk appetite Posted: 17 May 2019 09:00 AM PDT Looking at how the US stock market in May first collapsed and then began to recover under the influence of Donald Trump's tweets, you make sure that it becomes a toy in the hands of the US President. A statement on the introduction of duties on all Chinese imports sent the S&P 500 to a knockdown, but the stock index managed to recover and mark a three-day rally after it was announced that the deal with China would be concluded earlier than people assumed. The most interesting thing is that the US dollar fell due to the escalation of the trade conflict, and then grew due to the optimism of Donald Trump. It behaves as a risky asset, although it is usually referred to as a safe haven currency. What is it? While the rates on 10-year US Treasury bonds are 2.4%, and on German and Japanese analogs are negative in conditions of high-risk appetite and historically low volatility, the carry trade strategy with the participation of EUR/USD and USD/JPY begins to flourish. Players on the difference borrow money in countries with low borrowing costs and invest them in profitable assets. Thanks to the Fed's desire to keep the Federal funds rate at 2.5% for an infinitely long time and the belief in the imminent end of the trade war between Washington and Beijing, carry-traders felt like a fish in the water, but Donald Trump's tweets turned everything upside down. Funding currencies represented by the euro and the yen began to be in high demand, and stock indices pulled the USD index down. Dynamics of Dow Jones and US Dollars The "bears" on USD/JPY felt more confident than "bulls" on EUR/USD, due to the aggravation of political problems in the Old World. Not only that the chances of the resignation of Theresa May from the post of British Prime Minister increased significantly, which drowned the pound, but also the elections to the European Parliament decided to remind themselves of the Italian populists. Vice Prime Minister Salvini said he would lift the EU's tough requirements of a 3% budget deficit from GDP, and let Brussels do what it wants. The exacerbation of political risks is a negative factor for the euro, and as the elections approach, they will increase. From the point of view, the key event for EUR/USD in the week to May 24 will be the release of data on business activity in Germany and the eurozone in May. Participating in Markit's survey, procurement managers already knew about the escalation of the US-Chinese trade conflict so the statistics can be disappointing, which will create the preconditions for the continuation of the southern hike of the main currency pair. To support the euro, the correction in world stock markets is needed. In this situation, the demand for funding currencies will increase. Technically, a breakthrough of support at 1.1135 on the daily EUR/USD chart will increase the risks of target implementation by 161.8% using the AB = CD pattern. It corresponds to a mark of 1.1. In order to maintain hope for the activation of the "Wolfe Waves" reversal pattern and the fulfillment of its targets, the "bulls" should return quotes above 1.127. The material has been provided by InstaForex Company - www.instaforex.com |
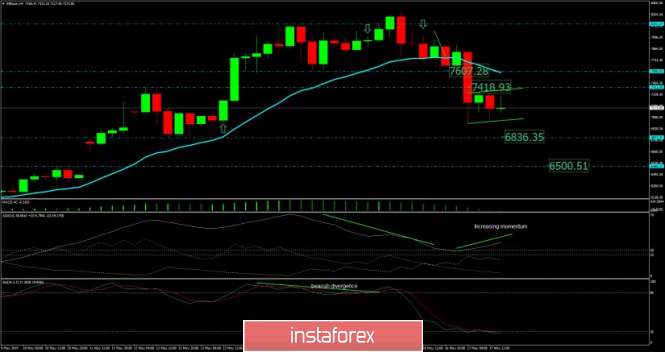
| Bitcoin analysis for May 17, 2019 Posted: 17 May 2019 08:37 AM PDT BTC has been trading downwards as we expected. The price tested the level of $6.955. We still expect downside.
Both of your yesterday's targets at $7.607 and $7.418 were met. We found strong reaction from sellers and strong drop on BTC. Most recently, there is the potential bearish flag in creation, which is sign that we should see more downside. The ADX is reading is above 30 and increasing, which is signal that down momentum is strong. Watch for selling opportunities on the rallies. Downwards references are set: $6.836 $6.500 Upward references are set: $7.347 $8.316 The material has been provided by InstaForex Company - www.instaforex.com |
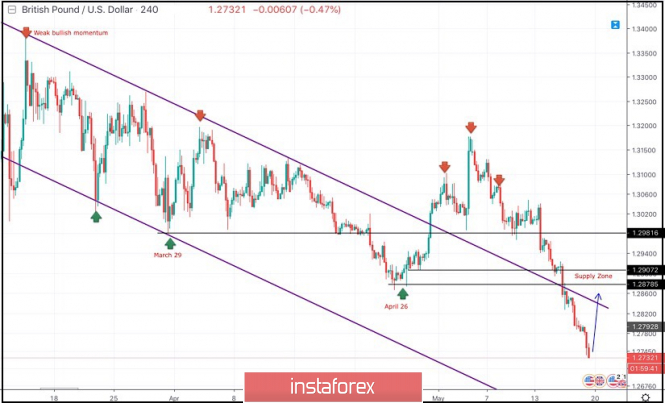
| May 17, 2019 : GBP/USD Intraday technical analysis and trade recommendations. Posted: 17 May 2019 08:34 AM PDT
On March 29, the price levels of 1.2980 (the lower limit of the newly-established bearish movement channel) demonstrated significant bullish rejection. This brought the GBPUSD pair again towards the price zone of (1.3160-1.3180) where the upper limit of the depicted bearish channel was located. Since then, Short-term outlook has turned into bearish with intermediate-term bearish targets projected towards 1.2900 and 1.2850. On April 26, a bullish pullback was executed towards the price levels around 1.3000 (the bottom of March 29) where temporary bullish breakout was temporarily executed until May 13 when evident bearish rejection was demonstrated. Hence, a bearish Head and Shoulders pattern was expressed on the H4 chart with neckline located around 1.2980. That's why, the price zone of 1.3030-1.3060 turned to become a prominent supply-zone where a valid bearish entry was offered by the end of last week's consolidations. Bearish persistence below 1.2980 (Neckline of the reversal pattern) enhanced further bearish decline. Initial bearish Targets were already reached around 1.2900-1.2870 (the backside of the broken channel) which failed to provide any bullish support for the GBPUSD pair. Currently, The GBPUSD pair looks oversold around the current price levels (1.2730). However, no signs of bullish recovery have been manifested yet. Trade Recommendations: For those who had a valid SELL entry around the price levels of (1.3035-1.3070). It's already running in profits. S/L should be lowered to 1.2780 to secure more profits. Conservative traders should wait for another bullish pullback towards 1.2870-1.2905 (newly-established supply zone) to look for valid sell entries. S/L should be placed above 1.2950. The material has been provided by InstaForex Company - www.instaforex.com |
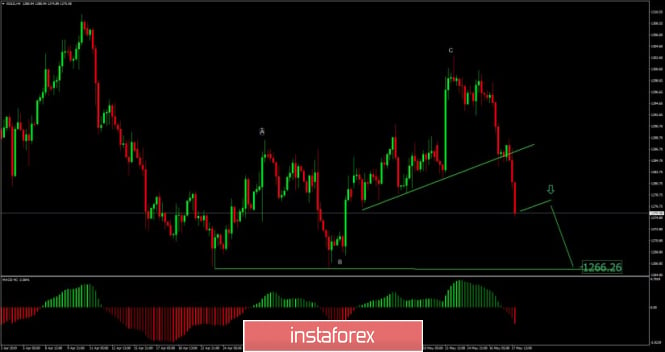
| Analysis of Gold for May 17, 2019 Posted: 17 May 2019 08:30 AM PDT Gold has been trading downwards as we expected. The price tested the level of $1.275. We still expecting more downside.
According to the 4H time-frame, we found that there is the breakout of the upward trendline (green line), which is sign that sellers are in control. We also found potential completion of the ABC upward correction, which adds even more weakness on the Gold. Our advice is to watch for potential bear flag in order to build more short positions. Downwards reference is set: $1.266 Upward references are set: Swing high – $1.288 Major high – $1.302 The material has been provided by InstaForex Company - www.instaforex.com |
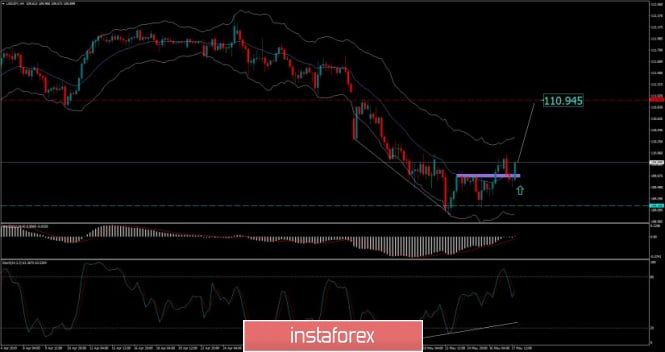
| USD/JPY analysis for May 17, 2019 Posted: 17 May 2019 08:16 AM PDT USD/JPY has been trading upside as we expected. The price tested the level of 110.02. The breakout of 3-balance is present. Watch for buying opportunities.
According to the 4H time-frame, we found that there is strong bullish divergence on the Stochastic oscillator and MACD indicator, which are strong signs that buyers took from control from sellers. Most recently, we got break of the resistance at 109.75, which is positive sign for USD/JPY. Our advice is to watch for buying opportunities with the target at 110.94. Downwards references are set: Balance high – 109.83 Daily low – 109.30 Upward references are set: Swing high – 110.56 Swing low acting like resistance – 110.92 The material has been provided by InstaForex Company - www.instaforex.com |
| Fractal analysis of major currency pairs on May 17 Posted: 17 May 2019 06:34 AM PDT Hello, dear colleagues. For the currency pair Euro/Dollar, the continuation of the main downward trend is expected after the breakdown of 1.144. For the currency pair Pound/Dollar, the continuation of the downward movement is expected after the breakdown of the level of 1.2733 and the movement to the top is considered as a correction. For the currency pair Dollar/Franc, we follow the formation of the upward cycle from May 13 and the subsequent development is expected after the breakdown of 1.0113. For the currency pair Dollar/Yen, we follow the formation of the upward cycle from May 13 and we expect the development of this structure after the breakdown of 109.95. For the Euro/Yen, the continuation of the downward movement of May 10 is expected after the breakdown of 122.12. For the currency pair Pound/Yen, the subsequent development of the local structure from May 10 is expected after the breakdown of 139.65 and we consider the upward movement as a correction. Forecast for May 17: Analytical review of H1-scale currency pairs: For the currency pair Euro/Dollar, the key levels on the H1 scale are 1.1222, 1.1212, 1.1197, 1.1184, 1.1156, 1.1144 and 1.1112. We continue to follow the development of the downward structure of May 13. The short-term downward movement is expected in the range of 1.1156 – 1.1144 and the breakdown of the last value should be accompanied by a pronounced downward movement. In this case, the potential target is 1.1112 and we expect a rollback to the top from this level. The short-term upward movement is possible in the range of 1.1184 – 1.1197 and the breakdown of the latter value will lead to a prolonged correction. The target is 1.1212 and the range of 1.1212 – 1.1222 is the key support for the downward movement. We expect the initial conditions for the upward cycle. The main trend is the downward structure of May 13. Trading recommendations: Buy 1.1184 Take profit: 1.1195 Buy 1.1198 Take profit: 1.1210 Sell: 1.1156 Take profit: 1.1145 Sell: 1.1142 Take profit: 1.1116 For the currency pair Pound/Dollar, the key levels on the H1 scale are 1.2840, 1.2802, 1.2773, 1.2733, 1.2693, 1.2659 and 1.2588. We continue to follow the development of the downward structure from May 3 and the continuation of the downward movement is expected after the breakdown of the level of 1.2733. In this case, the target is 1.2693 and in the area of 1.2693 – 1.2659 is the consolidation. The breakdown of the level of 1.2659 will lead to a movement to the potential target of 1.2588, upon reaching which, we expect a rollback to the top. The short-term upward movement is possible in the area of 1.2773 – 1.2802 and the breakdown of the latter value will lead to a prolonged correction. The target is 1.2840 and this level is the key support for the downward structure. The main trend is the downward cycle of May 3. Trading recommendations: Buy: 1.2773 Take profit: 1.2802 Buy: 1.2804 Take profit: 1.2840 Sell: 1.2732 Take profit: 1.2694 Sell: 1.2656 Take profit: 1.2590 For the currency pair Dollar/Franc, the key levels on the H1 scale are 1.0160, 1.0142, 1.0131, 1.0113, 1.0084, 1.0072 and 1.0048. We follow the formation of the upward structure of May 13. The continuation of the upward movement is expected after the breakdown of 1.0113. In this case, the target is 1.0131 and in the area of 1.0131 – 1.0142 is the short-term upward movement, as well as consolidation. We consider the level of 1.0160 as a potential value for the top, after reaching which, we expect a rollback to the bottom. The short-term downward movement is possible in the area of 1.0084 – 1.0072 and the breakdown of the latter value will have to develop the downward structure. The potential target is 1.0048, up to this level, we expect the initial conditions for the downward cycle. The main trend is the upward structure of May 13. Trading recommendations: Buy: 1.0113 Take profit: 1.0130 Buy: 1.0142 Take profit: 1.0160 Sell: 1.0084 Take profit: 1.0073 Sell: 1.0070 Take profit: 1.0050 For the currency pair Dollar/Yen, the key levels on the H1 scale are 110.81, 110.54, 110.33, 109.95, 109.80, 109.38, 109.24, 109.01 and 108.77. We follow the formation of the upward cycle of May 13. The continuation of the upward movement is expected after the price passes the range of 109.80 – 109.95. In this case, the goal is 110.33 and in the area of 110.33 – 110.54 is the short-term upward movement, as well as consolidation. We consider the level of 110.81 as a potential value for the top, after reaching which, we expect a rollback to the bottom. The range of 109.38 – 109.24 is the key support for the upward structure of May 13. Its price passage will have to develop the downward structure. The first target is 109.01. We consider the level of 108.77 as a potential value for the bottom, to which we expect the registration of the expressed initial conditions for the downward cycle. The main trend is the upward structure of May 13. Trading recommendations: Buy: 109.95 Take profit: 110.33 Buy: 110.55 Take profit: 110.80 Sell: 109.24 Take profit: 109.02 Sell: 109.00 Take profit: 108.78 For the currency pair Canadian Dollar/Dollar, the key levels on the H1 scale are 1.3568, 1.3526, 1.3511, 1.3493, 1.3451, 1.3434, 1.3415 and 1.3378. We follow the formation of the upward structure of May 10. The continuation of the upward movement is expected after the breakdown of 1.3493. In this case, the target is 1.3511 and consolidation is near this level. The price pass of the range of 1.3511 – 1.3526 should be accompanied by a pronounced upward movement to the potential target of 1.3568, from this level, we expect a rollback to the bottom. The consolidated movement is possible in the area of 1.3451 – 1.3434 and the breakdown of the last value will lead to a prolonged correction. The target is 1.3415 and this level is the key support for the top. The main trend is the formation of the upward structure of May 10, the stage of initial conditions. Trading recommendations: Buy: 1.3493 Take profit: 1.3510 Buy: 1.3526 Take profit: 1.3566 Sell: 1.3433 Take profit: 1.3417 Sell: 1.3412 Take profit: 1.3385 For the currency pair Australian Dollar/Dollar, the key levels on the H1 scale are 0.6936, 0.6916, 0.6900, 0.6869, 0.6854 and 0.6835. We follow the development of the downward structure of May 7. The short-term downward movement is expected in the range of 0.6869 – 0.6854, hence there is a high probability of a turn into a correction. We consider the level of 0.6835 as a potential value for the downward trend, the movement to which is expected after the breakdown of 0.6852. The short-term upward movement is possible in the range of 0.6900 – 0.6916 and the breakdown of the latter value will lead to a prolonged movement. The goal is 0.6936 and this level is the key support for the downward structure. The main trend is the downward structure of May 7. Trading recommendations: Buy: 0.6900 Take profit: 0.6914 Buy: 0.6917 Take profit: 0.6934 Sell: 0.6867 Take profit: 0.6855 Sell: 0.6852 Take profit: 0.6836 For the currency pair Euro/Yen, the key levels on the H1 scale are 122.95, 122.68, 122.50, 122.12, 121.75, 121.45 and 121.09. We follow the development of the local structure for the bottom of May 10. The continuation of the downward movement is expected after the breakdown of the level of 122.12. In this case, the goal is 121.75 and in the area of 121.75 – 121.45 is the short-term downward movement, as well as consolidation. Also, from this range, there is a high probability of rollback to the correction. We consider the level of 121.09 as a potential value for the bottom, upon reaching which, we expect a rollback to the top. The short-term upward movement is expected in the area of 122.50 – 122.68 and the breakdown of the last value will lead to a prolonged correction. In this case, the goal is 122.95. The main trend is the local downward structure of May 10. Trading recommendations: Buy: 122.50 Take profit: 122.66 Buy: 122.70 Take profit: 122.95 Sell: 122.12 Take profit: 121.75 Sell: 121.73 Take profit: 121.45 For the currency pair Pound/Yen, the key levels on the H1 scale are 141.05, 140.45, 140.09, 139.68, 139.15, 138.45 and 138.03. We follow the development of the downward structure of May 10th. The continuation of the downward movement is expected after the breakdown of 139.65. In this case, the goal is 139.15 and consolidation is near this level. The breakdown of the level of 139.15 will lead to a pronounced movement to the level of 138.45 and from this level, there is a high probability of a turn to the top. The potential value for the bottom is considered the level of 138.03, upon reaching which, we expect consolidation in the area of 138.45 – 138.03, as well as a rollback to the top. The short-term upward movement is possible in the area of 140.09 – 140.45 and the breakdown of the latter value will lead to a deep correction. The target is 141.05 and this level is the key support. The main trend is the local downward structure of May 10. Trading recommendations: Buy: 140.10 Take profit: 140.45 Buy: 140.47 Take profit: 141.05 Sell: 139.66 Take profit: 139.15 Sell: 139.10 Take profit: 138.45 The material has been provided by InstaForex Company - www.instaforex.com |
| Trading Plan for EUR / USD pair on 05/17/2019 Posted: 17 May 2019 04:41 AM PDT There is no breaking news on the market. In the question of the US trade war, China is frozen. Trump's expectations for China's activity after the increase in duties in May did not materialize. In Britain, Prime May seems to be retiring in June - finally realizing that her efforts to force Britain out of the EU cannot overcome the resistance of parliament. The EUR/USD pair retreated from highs and return to the range. We buy at the breakthrough of 1.1270 and upward. We sell from 1.1130. |
| Posted: 17 May 2019 03:41 AM PDT According to the data on economic statistics, the number of building permits issued in the United States increased by 0.6% in April against a 0.2% decrease in March and a forecast of a 0.5% increase. In quantitative terms, it rose to 1.296 million versus 1.288 million. At the same time, the volume of construction of new homes increased to 1.235 million from 1.168 million last month. In percentage terms, the figure added 5.7% against 1.7%. The so-called published values of the initial applications for unemployment benefits also went to hand. They fell to 212,000 from 228,000 over the past week and the investors were completely pleased with the data on the index of manufacturing activity from the Federal Reserve Bank of Philadelphia. The index soared in the current month to 16.6 points against the April value of 8.5 points and expectations of its growth to 10.0 points. Of course, the market, which missed economic benchmarks, reacted to this news with a convincing rise in the value of the US dollar against all major currencies without exception. By and large, this market dynamic can be described simply as a reaction to strong statistics and for some reason, an information guide for conducting local transactions. In general, observing the general trend that has recently manifested itself in the foreign exchange market, we can say that while maintaining the generally positive sentiment regarding the dynamics of US economic growth, the dollar can receive support. On the one hand, it will win against major currencies because the central banks of competing currencies will clearly seek to weaken their currencies in order to support local exports. On the other hand, the preservation of positive dynamics may force the Fed to go for an increase once again in interest rates by the end of this year. Of course, such a scenario is not obvious. But if trade negotiations with China still reduce the high risks for the American economy and support it, then the Fed will have to go to the promise of raising borrowing costs as early as December 2018, which, given the current situation in the foreign exchange market will be a supporting factor for the US currency. Forecast of the day: The EUR/USD pair is consolidating in a wide range of 1.1125-1.1260. It can continue the local decline to 1.1125 if the data on consumer inflation in the eurozone published today does not show growth above forecasts. The GBP/USD pair is trading lower in the wake of the political crisis in Britain amid Brexit. Maintaining this negative trend will put pressure on the pair and its decline below 1.2780 may lead to a further fall of the pair to 1.2700. |
| A review of EUR / USD and GBP / USD pairs on 05/17/2019: A little bit of good Posted: 17 May 2019 03:35 AM PDT In general, everything went exactly as planned. Unlike the previous day, the American statistics did not disappoint investors and allowed the dollar to continue its confident strengthening. Thus, the number of new construction projects increased from 1,268 thousand to 1,235 thousand, and building permits issued from 1,288 thousand to 1,296 thousand. Growth was expected but only by 37 thousand and 2 thousand, respectively, which in fact, it was 67 thousand and 8 thousand. Yet, the pleasant surprises did not end there since the total number of applications for unemployment benefits fell not by 16 thousand but by 44 thousand. In particular, the number of initial applications for unemployment benefits decreased by 16 thousand, which should have reduced by 8 thousand, decreased by 16 thousand. The number of repeated requests dropped by 28 thousand, instead of being reduced by 8 thousand. Hence, neither a single European currency nor a pound simply had nothing to defend and they continued to lose their positions. The situation over the pound is aggravated by the ongoing disputes around Brexit since after the conservatives demanded that Theresa May promptly submit a draft agreement on secession from the European Union to the House of Commons. Thereafter, the labourists immediately declared that they would not support him if he will not take into account their position on this issue. Given that the negotiations between Theresa May and Jeremy Corbin ended in complete failure, it becomes clear that the draft agreement could arrange either Labor or the Conservatives since the parties could not find a compromise on a number of issues -but not both sides at the same time. So, whatever plan Teresa May suggests, it will still be blocked either by one or another party. Thus, it is most likely that the single European currency will rise to 1.1200. If British politicians again do not make loud statements, the pound has every chance to rise to 1.2850. |
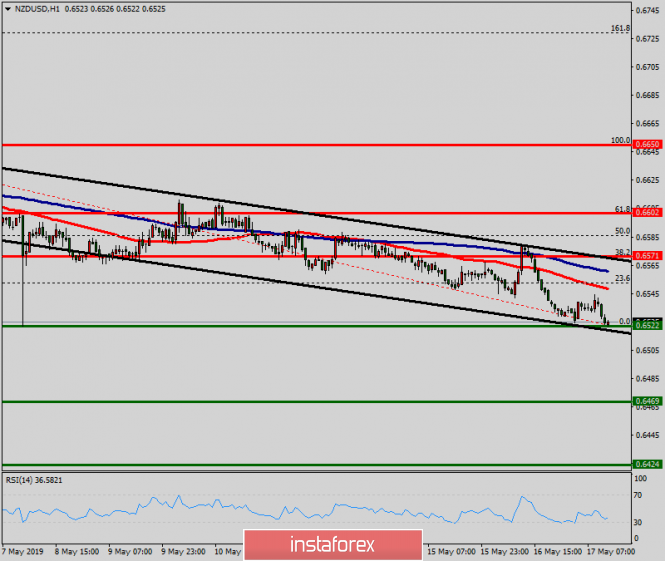
| Technical analysis of NZD/USD for May 17, 2019 Posted: 17 May 2019 03:32 AM PDT The NZD/USD pair is showing signs of weakness following a breakout of the lowest level of 0.6571. On the H1 chart, the level of 0.6571 coincides with 38.2% of Fibonacci, which is expected to act as minor resistance today. Since the trend is below the 38.2% Fibonacci level, the market is still in a downtrend. However, the resistance is seen at the level of 0.6571. Furthermore, the trend is still showing strength above the moving average (100). Thus, the market is indicating a bearish opportunity below the above-mentioned support levels, for that the bearish outlook remains the same as long as the 100 EMA is headed to the downside. Therefore, resistance will be found at the level of 0.6571 providing a clear signal to buy with a target seen at 0.6500. If the trend breaks the first supprt at 0.6500, the pair is likely to move downwards continuing the bearish trend development to the levels 0.6469 and .6424. The material has been provided by InstaForex Company - www.instaforex.com |
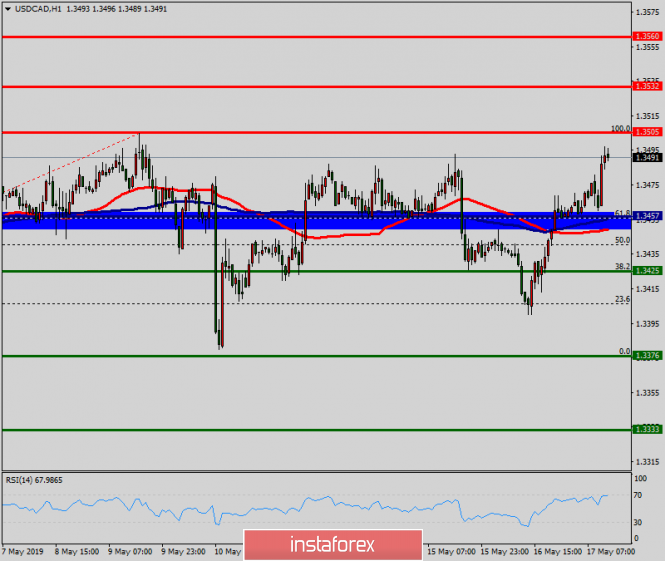
| Technical analysis of USD/CAD for May 17, 2019 Posted: 17 May 2019 03:24 AM PDT Overview: The USD/CAD pair continues to move upwards from the level of 1.3457. The pair rose from the level of 1.3457 (the level of 1.3457 coincides with a ratio of 61.8% Fibonacci retracement) to a top around 1.3505. But it rebounded from the top pf 1.3505 to 1.3477. Today, the first support level is seen at 1.3457 followed by 1.3425, while daily resistance 1 is seen at 1.3457. According to the previous events, the USD/CAD pair is still moving between the levels of 1.3505 and 1.3457; for that we expect a range of 48 pips (1.3505 - 1.3457). On the one-hour chart, immediate resistance is seen at 1.3505. Currently, the price is moving in a bullish channel. This is confirmed by the RSI indicator signaling that we are still in a bullish trending market. The price is still above the moving average (100), Therefore, if the trend is able to break out through the first resistance level of 1.3505, we should see the pair climbing towards the daily resistance at the levels of 1.3532 and 1.3560. It would also be wise to consider where to place stop loss; this should be set below the second support of 1.3425. The material has been provided by InstaForex Company - www.instaforex.com |
| In June, the dollar can update highs Posted: 17 May 2019 02:51 AM PDT Thursday was marked by the strengthening of the greenback to all major currencies. Yesterday, the dollar reached its highest value since May 3 - 97.8 points. Today, the USD index continues to trade near the 2-week high. The American currency was supported by the April release of the real estate market and the weekly report on applications for unemployment benefits, which showed that the US labor market is still in very good shape. Yesterday, the yield on 10-year-old treasuries fell to a 2-month low of 2.354%, but after the publication of strong data, it jumped to 2.387%, which also supported the US currency. Bill Sarubbi, an expert with more than 50 years of experience in financial markets, said that, in June the dollar may reach new highs. His prediction is based on the theory of cycles. "After the April high, the weekly cycle turned down. Therefore, then, after breaking through the level of 98.2 points, the rally did not take place. Now the weekly "bearish" cycle ends, but the monthly cycle enters the negative phase. Weekly and monthly cycles will go against each other until the end of May. Probably, until June, the USD index will be in the range of 96.6-97.8. Cycles are synchronized in June. At the beginning of the first month of summer, the dollar correction is likely to follow, which will end between June 8 and 12. At this moment, a solid foundation will be formed. As a result, by the end of June, the USD index is expected to grow to 100 points, "said B. Sarubbi. The last time the dollar index touched this mark was in April 2017. The material has been provided by InstaForex Company - www.instaforex.com |
| Simplified wave analysis and forecast for EUR/USD and AUD/USD on May 17 Posted: 17 May 2019 01:57 AM PDT EUR/USD The last unfinished wave on the daily scale of the euro is descending, from March 20. The wave is flat, correctional. Its shape forms a descending pennant. The structure today looks formed, which indicates the possibility of its early completion. After a weekly decline, the price reached the upper limit of the strong support zone. Forecast: The extremes of the current wave of the daily TF chart formed the boundaries of the channel, in the lower edge of which the price rested. There is a high probability of the formation of a reversal in the flat and the beginning of the rise of the pair to the upper boundary of the price corridor. Recommendations: At the next trading sessions, a flat "sideways" in a narrow price corridor is expected on the euro chart. Trading in such conditions is quite unpredictable. Purchases are possible on the smallest TF lot. Given the current wave of the bearish vector, sales of the pair from the resistance zone will be more promising. Resistance zones: - 1.1240 / 1.1270 Support zones: - 1.1170 / 1.1140 AUD/USD The direction of the short-term trend of the Australian in the main pair is given by the downward wave of April 17. The wave has a pronounced impulse form. It is located at the end of a larger bearish trend that began in January, forming the final part (C). Forecast: A bullish reversal pattern was formed on the smallest TF of the pair. Within the last section of the wave, a short-term upward rollback is expected today. Return to the main vector of movement is possible by the end of the day. Recommendations: Purchase today is irrelevant due to their small potential. It is recommended to wait until the upcoming correctional section is completed and look for reversal signals to enter the instrument sales in the area of the calculated resistance zone. Resistance zones: - 0.6910 / 0.6940 Support zones: - 0.6830 / 0.6800 Explanations to the figures: Waves in the simplified wave analysis consist of 3 parts (A – B – C). The last unfinished wave is analyzed. Zones show areas with the highest probability of reversal. The arrows indicate the wave marking according to the method used by the author, the solid background is the formed structure, the dotted ones are the expected movements. Note: The wave algorithm does not take into account the duration of tool movements over time. The material has been provided by InstaForex Company - www.instaforex.com |
| Posted: 17 May 2019 01:57 AM PDT The US dollar continued to strengthen against the euro and a number of other world currencies on Thursday after the release of good fundamental statistics, indicating the growth of the economy. According to the data, the indicator for the construction of new homes in the US rose in April. The growth is directly related to the increase in the construction of single-family homes. The report of the Ministry of Commerce said that the number of bookmarks of new homes in April 2019 increased by 5.7% compared with the previous month and amounted to 1.235 million homes per year. There was also an increase in the number of construction permits, which increased by 0.6% compared to March to 1.296 million homes per year. Economists had expected a 5.4% increase in new home bookmarks. Data on the labor market, though weekly, but still pleased traders. The report of the US Department of Labor indicated that the number of initial claims for unemployment benefits for the week from May 5 to 11 was 212,000, while economists had expected that the number of applications would be 220,000. As for the number of secondary applications, it decreased by 28,000 to 1,660,000 in the week of April 28 to May 4. Production activity in the area of responsibility of the Philadelphia Fed grew in May, which is also a good sign for the economy. According to the data, the Fed's business activity index-Philadelphia rose in May 2019 to 16.6 points from 8.5 points in April. The main growth was due to the supply and employment index. The speech of the President of the Federal Reserve Bank of Minneapolis, Neel Kashkari, who does not have the right to vote on the board of the Fed, was ignored by the market. Kashkari said that monetary policy was too tight during the recovery of the US economy, so the Fed did not manage to achieve a symmetric level of inflation. In his opinion, the committee should consider lowering rates to further stimulate economic growth. As for the technical picture of the EURUSD pair, the direction at the end of the week will depend on the data on inflation in the eurozone, the output of which is expected today in the morning. To save the bearish impulse, a return to the support level of 1.1170 is required, which will push the trading instrument even lower to the area of 1.1150 and 1.1100 lows. Considering the bullish scenario, a return and consolidation above the resistance of 1.1190 is required, which will push the euro to the highs of 1.1210 and 1.1240. The material has been provided by InstaForex Company - www.instaforex.com |
| GBP/USD. May 17. Trading system "Regression Channels". Theresa May can leave her post until mid-June Posted: 17 May 2019 01:56 AM PDT 4-hour timeframe Technical data: The upper linear regression channel: direction – down. The lower linear regression channel: direction – down. The moving average (20; smoothed) – down. CCI: -115.5862 On Friday, May 17, the British pound continues its non-stop fall against the US currency. As we wrote yesterday, for the pound, this type of fall is the most dangerous since it can last for a long period of time. At this time, the pound does not even need any macroeconomic data to continue the fall. The pound is falling by inertia, simply because traders continue to get rid of it. Meanwhile, high-ranking officials of the British Parliament held a meeting with Theresa May, in which the resignation of the Prime Minister was again discussed. Theresa May has promised to agree on a date for the election of the country's new leader in the coming weeks but it seems that she still hopes to hold her "deal" with the EU through Parliament on the fourth attempt. And if it fails again, it will remain at the helm of the country. Frankly speaking, in this situation, there are more questions to the Parliament than to Theresa May. Parliament could dismiss May at least 2 times. There were as many as 8 possible options for the country's exit from the EU but they were all rejected by Parliamentarians. Thus, this situation shows the fragmentation of opinions in the government at such important times, the lack of unity and also the courage to change the Prime Minister, if the current Prime Minister is unable to complete the Brexit procedure. Nearest support levels: S1 – 1.2756 S2 – 1.2695 S3 – 1.2634 Nearest resistance levels: R1 – 1.2817 R2 – 1.2878 R3 – 1.2939 Trading recommendations: The pair GBP/USD continues its downward movement. Thus, short positions with targets at 1.2756 and 1.2695 are now relevant, before Heiken Ashi's indicator turns up, which will indicate a round of upward correction. Buy-positions are recommended to be considered only after fixing the pair above the moving average with the first targets at 1.3000 and 1.3062. However, at the moment, the bulls are extremely weak. In addition to the technical picture should also take into account the fundamental data and the time of their release. Explanation of illustrations: The upper linear regression channel – the blue line of the unidirectional movement. The lower linear regression channel – the purple line of the unidirectional movement. CCI – the blue line in the indicator regression window. The moving average (20; smoothed) is the blue line on the price chart. Murray levels – multi-colored horizontal stripes. Heiken Ashi is an indicator that colors bars in blue or purple. The material has been provided by InstaForex Company - www.instaforex.com |
| Posted: 17 May 2019 01:56 AM PDT 4-hour timeframe Technical data: The upper linear regression channel: direction – down. The lower linear regression channel: direction – sideways. The moving average (20; smoothed) – down. CCI: -127.3548 There were no important macroeconomic publications yesterday. However, the EUR/USD pair made another unsuccessful attempt to change the trend to an upward one, rebounded from the MA and immediately resumed its downward movement, but it could not gain a foothold below the Murray level of "-1/8" - 1.1169. Thus, the pair can start another round of correction and make another attempt to start an upward trend. Volatility on the pair remains weak, and there is no pronounced trend. The main newsmaker now remains Donald Trump. Its trade conflicts with China and the European Union attract the attention of market participants. However, at the same time, we cannot say that traders zealously work out information on these topics. Rather, these data are just interesting to market participants. Trump replaced anger at the mercy of the European automotive industry and postponed the possible introduction of duties on imports of products in this sector for 6 months. Nevertheless, it did not really help the euro Thus, we continue to insist that there is no fundamental background for the medium and long-term strengthening of the euro. This means that the euro can expect a maximum of small upward corrections, but the downward trend remains. Today, the European Union will publish an inflation report for April. The forecast is +1.7% y/y. Any value below this will help the dollar continue to rise in price. Nearest support levels: S1 – 1.1169 S2 – 1.1108 Nearest resistance levels: R1 – 1.1230 R2 – 1.1292 R3 – 1.1353 Trading recommendations: The EUR/USD currency pair resumed its downward movement and fulfilled the level of 1.1169. Thus, sell orders remain relevant to the target of 1.1108 if the pair manages to overcome the level of 1.1169. It is recommended to consider trading for an increase in the pair with extreme caution and small lots not earlier than fixing the price above the moving average line and the level of 1.1230 with the first goal of 1.1292. The intermediate target is 1.1260. In addition to the technical picture should also take into account the fundamental data and the time of their release. Explanation of illustrations: The upper linear regression channel – the blue line of the unidirectional movement. The lower linear regression channel – the purple line of the unidirectional movement. CCI – the blue line in the indicator window. The moving average (20; smoothed) is the blue line on the price chart. Murray levels – multi-colored horizontal stripes. Heiken Ashi is an indicator that colors bars in blue or purple. The material has been provided by InstaForex Company - www.instaforex.com |
| Posted: 17 May 2019 01:56 AM PDT No one seriously expected that Bitcoin without correction will get to 10000 USD, so the current decline is quite expected. To restart and resume growth, you need to stay in the area 7200 – 6800, which will lead to the return of new customers to the market. Signal to buy Bitcoin (BTC): Buyers are required to return and consolidate above 7200, that will necessarily lead to larger growth in the area of the resistance of 7600, where I recommend fixing the profits. Under a scenario of a further decline in Bitcoin, long positions are possible to return on the rebound from the low of 6800 and 6560. Signal to sell Bitcoin (BTC): Bears should wait for the recovery of Bitcoin in the resistance area of 7600 and sell from there, subject to the formation of a false breakdown. Sales immediately on the rebound will be more relevant in the area of the maximum of 8150. The main goal of sellers will be at least 6800, from which large buyers can declare themselves in the market. |
| Posted: 17 May 2019 01:56 AM PDT EUR/USD – 4H. As seen on the 4-hour chart, the EUR/USD pair made an attempt to grow to the Fibo level of 76.4%, which ended in failure half way to the designated target. The quotes of the pair returned to the retracement level of 100.0% (1.1177) and even completed the closure under it, however, this closure can be easily interpreted in the future as a rebound. In the coming hours, I recommend watching the pair. Yesterday, the news was again in favor of the US dollar, the construction segment showed very good dynamics in April, the number of applications for unemployment benefits also turned out to be less than expected. Today, it's not a fact that the US currency will receive additional support due to the news, although several important reports will be published today (inflation in the EU and US consumer confidence index). In any case, the three previous attempts to close below the Fibo level of 100.0% failed. It is possible and the fourth rebound from this level of retracement. As a result, the rebound will lead to a new attempt to reach the Fibo level of 76.4% (1.1241), and closing of the pair below the Fibo level of 100.0% will significantly increase the chances of continuing falling towards the next retracement level of 127.2% (1.1102). There are no emerging divergences on the current chart on May 17th. The Fibo grid was built on extremums from March 7, 2019, and March 20, 2019. Forecast for EUR/USD and trading recommendations: The EUR/USD pair remains, in my opinion, in the movement within the side corridor between the levels of 76.4% and 100.0%. Thus, the next rebound from the Fibo level of 100.0% will allow buying a pair with the target of 1.1241. This is the nearest goal, but as yesterday's trading showed, it is also quite difficult to achieve in the current conditions. At the same time, the closing below the level of 1.1177 will allow selling the pair with the target at 1.1102. GBP/USD – 4H. As seen on the 4-hour chart, the GBP/USD pair continues to fall in the direction of the retracement level of 38.2% (1.2765). The rebound of the pair from this level will allow traders to expect a reversal in favor of the British currency and some growth in the direction of the retracement level of 50.0% (1.2867). On May 17, a bullish divergence in the CCI indicator is brewing, the formation of which may coincide with the rebound from the Fibo level of 38.2%. In recent days, the pound has been falling non-stop, which indicates the strength of the "bearish mood". Thus, even if the rebound and divergence, without strong news, there is no need to count on a large pullback of the pound to the top. The Fibo grid was built on extremums from September 20, 2018, and January 3, 2019. GBP / USD – 1H. As seen on the hourly chart, the pair GBP/USD shows the hopeless position of the pound even better. The fall of the English currency is recoilless. At the moment, the quotes of the pair have come up against the retracement level of 127.2% (1.2782). There is also a bullish divergence in the CCI indicator. Thus, as in the 4-hour chart, the pair shows all the signs of a desire to start growth. Nevertheless, I once again warn you that with such a trend strength, a pullback up may be minimal. The pair closed below the Fibo level of 127.2% will increase the chances of a further fall in the direction of the next retracement level of 161.8% (1.2673). In the UK, they want to dismiss Premier Theresa May again. Both her party members and the opposition support this option. May's support among the population has declined significantly in recent years, which was well seen in the local elections. However, May still stands his ground and is not ready to resign before the Parliament accepts the Brexit deal. The Fibo grid was built according to extremums from April 25, 2019, and May 3, 2019. Forecast for GBP/USD and trading recommendations: The GBP/USD pair on two charts have performed a fall to important Fibo levels and two divergences are brewing at once. Thus, the rebound from these levels will allow you to buy a pair with a target of 1.2865 and a stop loss order below the Fibo level of 127.2% (hourly chart). But I recommend cautious purchases or do without them, as the current fall is very strong. Closing the quotes below the Fibo level of 127.2% will make it possible to sell the pair with a target of 1.2673 and a stop loss order above the level of 127.2%. The material has been provided by InstaForex Company - www.instaforex.com |
| Posted: 17 May 2019 01:46 AM PDT EUR / USD On Thursday, May 16, trading ended for EUR / USD by 30 bp lower. New sales of the tool are fully consistent with the current wave marking, involving the construction of a downward wave of 3, 3, 3 with targets under the 11 figure. The US dollar grew yesterday on all fronts with the basis of fairly strong reports on the construction of new residential buildings and the number of building permits. However, one should not compare the fall of the euro with the fall of the pound. Eurocurrency decline is absolutely calm, without having to feel the panic. Today, inflation in the European Union can provide new food for thought for the markets. The rate is expected to be 1.7% y / y. I believe that even exceeding the forecast will not cause strong purchases for the European currency. The theme of the trade war between the EU and America temporarily faded into the background. Sales targets: 1.1097 - 161.8% Fibonacci 1.1045 - 200.0% Fibonacci Purchase goals: 1.1324 - 0.0% Fibonacci General conclusions and trading recommendations: The pair is still in the process of building a downward trend. The current wave counting suggests a continuation of the pair decline with the targets of 1.1097 and 1.1045, which corresponds to 161.8% and 200.0% Fibonacci. Thus, I recommend selling a tool with these goals and a restrictive order above the 50.0% Fibonacci level. GBP / USD On May 16, the GBP / USD pair lost another 45 basis points. The pound sterling, therefore, remains in absolute outsiders. There is absolutely no reason to oppose the US currency with the pound. Britain is not happy with the current situation. Yesterday, Theresa May's possible resignation was discussed, or more precisely, until the middle of next month. The ratings of the leader of the UK are plummeting, confidence is diminishing every day. Former Foreign Minister Boris Johnson has already outlined his plans to become the next leader of the Conservative Party. Thus, the chair under Theresa May is swinging harder, but she does not want to retire all by herself. Moreover, what seems to be the problem is how Brexit will help her resignation and the arrival. For example, how about Johnson? After all, the EU flatly refused to revise the current version of the Brexit agreement. Respectively, Johnson will also have to negotiate with Labor and Parliament, as it is with May. This news background contributes to a further decrease in the pound and the construction of a wave. Sales targets: 1.2780 - 127.2% Fibonacci 1.2675 - 161.8% Fibonacci Purchase goals: 1.3175 - 0.0% Fibonacci General conclusions and trading recommendations: The wave pattern implies a continuation of the instrument decline within the wave c. Thus, now, I recommend sales with targets located near the estimated marks of 1.2780 and 1.2675, which corresponds to 127.2% and 161.8% Fibonacci. An unsuccessful attempt at any of these marks can lead to a departure of quotes from the reached minimums and even the construction of a sufficiently strong upward wave. The material has been provided by InstaForex Company - www.instaforex.com |


| You are subscribed to email updates from Forex analysis review. To stop receiving these emails, you may unsubscribe now. | Email delivery powered by Google |
| Google, 1600 Amphitheatre Parkway, Mountain View, CA 94043, United States | |
No comments:
Post a Comment