
Forex analysis review |
- Fractal analysis of major currency pairs for May 20
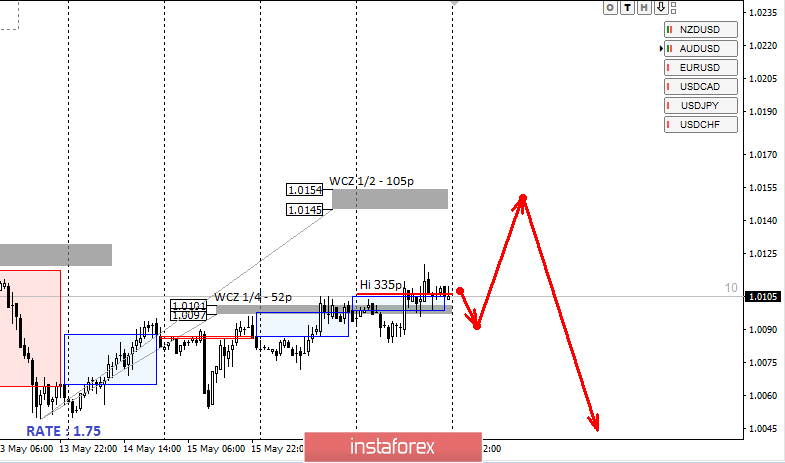
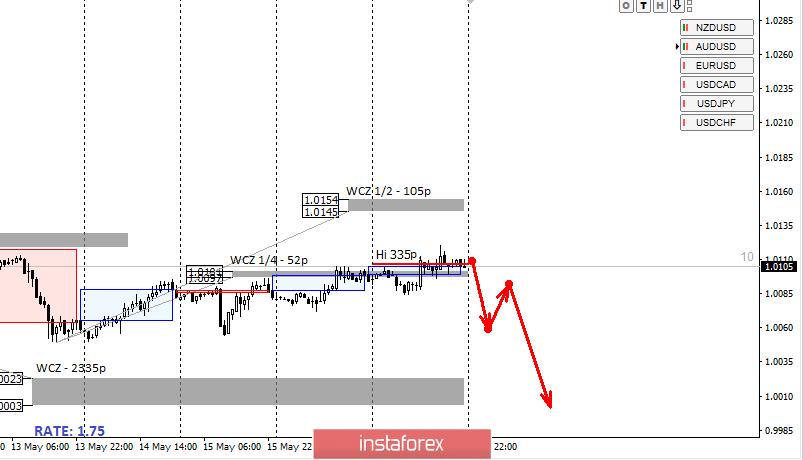
- Control zones USDCHF 05/20/19
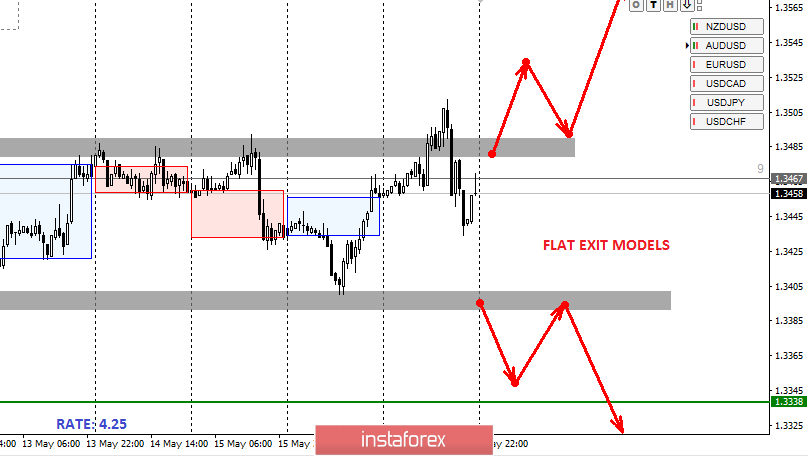
- Control zones USDCAD 05/20/19
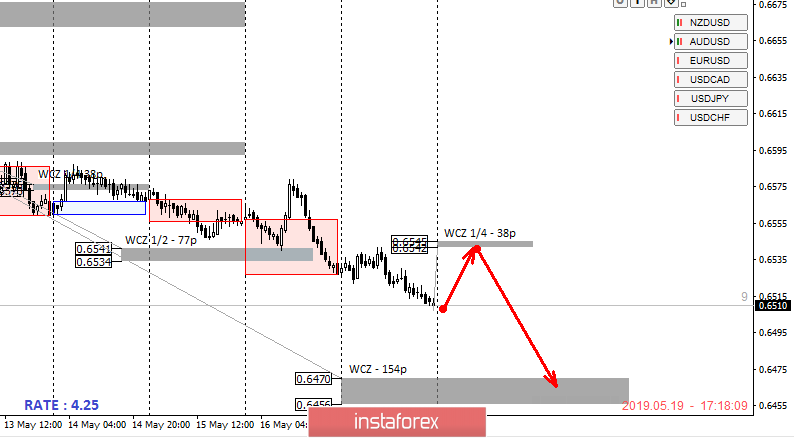
- Control zones NZDUSD 05/20/19
- GBP/USD: May's resignation and the "shadow of Boris"
| Fractal analysis of major currency pairs for May 20 Posted: 19 May 2019 06:19 PM PDT Forecast for May 20: Analytical review of H1-scale currency pairs: For the euro / dollar pair, the key levels on the H1 scale are: 1.1222, 1.1212, 1.1197, 1.1184, 1.1156, 1.1144 and 1.1112. Here, we continue to follow the development of the downward structure of May 13. Short-term downward movement is expected in the range of 1.1156 - 1.1144. The breakdown of the last value should be accompanied by a pronounced downward movement. In this case, the potential target is 1.1112. We expect a rollback to the top from this level. Short-term ascending movement is possible in the range of 1.1184 - 1.1197. The breakdown of the latter value will lead to a prolonged correction. Here, the goal is 1.1212. The range of 1.1212 - 1.1222 is a key support for the downward movement. The main trend is the downward structure of May 13. Trading recommendations: Buy 1.1184 Take profit: 1.1195 Buy 1.1198 Take profit: 1.1210 Sell: 1.1156 Take profit: 1.1145 Sell: 1.1142 Take profit: 1.1116 For the pound / dollar pair, the key levels on the H1 scale are: 1.2840, 1.2802, 1.2773, 1.2733, 1.2693, 1.2659 and 1.2588. Here, we continue to follow the development of the downward structure of May 3. For the continuation of the movement to the bottom, we expect the level of 1.2733 after the breakdown. In this case, the target is 1.2693. The consolidation is in the corridor of 1.2693 - 1.2659. The breakdown of the level 1.2659 will lead to the movement to the potential target - 1.2588. And upon reaching which, we expect a rollback to the top. Short-term upward movement is possible in the corridor of 1.2773 - 1.2802. The breakdown of the latter value will lead to a prolonged correction. Here, the target is 1.2840. This level is a key support for the downward structure. The main trend is the downward cycle of May 3. Trading recommendations: Buy: 1.2773 Take profit: 1.2802 Buy: 1.2804 Take profit: 1.2840 Sell: 1.2732 Take profit: 1.2694 Sell: 1.2656 Take profit: 1.2590 For the dollar / franc pair, the key levels on the H1 scale are: 1.0160, 1.0142, 1.0131, 1.0113, 1.0084, 1.0072 and 1.0048. Here, we are following the formation of the ascending structure of May 13. The continuation of the movement to the top is expected after the breakdown at the level of 1.0113. In this case, the target is 1.0131. A short-term upward movement is in the corridor 1.0131 - 1.0142, as well as consolidation. For the potential value to the top, we consider the level of 1.0160. After reaching which, we expect a rollback to the bottom. Short-term downward movement is possible in the corridor of 1.0084 - 1.0072. The breakdown of the latter value will be made for the development of the downward structure. Here, the potential target is 1.0048. Up to this level, we expect the initial conditions for the downward cycle. The main trend is the ascending structure of May 13. Trading recommendations: Buy : 1.0113 Take profit: 1.0130 Buy : 1.0142 Take profit: 1.0160 Sell: 1.0084 Take profit: 1.0073 Sell: 1.0070 Take profit: 1.0050 For the dollar / yen pair, the key levels on the scale are : 111.31, 110.98, 110.81, 110.54, 110.33, 109.96, 109.77 and 109.47. Here, we are following the development of the ascending cycle of May 13. Short-term upward movement is possible in the corridor of 110.33 - 110.54. The breakdown of the latter value should be accompanied by a pronounced upward movement. Here, the target is 110.81. Price consolidation is in the corridor of 110.81 - 110.98. For the potential value to the top, we consider the level of 111.31. The movement to which is expected after the breakdown at the level of 111.00. Short-term downward movement is possible in the corridor of 109.96 - 109.77. The breakdown of the latter value will lead to in-depth correction. Here, the goal is 109.47. This level is a key support for the upward structure. The main trend: the rising structure of May 13. Trading recommendations: Buy: 110.33 Take profit: 110.52 Buy: 110.56 Take profit: 110.80 Sell: 109.96 Take profit: 109.78 Sell: 109.75 Take profit: 109.50 For the Canadian dollar / US dollar pair, the key levels on the H1 scale are: 1.3568, 1.3526, 1.3511, 1.3493, 1.3451, 1.3434, 1.3415 and 1.3378. Here, we are following the formation of the ascending structure of May 10. At the moment, the price is still in the zone of initial conditions. Continuation of the movement to the top is expected after the breakdown of 1.3493. In this case, the target is 1.3511. Consolidation is near this level. The price pass of the noise range 1.3511 - 1.3526 should be accompanied by a pronounced upward movement to the potential target - 1.3568. From this level, we expect a rollback to the bottom. Consolidated movement is possible in the corridor of 1.3451 - 1.3434. The breakdown of the last value will lead to a prolonged correction. Here, the target is 1.3415. This level is a key support for the top. The main trend is the formation of the ascending structure of May 10, the stage of initial conditions. Trading recommendations: Buy: 1.3493 Take profit: 1.3510 Buy : 1.3526 Take profit: 1.3566 Sell: 1.3433 Take profit: 1.3417 Sell: 1.3412 Take profit: 1.3385 For the pair Australian dollar / US dollar, the key levels on the H1 scale are : 0.6936, 0.6916, 0.6900, 0.6869, 0.6854 and 0.6835. Here, we are following the development of the downward structure of May 7. At the moment, the price is in the correction zone. Short-term downward movement is expected in the range of 0.6869 - 0.6854. Hence, there is a high probability of a turn into a correction. For the potential value of the downward trend, we consider the level of 0.6835, and the movement to which is expected after the breakdown of 0.6852. Short-term upward movement is possible in the range of 0.6900 - 0.6916. The breakdown of the latter value will lead to a prolonged movement. Here, the goal is 0.6936. This level is a key support for the downward structure. The main trend is the downward structure of May 7, the stage of correction. Trading recommendations: Buy: 0.6900 Take profit: 0.6914 Buy: 0.6917 Take profit: 0.6934 Sell : 0.6867 Take profit : 0.6855 Sell: 0.6852 Take profit: 0.6836 For the euro / yen pair, the key levels on the H1 scale are: 123.59, 123.17, 122.95, 122.50, 122.12, 121.75, 121.45 and 121.09. Here, we follow the formation of the local structure for the bottom of May 10. Continuation of the movement to the bottom is expected after the breakdown of the level of 122.50. In this case, the first target is 122.12. The breakdown of which will start the development of the downward trend on the H1 scale. Here, the target is 121.75. Short-term downward movement is in the corridor of 121.75 - 121.45, as well as consolidation. Also from this range, there is a high probability of rollback in the correction. For the potential value at the bottom, we consider the level of 121.09. After reaching which, we expect a rollback to the top. Short-term ascending movement is expected in the corridor of 122.95 - 123.17. The breakdown of the last value will be made for the formation of the ascending structure. Here, the goal is 123.59. The main trend is the local downward structure of May 10. Trading recommendations: Buy: 122.95 Take profit: 123.15 Buy: 123.20 Take profit: 123.55 Sell: 122.50 Take profit: 122.14 Sell: 122.10 Take profit: 121.75 For the pound / yen pair, the key levels on the H1 scale are : 141.05, 140.45, 140.09, 139.68, 139.15, 138.45 and 138.03. Here, we are following the development of the downward structure of May 10. Continuation of the movement to the bottom is expected after the breakdown of 139.65 In this case, the goal is 139.15. The consolidation is near this level. The breakout of the level of 139.15 will lead to a pronounced movement to the level of 138.45. From this level, there is a high probability of a turn to the top. The potential value for the bottom is considered the level of 138.03. Upon reaching which, we expect consolidation in the corridor of 138.45 - 138.03, as well as a rollback to the top. Short-term upward movement is possible in the corridor of 140.09 - 140.45. The breakdown of the latter value will lead to a deep correction. Here, the target is 141.05. This level is a key support. The main trend is the local downward structure of May 10. Trading recommendations: Buy: 140.10 Take profit: 140.45 Buy: 140.47 Take profit: 141.05 Sell: 139.66 Take profit: 139.15 Sell: 139.10 Take profit: 138.45 The material has been provided by InstaForex Company - www.instaforex.com |
| Posted: 19 May 2019 04:05 PM PDT The pair's downward movement is still a medium-term impulse. As long as the pair is trading below the WCZ 1/2 1.0154-1.0145, any upward movement will fit into the correction frame. The higher the price growth, the more favorable prices can be obtained for selling the tool. The first goal of the fall is the weekly short-term low of 1.0024-1.0004, the test of which will determine further priority for the next month. Upward movements of the last four days fit into the frame of the fall, which occurred on May 3. This indicates the corrective nature of the upward movement and suggests the need to search for a pattern to sell. An alternative model will be a fall from current levels without growth to the WCZ 1/2. In this case, you need to enter on the "false breakdown" pattern, which must be formed during the European session on Monday. Strengthening the Swiss franc from current levels will provide a favorable risk-to-profit ratio for a short position. Daily CZ - daily control zone. The area formed by important data from the futures market, which change several times a year. Weekly CZ - weekly control zone. The zone formed by important marks of the futures market, which change several times a year. Monthly CZ - monthly control zone. The zone, which is a reflection of the average volatility over the past year. The material has been provided by InstaForex Company - www.instaforex.com |
| Posted: 19 May 2019 04:04 PM PDT The formation of a medium-term flat continued last week. The upper limit formed by the WCZ 1/2 1.3490-1.3479 again acted as resistance and trade closed below it. While the pair is trading within the accumulation zone, the main deals should be made after the test of the range limits. The targets are the opposite border. Consolidation on the boundaries of the flat is required. Partial transfer to breakeven is possible, but it should be understood that the way out of the flat will be swift and there might be no re-entry In order to change the trading principle on the trend, it will be necessary to close the US session either above the previous week's high or below the low of three weeks ago. Until this happens, it is better to continue trading within the framework of the flat, since partial consolidations will allow taking profit over the entire range, which can last for several months. Daily CZ - daily control zone. The area formed by important data from the futures market, which change several times a year. Weekly CZ - weekly control zone. The zone formed by important marks of the futures market, which change several times a year. Monthly CZ - monthly control zone. The zone, which is a reflection of the average volatility over the past year. The material has been provided by InstaForex Company - www.instaforex.com |
| Posted: 19 May 2019 03:58 PM PDT The downward movement is a medium-term impulse, so selling is still a priority. It is not profitable to sell on Monday from current grades, since the target of the fall is the weekly CZ of 0.6470-0.6456. Any growth should be used as an opportunity to sell the pair. The first resistance will be WCZ 1/4 06545-0.6542. The downward trend is so strong that it will be possible to look for opportunities for buying only if a daily absorption takes place and the US session closes above Friday's maximum. This model will be the starting point in the formation of a deep correctional model, the next goal of which will be WCZ 1/2 0.6584-0.6577. While the pair will be trading below the specified zone, the bearish trend will not turn. Daily CZ - daily control zone. The area formed by important data from the futures market, which change several times a year. Weekly CZ - weekly control zone. The zone formed by important marks of the futures market, which change several times a year. Monthly CZ - monthly control zone. The zone, which is a reflection of the average volatility over the past year. The material has been provided by InstaForex Company - www.instaforex.com |
| GBP/USD: May's resignation and the "shadow of Boris" Posted: 19 May 2019 03:20 PM PDT The pound paired with the dollar ended the trading week at five-month lows, that is, at around 1.2713. Taking into account the dynamics of the downward movement, the bears could easily renew the annual low, but they were forced to suspend their triumphal two-week procession due to the onset of the weekend. However, on Monday, the downward impulse of GBP/USD can get its continuation, since almost all the fundamental factors play against the British currency. "The shadow of Boris Johnson" again loomed on Britain's political horizon, and this fact weighed down the British currency throughout the market. However, first things first. Last week, it finally became clear that negotiations between Labour and Theresa May's government have failed. Although this has been mentioned before (mainly at the level of rumors), it was officially announced on Friday. Political opponents removed the masks of friendliness and again voiced a barrage of criticism, accusing each other of sabotaging the negotiation process and lobbying for anti-state ideas. It is worth noting that many experts (or rather, the majority) were initially quite skeptical over the negotiations between Laborites and Theresa May. After all, May sat at the negotiating table with political opponents, in fact, forced - only to justify the need for further delaying Brexit. But while these negotiations were going on, GBP/USD traders had at least some foothold in this regard, especially against the background of rumors about reaching a certain compromise. Therefore, despite the multi-week silence of the parties, the pound-dollar pair either did not fall below 1.3000, or very quickly returned from the area of 28-29 figures. But as soon as the negotiators put an end to possible cooperation, the pair rolled down - and will continue to roll, to the low of 1.2450, until the market sees "the light at the end of the tunnel" regarding the prospects of the "divorce process" with the EU. To date, these prospects look too vague. Theresa May once again drove herself into a corner: on the one hand, she announced a vote for the draft deal, but on the other hand, she lost potential allies (Labour) and did not meet the Conservatives who demanded new negotiations with the EU. As a result, the current situation is almost the same as it was back in January or December, when May submitted the deal to a vote without having made sure that the required number of votes was available. "Slamming the door" in front of the Laborites, Teresa May was left alone with the Conservatives, who, first of all, were not eager to support her draft deal, and secondly, they did not have their own majority — the support of unionists is necessary for a positive vote. In other words, Theresa May is in full swing to another failed vote (the fourth in a row), after which her tenure as prime minister will become politically meaningless. According to the British press, May nevertheless agreed to resign before the beginning of the Parliamentary recess (which starts in July), but after voting for the deal (to be held from June 3 to 9). According to journalists, this ended the Tory negotiations at a closed meeting of the "1922 Committee". Moreover, insider sources claim that May's resignation will still happen regardless of the vote's results. In other words, the issue regarding the current prime minister's resignation is considered by many to be already resolved, and now Brexit prospects depend on who will stand at the helm of Britain after May. The press has already named the possible successors to May - these are Jeremy Hunt (the current foreign minister), Michael Gove (the environment minister) and David Lidington (the head of the government's secretariat). All of them have a rather soft position in the context of further relations with Brussels, so their appointment will be positively perceived by the British currency. But a possible victory for Boris Johnson, who is also a favorite of the political race, will be an unpleasant surprise for GBP/USD traders. He is the most zealous and consistent supporter of a hard Brexit, and is also May's opponent at the same time. This is the most undesirable candidate for supporters of maintaining close business contacts with the European Union, so his arrival will have a strong downward pressure on the pound. Here it is worth noting that, according to a YouGov study conducted for The Times, Boris Johnson is seen by 39% of the members of the Conservative Party as the new head of the British government. The former head of the British Foreign Ministry is 13% ahead of the former minister of exit of Britain from the EU, Dominic Raab. Thus, the pound is now not only under the pressure of weak prospects for the June vote, but also under the mercy of further prospects for the "divorce process." Many politicians and financial analysts associate Johnson's arrival with a hard Brexit - and until he himself denies this "logical" relationship, the sterling will continue to fall in price: the nearest, strongest, support level of GBP/USD is only around 1.2450 Bollinger Bands indicator on the monthly chart). The material has been provided by InstaForex Company - www.instaforex.com |


| You are subscribed to email updates from Forex analysis review. To stop receiving these emails, you may unsubscribe now. | Email delivery powered by Google |
| Google, 1600 Amphitheatre Parkway, Mountain View, CA 94043, United States | |
No comments:
Post a Comment