Forex analysis review |
- Forecast for AUD/USD on April 24, 2020
- Forecast for USD/JPY on April 24, 2020
- NZDUSD reacted right below descending trendline resistance. Further drop to come!
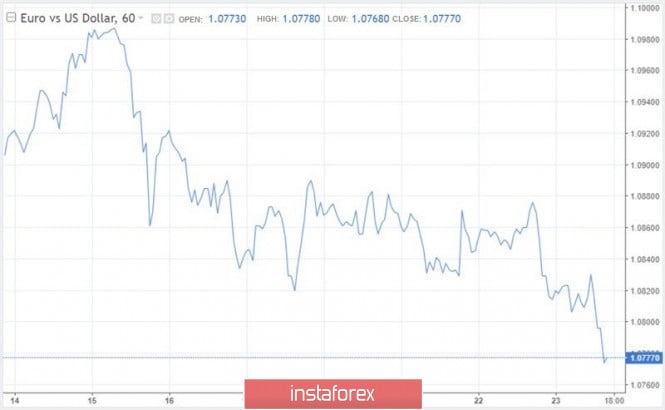
- Overview of the EUR/USD pair. April 24. The EU summit ended in nothing. The EU member states did not agree on the 2-trillion
- EURUSD: Bearish pressure increases as price breaks 1.08
- Gold price provides nice shorting opportunity
- EUR/USD. Crashing PMIs and bears' failed triumph
- EUR/USD and GBP/USD. Results of April 23. US unemployment continues to rise. Dollar under under slight pressure, but continues
- Comprehensive analysis of movement options for #USDX vs EUR/GBP, GBP/JPY, and EUR/JPY (H4) on April 24, 2020
- April 23, 2020 : EUR/USD Intraday technical analysis and trade recommendations.
- April 23, 2020 : GBP/USD Intraday technical analysis and trade recommendations.
- EURUSD: Continued decline in the Eurozone economic activity
- Evening review for April 23, 2020. EURUSD. US unemployment rate
- GBP/USD: plan for the US session on April 23. The pound stubbornly does not want to go down, but the strength of the bulls
- BTC analysis for 04.23.2020 - Major multi-pivot resistance level at the price of $7.200 is on the test, watch for potential
- EUR/USD: plan for the US session on April 23. The euro collapsed after a record decline in economic activity
- Analysis for Gold 04.23.2020 - Strong upside momentum and Gold is heading towards ourr main upward target at $1.737
- EUR/USD analysis for 04.23.2020 - Fake breakout of the 20-day low at 1.0770 ? Watch for potential buying opportuntiies...
- Trading plan for GBP/USD for April 21, 2020
- Trading plan for Gold for April 23, 2020
- Trading recommendations on GBP/USD for April 23, 2020
- Trading plan for EUR/USD for April 23, 2020
- Technical analysis of GBP/USD for April 23, 2020
- EUR/USD: dollar remains first while the euro is nervous
- Gold to reach $3,000 per ounce
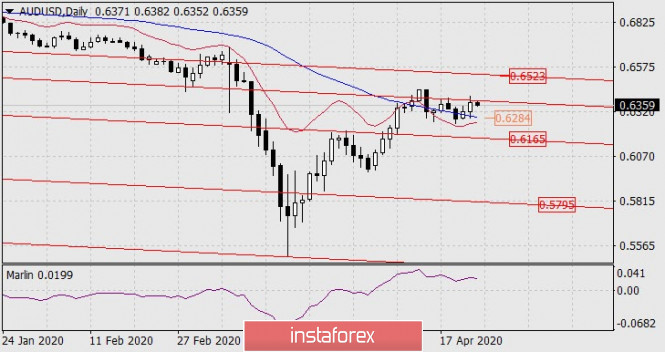
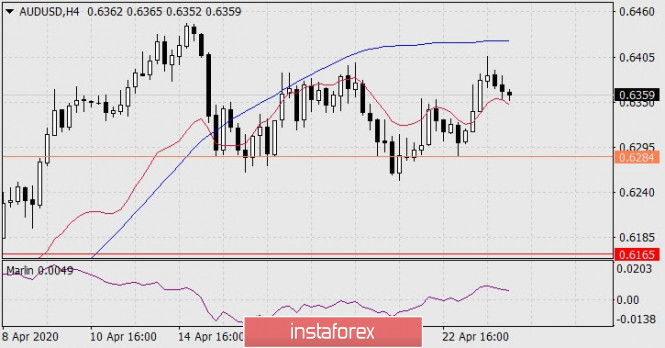
| Forecast for AUD/USD on April 24, 2020 Posted: 23 Apr 2020 07:51 PM PDT AUD/USD The Australian dollar grew by 48 points on Thursday, with the upper shadow of the daily candle leaving the area above the resistance of the embedded line of the price channel. It opened under this line today, and if the price does not go above yesterday's high, then the price could go below the MACD line (0.6284) in the near future and the aussie will face a medium-term drop. The immediate goal on this path is the price channel line in the area of 0.6165. The price exit above yesterday's high opens a bullish target of 0.6523. The price is between the balance and MACD indicator lines on the H4 chart. The MACD line is turning down, which could indicate a reversal in the price trend itself. The Marlin oscillator is in the positive zone, but it is decreasing and near the trend border. So, the MACD line of the daily scale at the price of 0.6284 becomes a signal level for opening sales, this is also yesterday's low. Stop loss is just above 0.6355. The material has been provided by InstaForex Company - www.instaforex.com |
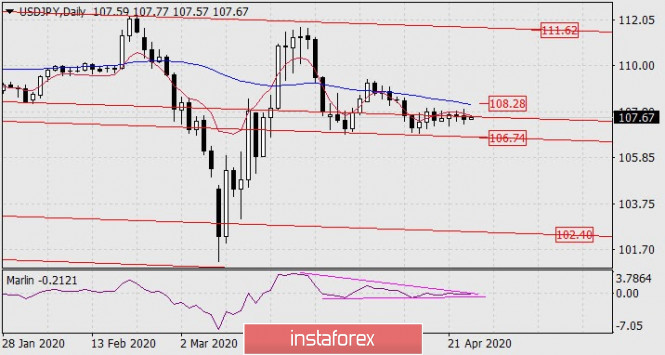
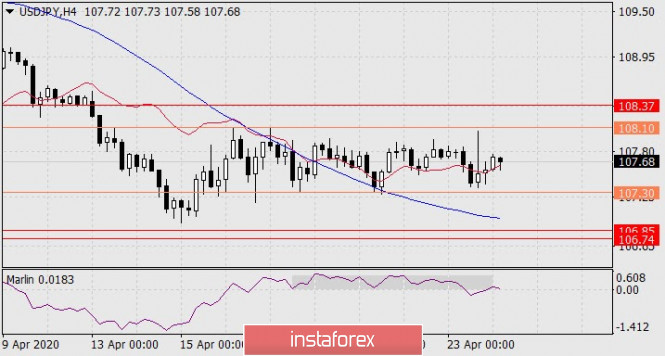
| Forecast for USD/JPY on April 24, 2020 Posted: 23 Apr 2020 07:51 PM PDT USD/JPY The price showed the most volatility in the last five days, although the pair ended the session with a loss of only 15 points. But this decline was enough for technical indicators to slightly turn down on the daily chart, and the price would go below the price channel line, on which it had been trading all week. The signal line of the Marlin oscillator is still within the boundaries of the wedge-shaped model, but its current value is negative, which indicates a more likely breakthrough of the indicator and price down. After the expected breakout, the price should overcome the nearest support along the price channel and then a direct road will open to the downward trend line with a target of 102.40. The price is moving sideways on the four-hour chart, in the uncertainty range of 107.30-108.10. The first sign of an impulsive downward movement in the near future, perhaps today, is when the Marlin signal line leaves from its own range down, and into the zone of negative values. The first signal to open short positions will be the price moving below the signal level 107.30, the main trade will start below 106.74. The material has been provided by InstaForex Company - www.instaforex.com |
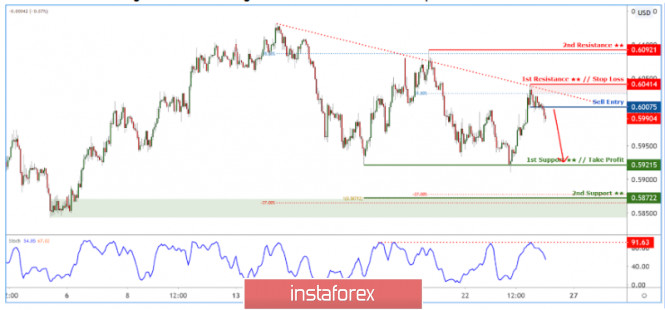
| NZDUSD reacted right below descending trendline resistance. Further drop to come! Posted: 23 Apr 2020 07:01 PM PDT
Trading Recommendation Entry: 0.60075 Reason for Entry: Graphical overlap Take Profit : 0.59215 Reason for Take Profit: Graphical swing low Stop Loss: 0.60414 Reason for Stop loss: Graphical swing high, descending trendline resistance The material has been provided by InstaForex Company - www.instaforex.com |
| Posted: 23 Apr 2020 06:55 PM PDT 4-hour timeframe
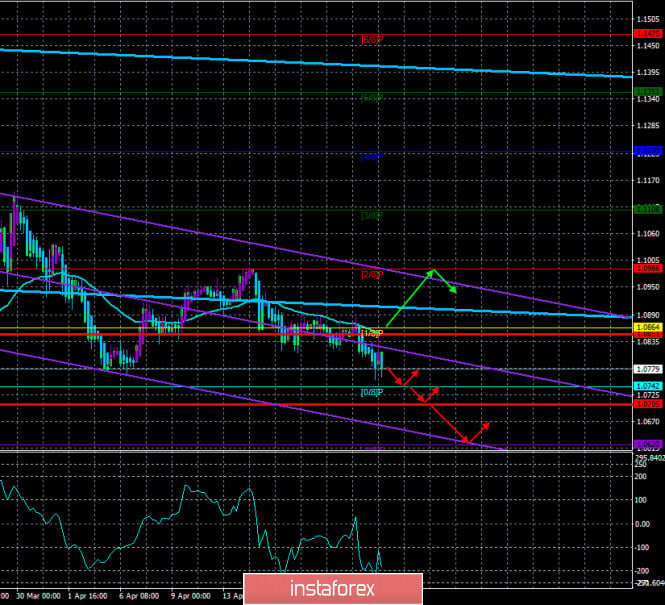
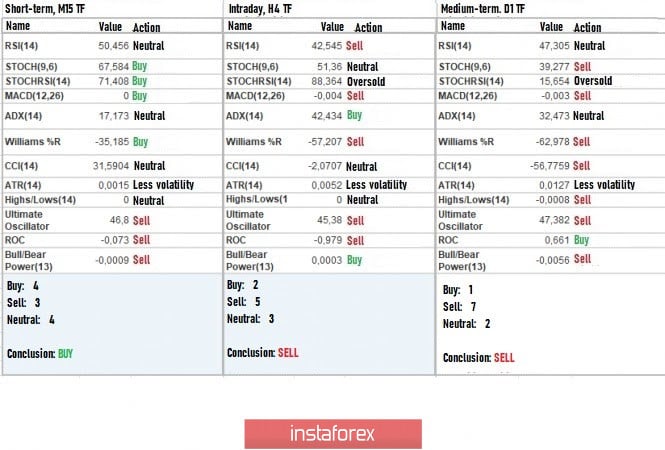
Technical details: Higher linear regression channel: direction - downward. Lower linear regression channel: direction - downward. Moving average (20; smoothed) - downward. CCI: -155.6859 The EUR/USD currency pair starts a new trading day with a continuation of the downward movement. Yesterday, April 23, the euro/dollar pair adjusted to the moving average line, but, quite predictably, failed to gain a foothold above it. Thus, at the moment, the downward trend persists and is supported by two linear regression channels and a downward moving average line. Thus, at the moment, all trend indicators in the "linear regression channels" system signal a move to the south. Therefore, now we can conclude that the period of consolidation of the pair after several corrections against each other is over and may well begin to form a new downward trend. Questions about the current movement remain basically the same. And what are the reasons now for the US dollar to become more expensive? Is the situation in America better than in Europe? The epidemic has affected the United States less than the EU? The US is handling the epidemic better than the Alliance? The consequences for the American economy will be milder than for the European one? No. So, what is the basis for the dollar's growth? As before, on the sole belief of traders and investors that anything can happen in the world but the US dollar will be unshakable. Unfortunately, this is the most powerful factor right now. All macroeconomic statistics and fundamental news continue to be ignored by market participants. Meanwhile, the European Union held a summit in a video format, where 27 EU member states had to decide the fate of a 2 trillion package of aid to the European economy and the countries most affected by the pandemic. Recall that the main proposal of the European Council is to start issuing bonds on behalf of the entire European Union, which are now called all "coronabonds". This idea is opposed by the "Northern" countries - Estonia, Finland, the Netherlands, Germany, and Austria. Today, German Chancellor Angela Merkel said that during the video conference, the issue of issuing "coronabonds" may be discussed, but she believes that Europe needs more flexible tools. "Some demand that, in the face of a severe crisis, we approve common debt obligations with shared responsibility. This issue will obviously be put on the agenda in a video conference of the European Council," Merkel said. "For a limited period, we must make significantly higher contributions to the European budget," Merkel also said, indicating that Germany is ready to pay the EU more than it is now, just to avoid participating in the issuance of common European bonds. A little later, information began to arrive about the results of the summit. Here, too, there were few surprises. It is reported that the EU leaders failed to agree on the creation of a fund to help the European economy in the amount of 2 trillion euros. The parties did not agree on the sources of raising funds and the exact amount needed to restore the EU economy. It is also still unclear on what terms funds will be provided to the most affected countries. On the terms of preferential loans or gratuitous assistance? Recall that the countries that opposed the "coronabonds", just think that the poor countries had to accumulate more funds for the creation of "safety cushion" during good times. Thus, in general, the results are as follows. EU countries approve the creation of a fund for economic recovery from the coronavirus pandemic. But the sources of funding for this fund and its size will be discussed later. The European Commission is charged with developing and proposing a new budget and ways to finance it. This is very bad news for the EU and the euro currency. And we believe that today the European currency may continue to devalue against the dollar due to the failure in the negotiations. After all, it should be understood that this is not just an ordinary aid package, but an aid package that should save the European economy. Roughly speaking, the more the economy falls now, the longer it will take to recover. And 2 trillion euros will be used to soften its fall. Therefore, they are vital. In Italy, by the way, they do not particularly believe that the EU government will provide effective assistance in the fight against the "coronavirus". Among the Italians polled, only 30% believe that the EU will provide assistance. According to the same poll, more than 42% of citizens support the idea of leaving the EU. Recall that Italy is now the headache of the entire European Union. It is Italy that has the largest public debt, exceeding EU norms by 2.5 times. It was Italy that suffered the most from the "coronavirus" and therefore requires the most help. In addition to the news from the EU summit, there will be several macroeconomic publications today. The least interesting ones will come from the European Union. It is unlikely that in the current conditions, traders will be seriously interested in data on business optimism or economic expectations in Germany. Thus, the hopes of euro traders will only be associated with the report on orders for durable goods in the United States, which, according to experts' forecasts, promises to come out as disastrous as a business activity a day earlier. Recall that this indicator has three derivatives. The total number of orders is expected to decrease by 12% compared to February. The indicator of orders excluding transport – with a decrease of 6%. The indicator excluding defense orders – with a decrease of 8.6%. The indicator excluding defense and aviation – with a reduction of 6%. Over the past 10 years, only once did these indicators show a similar drop, in 2014. Thus, this report, which is quite important for the US economy, may put pressure on the dollar. What do we have in the end? The downward trend for the euro/dollar pair remains. On the last trading day of the week, traders can lock in part of the profit on open positions. Moreover, such a decision will clearly be favored by statistics from overseas. At the same time, the US currency remains the general trust of traders in times of crisis, while the euro currency does not have such trust. Moreover, now we see that the United States easily accepts multi-trillion-dollar aid packages for the economy, and in the EU there are problems with this, since the EU is not a single state, taking into account the views of its 27 members. Therefore, in the current reality, we are inclined to believe that the euro will continue to fall in price.
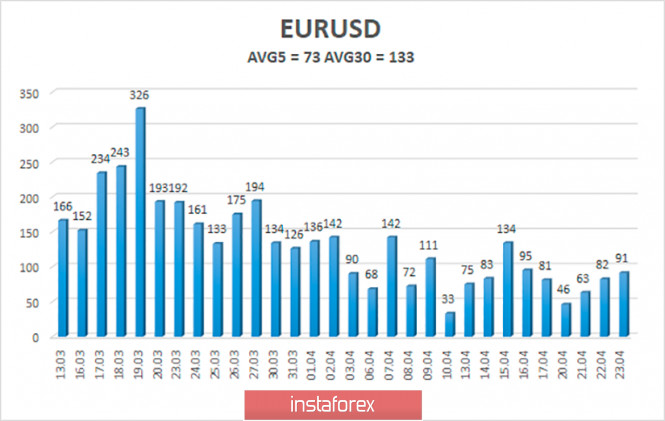
The volatility of the euro/dollar currency pair as of April 23 is 73 points. Thus, this indicator does not give reason to expect a new wave of panic. 74 points per day is the average strength of volatility. Today, we expect the pair's quotes to move between the levels of 1.0705 and 1.0851. A reversal of the Heiken Ashi indicator upward may signal a new round of upward correction. Nearest support levels: S1 - 1.0742 S2 - 1.0620 S3 - 1.0498 Nearest resistance levels: R1 - 1.0864 R2 - 1.0986 R3 - 1.1108 Trading recommendations: The EUR/USD pair continues its downward trend. Thus, traders are now recommended to trade down again with targets of 1.0742 and 1.0705. It is recommended to consider buying the euro/dollar pair not before fixing the price above the moving average line with the first goal of the Murray level of "2/8"-1.0986. The material has been provided by InstaForex Company - www.instaforex.com |
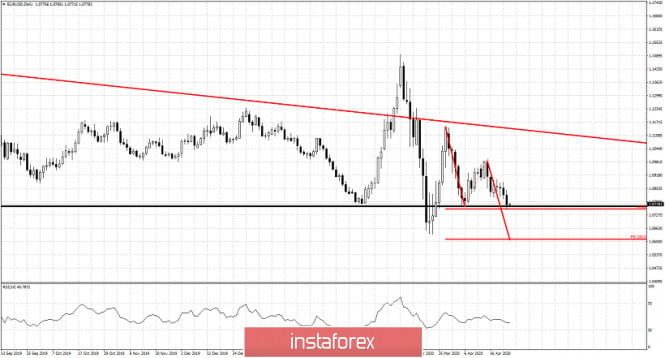
| EURUSD: Bearish pressure increases as price breaks 1.08 Posted: 23 Apr 2020 03:39 PM PDT In all of our previous analysis we warned of the bearish implications when price initially broke below 1.1030-1.10, and then when it broke below 1.09. Recently we noted that if the trading range of 1.08-1.09 was to be broken downwards (most likely scenario according to our Ichimoku cloud analysis) we should expect more selling pressures to push price to 1.06.
|
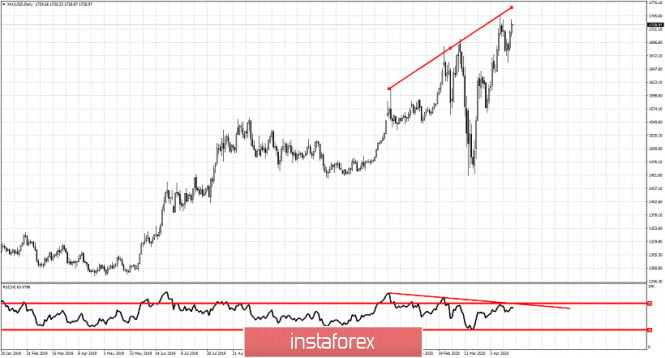
| Gold price provides nice shorting opportunity Posted: 23 Apr 2020 03:30 PM PDT Gold price has managed to climb back above $1.720 maintaining the bullish momentum despite the pull back towards $1,660. Trend remains bullish but the warning signs are still there. Gold price can make a new higher high but the real question is if it can sustain trading above $1,700.
Gold price has provided us with a glaring bearish divergence in the Daily chart. This kind of divergence seldom does not get confirmed. In other words it is very likely over the coming weeks to see a strong pull back in Gold price. As long as the RSI is below the red downward sloping trend line I prefer to be net seller of Gold from $1,720 and above, looking for a pull back at least towards $1,600. This chart formation justifies a pull back below $1,660. The material has been provided by InstaForex Company - www.instaforex.com |
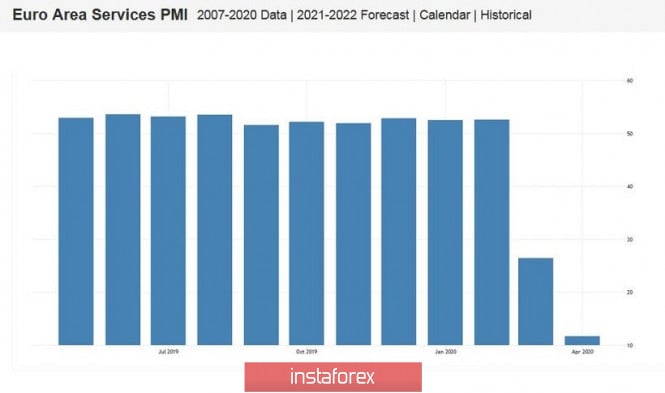
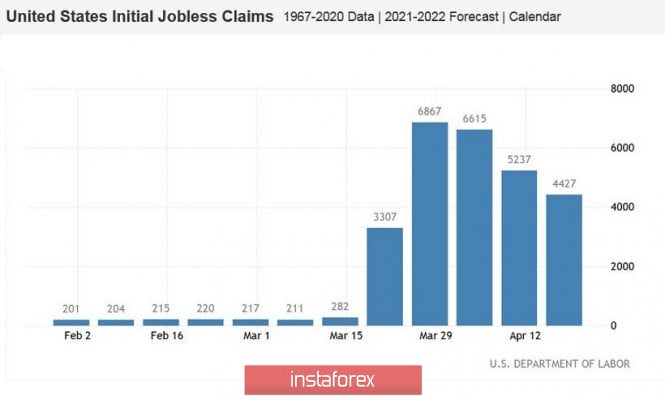
| EUR/USD. Crashing PMIs and bears' failed triumph Posted: 23 Apr 2020 01:09 PM PDT The euro-dollar tested the seventh figure today against the backdrop of the disastrously failed PMI data. The indices turned out to be worse than even the darkest forecasts and became a clear contrast to the fairly good reports of the ZEW institute, which were published on Tuesday. Today's European releases are in the red zone, absolutely everything - without any encouraging exceptions. The EUR/USD pair did not continue to fall only due to the uncertain positions of the US currency and the unexpected statement by Merkel. In addition, traders are now waiting for the results of the online summit of EU leaders, so they are in no hurry to invest in short positions. Nevertheless, today's European statistics served as another alarm bell. The published figures reflect the disastrous consequences of the coronavirus pandemic, while disputes between the south and north of Europe over crown bonds are still ongoing. The European currency quite naturally lost its position against this background, and not only in pairs with the dollar. Thus, the German index of business activity in the manufacturing sector was forecast to fall from 45 points to 39, but eventually dropped to 34. The indicator is below the key 50-point mark since January 2019, which indicates a deterioration in the situation in this sector of the economy. The situation is even worse in the service sector. The corresponding PMI index was above the 50 level until February, but it fell to 31.7 points in March, and it collapsed to 15.9 points in April (a historical anti-record). Experts did not expect a different trend amid the global lockdown, but overall forecasts were more optimistic – according to analysts, the indicator should have fallen to 28 points. Similar indexes in France showed the same result – the index of business activity in the service sector there also updated the anti-record, falling to 10 points. The eurozone index of business activity in the manufacturing sector came out at 33 points (the worst result in the last 11 years), while it collapsed to 11.7 points in the services sector (again – a historical anti-record). The European currency justifiably weakened amid such dynamics, making it possible for the EUR/USD bears to enter the seventh figure. After sellers sold the 1.0850 level, it was inevitable that the seventh price level would be put to a test. But bears need a more powerful informational occasion in order to gain a foothold in this price area. At the same time, the dollar is demonstrating its vulnerability amid a decline in risk appetite. First, the United States Senate recently adopted another package of financial support for the economy worth almost $500 billion. The bill provides for the allocation of $310 billion for a small business income protection program, $75 billion for hospital funding, $25 billion for Covid-19 tests, and $60 billion for loans and grants. As expected, this bill will be supported today in the House of Representatives, after which it will be sent to Trump for signature. In addition, relatively good macroeconomic data was published in the US today. However, it is incorrect to speak about today's figures in a positive context – the releases just turned out to be slightly better than forecasts, and this circumstance put pressure on the US currency. This reaction looks abnormal, but the fact remains that the greenback primarily reacts to the level of anti-risk sentiment (since it is used by the market as the main protective asset) and, second of all, to the dynamics of national macro indicators. So, US data on the labor market and the index of business activity in the manufacturing sector (Manufacturing PMI) were published. It is noteworthy that both releases showed extremely negative results, but nevertheless encouraged by their trend. Judge for yourself: the number of applications for unemployment benefits jumped to three million on March 26, then this figure rose to almost seven million, and it was at around 6.6 million the year before last. This indicator came out at the level of 5.2 million last week, and it reached the level of 4.5 million applications today. In this case, millions of values are not so scary: the trend itself is important. The downward trend against the backdrop of the Senate decision reassured investors, after which the demand for protective instruments (including the dollar) decreased. The US Manufacturing PMI was also better than expected. Experts predicted a significant decline of up to 31 points in April. However, the indicator showed a result of almost 37 points. And although the decline itself is record-breaking, the softer numbers had a beneficial effect on the market. The oil market, which is showing growth today, pulled the stock market along with it - the main Wall Street indices opened in the green zone today, and the S&P 500 is trading above 2,800 points (at the time of writing these lines - at around 2831). In other words, the general market sentiment looks optimistic, and this fact does not make it possible for dollar bulls to show character. In turn, the EUR/USD bears could not keep the pair within the seventh figure due to the euro's weakness - the price returned to the eighth price level after updating the low at 1.0756. it is risky to open long or (especially) short positions in such conditions. For example, the mere statement by German Chancellor Angela Merkel that "the regional assistance program should be large-scale" instantly returned the EUR/USD pair to the eighth figure. This suggests that the results of the online summit of EU leaders can substantially redraw the fundamental picture for the pair - the price will either return to the seventh figure or rise to the resistance level of 1.0910. Therefore, at the moment, you are advised to take a wait-and-see attitude and carefully monitor European news feeds. The material has been provided by InstaForex Company - www.instaforex.com |
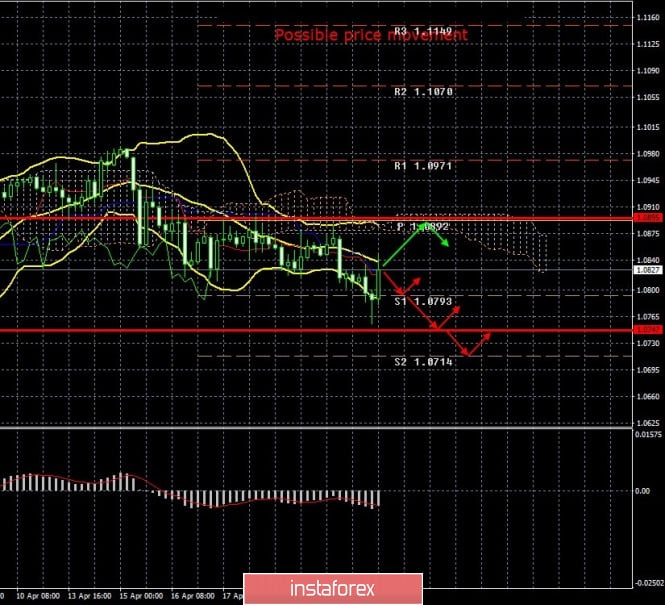
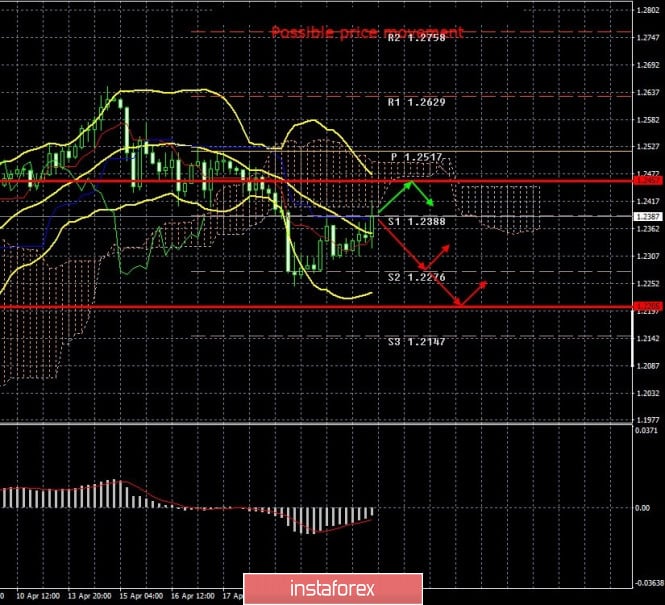
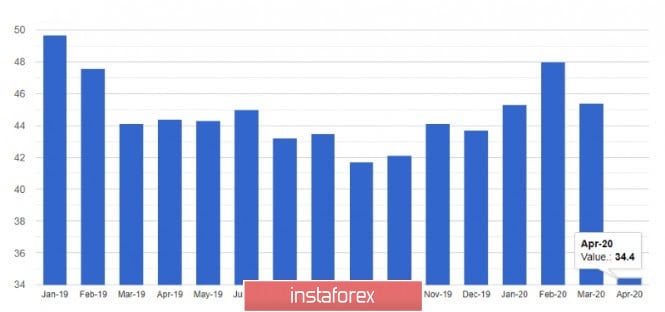
| Posted: 23 Apr 2020 01:05 PM PDT 4-hour timeframe Average volatility over the past five days: 74p (average). The EUR/USD currency pair was quite active on Thursday. The total volatility of the day was almost 100 points a few hours before it ended. Thus, we can say that traders did not sit on the fence today, but actively traded. We can only figure out what caused this activity and what awaits the pair in the future. Let's start with the fact that a sharp reversal of the pair up occurred in the second half of the day. In the first half, the euro/dollar pair continued to adhere to the downward trend that was formed after the pair's side channel quotes were released. The European Union published data on business activity in the services and manufacturing sectors in the morning. Although these figures were only preliminary, we believe that they are still important, since the preliminary and final values are rarely very different. Business activity in the German manufacturing sector fell to 34.4 points, while it dropped to 15.9 in the service sector. In France, business activity in the manufacturing sector fell to 31.5 points, and in services - to 10.4. In the EU as a whole, business activity in the manufacturing sector fell to 33.6, and in the service sector – to 11.7. There have never been such figures of business activity in either the first sector or the second. Therefore, this package of macroeconomic statistics cannot be called bad. It's just a failure and even worse. Although what else could you expect from these reports in the midst of the crisis? The service sector is now closed, almost completely. Closed shops, travel agencies, gyms, cinemas, shopping centers - everything is closed. So the drop in business activity to almost to zero is completely logical. Things are a little better when it comes to manufacturing, as large-scale production, factories continue to work. Although if it comes to the production of essential goods like food and medicine, then everything is fine, but all other industries, if they continue to work, are reduced as much as possible. Who, for example, is currently buying cars? Or bicycles? Or sofas? Thus, formally, the manufacturing sector remains afloat, but it is unlikely that it will feel much better than the services sector. Data on applications for unemployment benefits for the week of April 17 was published in the United States in the afternoon, which everyone was waiting for. Almost no one was surprised by the next 4.4 million primary applications and 16 million secondary applications. Recall that the first indicator takes into account only new applications, and the second-repeated applications from citizens who already receive unemployment benefits. Thus, the second indicator even more accurately reflects the current situation. However, the difference between the first and second indicators is now about ten million (the number of initial applications reached 26 million over the past five weeks). So the question is: have these 10 million found jobs in recent weeks? Or simply did not apply for the benefit again? Or were they denied benefits? In any case, the unemployment situation in the United States remains catastrophic. We believe that this report is associated with the fall of the US currency in the second half of the day. Data on US business activity, which also did not particularly please traders, was released. The value decreased to 27 in the service sector, and to 36.9 in the production sector. A little better than Europe, but generally the same. Thus, the US dollar slightly retreated today "thanks to" unemployment statistics. However, we still believe that technical factors now play a more important role than the macroeconomic background. Thus, a price rebound from the Kijun-sen critical line could trigger a resumption of the downward trend. 4-hour timeframe Average volatility over the past five days: 126p (high). The GBP/USD currency pair continued to adjust against the downward trend formed recently. The Kijun-sen line worked out, from which at the moment, we can say, there was a rebound. Therefore, the downward trend continues, and the correction may end near this line. In general, trading on the pound/dollar pair was not too volatile today. The pair passed 107 during the day with an average volatility value of 126 points. And this is despite the fact that there was a strong macroeconomic background. But if the movement of the euro/dollar pair still somehow fits into the picture of macroeconomic reports, the British currency again ignored all the data. Business activity in the UK services sector fell to 12.3 points, and in the manufacturing sector - to 32.9. The CBI report on changes in industrial orders was -56 in April. That is, in fact, all three reports were failures, as well as in all other EU countries. At the same time, the British pound was quietly growing against the dollar. It was a correctional growth, but it also makes us understand that traders continue to ignore any incoming information. The pair's activity slightly increased and the pound accelerated its decline when the report on applications for unemployment benefits was published during the US session. However, this acceleration quickly turned into nothing and now there is every chance for the downward movement to resume. Therefore, we stick with our opinion: no macroeconomic reports or fundamental events in the world have any effect on the movement of the currency pair right now. Based on this, we advise you to continue monitoring all news and reports in order to understand at what level this or that economy is. So that when the crisis is over, you can clearly understand to what levels the economy of a country has fallen into and how this could threaten its national currency. In the meantime, we advise you to focus on technical factors that, from our point of view, continue to move all currency pairs. Recommendations for EUR/USD: For short positions: The EUR/USD pair resumed its downward movement on the 4-hour timeframe and immediately began to correct. Thus, sell orders remain relevant now, but we advise you to wait for a rebound from the Kijun-sen line and sell the euro with targets at 1.0747 and 1.0714. For long positions: Ii is advised to return to purchases of the euro currency only when the price has been consolidated above the critical line by small lots with the first goal being the volatility level of 1.0895. Recommendations for GBP/USD: For short positions: The pound/dollar continues the upward correction, which could end near the Kijun-sen line. Thus, traders are advised to sell the pound again with targets at 1.2276 and 1.2205 if a rebound occurs from the critical line. For long positions: You are advised to consider new purchases of the GBP/USD pair at the earliest when the price has been pinned above the Kijun-sen line in small lots with the first goal of the pivot level 1.2517. The material has been provided by InstaForex Company - www.instaforex.com |
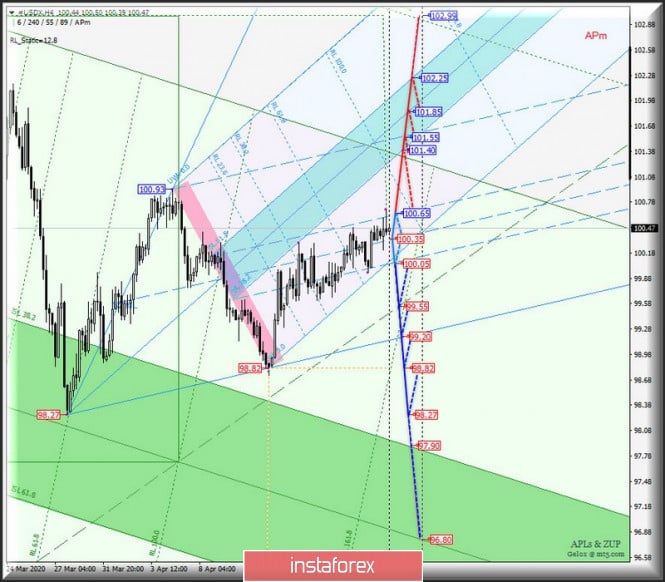
| Posted: 23 Apr 2020 09:54 AM PDT Minuette operational scale (H4) The main cross-tools against the dollar index - what's next? Options for the development of the movement for #USDX vs EUR/GBP, GBP/JPY, and EUR/JPY (H4) on April 24, 2020. ____________________ US dollar index From April 24, 2020, the development of the movement of the dollar index #USDX will be determined by working out and the direction of the breakdown of the channel boundaries 1/2 Median Line (100.05-100.35-100.65) of the Minuette operational scale forks - we look at the animation chart for the movement options inside this channel. Breakdown of the lower boundary of the channel 1/2 Median Line of the Minuette operational scale forks - support level of 100.05 - the continuation of the downward movement of the dollar index to the targets:
In the case of a breakdown of the resistance level of 100.65 at the upper border of the channel 1/2 Median Line Minuette, the upward movement of #USDX can be continued to the equilibrium zone (101.40-101.85-102.25) of the Minuette operational scale forks. The layout of the #USDX movement options from April 17, 2020 is shown on the animated chart.
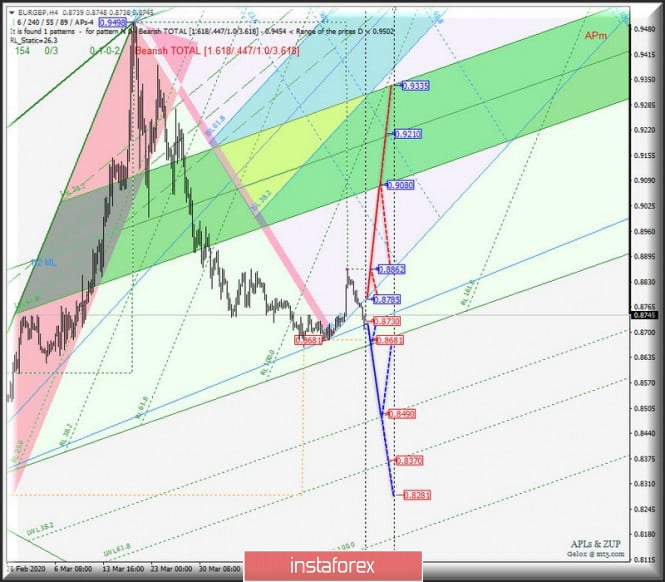
____________________ Euro vs Great Britain pound From April 24, 2020, the movement of the "main" EUR/GBP cross-instrument will be determined by the development and direction of the breakout of the range:
Breakdown of the initial line of SSL of the Minuette operational scale forks - resistance level of 0.8785 - with a subsequent update of the local maximum of 0.8862 - the option of developing an upward movement of EUR/GBP to the equilibrium zone (0.9080-0.9210-0.9335) of the Minuette operational scale forks. The breakdown of the control line LTL of the Minuette operational scale forks - the support level of 0.8730 - and then updating the local minimum of 0.8681 - will make it possible to continue the development of the EUR/GBP downward movement to the warning line LWL38.2 (0.8490) of the Minuette operational scale fork. The EUR/GBP movement options from April 24, 2020, depending on the processing of the 1/2ML Minute channel, are shown on the animated chart.
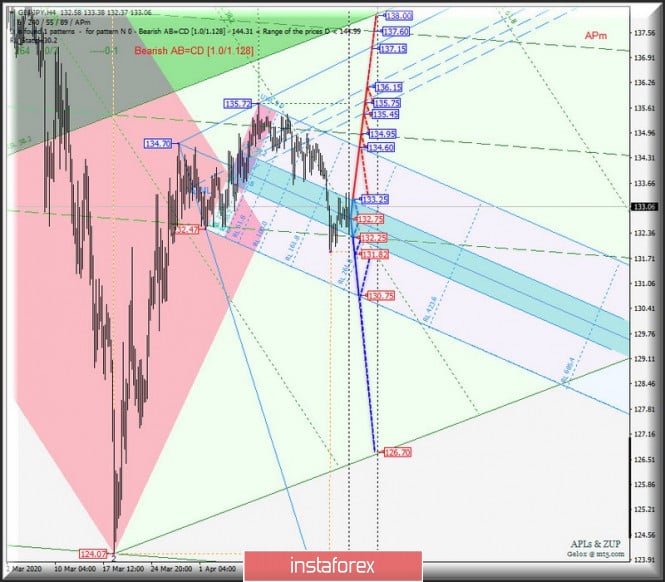
____________________ Great Britain pound vs Japanese yen The development of the movement of the GBP/JPY cross-instrument from April 24, 2020 will depend on the development and direction of the breakdown of the boundaries of the equilibrium zone (132.25-132.75-133.25) of the Minuette operational scale forks - we look at the motion marking inside this equilibrium zone on the animated chart. Breakdown of the upper border of ISL38.2 of the balance zone of the Minuette operational scale forks - resistance level of 133.25 - development option of the upward movement GBP/JPY to the targets:
A breakout of the lower border ISL61.8 of the Minuette operational scale fork - support level of 132.25 - followed by updating the local minimum 131.82 - will make the continuation of the development of the downward movement GBP/JPY to the final line FSL Minuette (130.75) relevant. From April 24, 2020, we look at the GBP/JPY movement options on the animated chart.
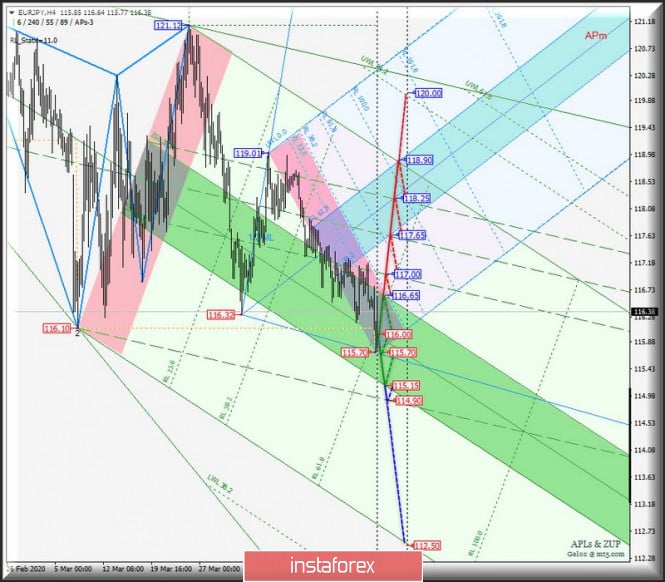
____________________ Euro vs Japanese yen The development and direction of the breakdown of the boundaries of the equilibrium zone (115.15-116.00-115.65) of the Minuette operational scale forks will begin to determine the development of the movement of the EUR/JPY cross-instrument from April 24, 2020 - the details of the movement inside this zone are presented on the animated chart. Breakdown of the upper border of ISL38.2 of the balance zone of the Minuette operational scale forks - resistance level of 116.65 - a continuation of the movement of EUR/JPY to the borders of the channel 1/2 Median Line Minuette (117.00-117.65-118.25) and equilibrium zones (117.65-118.25-118.90) of the Minuette operational scale forks. With the joint breakdown of the lower boundary of the ISL61.8 equilibrium zone of the Minuette operational scale forks - support level of 115.15 - and the final Shiff Line Minuette (114.90), it will be possible to continue the downward movement of EUR/JPY to the final FSL Minuette line (112.50). The markup of the EUR/JPY movement options from April 24, 2020 is shown on the animated chart.
____________________ The review is compiled without taking into account the news background, the opening of trading sessions of the main financial centers, and is not a guide to action (placing "sell" or "buy" orders). Formula for calculating the dollar index: USDX = 50.14348112 * USDEUR0.576 * USDJPY0.136 * USDGBP0.119 * USDCAD0.091 * USDSEK0.042 * USDCHF0. 036. Where the power coefficients correspond to the weights of currencies in the basket: Euro - 57.6 %; Yen - 13.6 %; Pound - 11.9 %; Canadian dollar - 9.1 %; Swedish Krona - 4.2 %; Swiss franc - 3.6 %. The first coefficient in the formula brings the index value to 100 on the starting date - March 1973, when the main currencies began to be freely quoted relative to each other. The material has been provided by InstaForex Company - www.instaforex.com |
| April 23, 2020 : EUR/USD Intraday technical analysis and trade recommendations. Posted: 23 Apr 2020 08:31 AM PDT
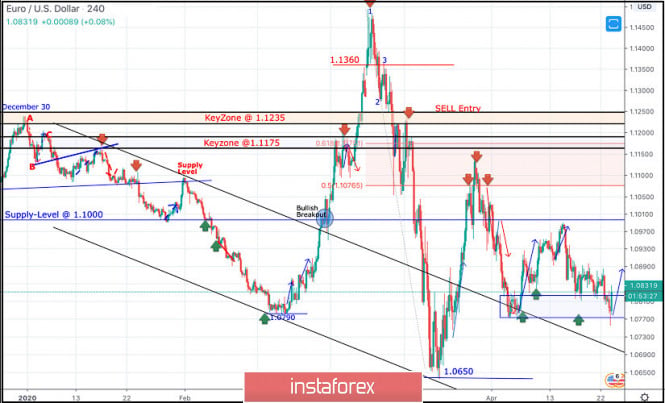
Since December 30, the EURUSD pair has trended-down within the depicted bearish channel until the depicted two successive Bottoms were established around 1.0790 then 1.0650 where the EUR/USD pair looked OVERSOLD after such extensive bearish decline. Few weeks ago, the EURUSD pair has expressed significant bullish recovery around the newly-established bottom around 1.0650. The following bullish engulfing H4 candlesticks as well as the recently-demonstrated ascending bottoms indicated a high probability bullish pullback at least towards 1.0980 and 1.1075 (Fibonacci Level 50%). Key Supply-Levels in confluence with significant Fibonacci levels are located around 1.1075 (50% Fibonacci) and 1.1175 (61.8% Fibonacci) where bearish rejection was highly-expected upon the latest bullish pullback that took place by the end of March. That was when the depicted Head & Shoulders pattern was demonstrated around the price levels of (1.1000 - 1.1075). Shortly after, further bearish decline was demonstrated towards 1.0800 where the nearest demand level to be considered was located near the backside of the broken channel (1.0800-1.0750). Early signs of Bullish rejection have been manifested around the price zone of (1.0800-1.0750) leading to the recent bullish spike up to 1.0990. The short-term technical bullish outlook remains valid as long as bullish persistence is maintained above the recently-established ascending Bottom around 1.0770. Further bullish advancement is expected to pursue towards 1.1000, 1.1075 then 1.1175 where 61.8% Fibonacci Level is located. Despite the recent bearish decline, the price zone of (1.0815 - 1.0775) stood as a prominent Demand Zone which has been providing bullish support for the pair. On the other hand, Please note that any bearish breakout below 1.0830 or 1.0770 (the recently established bottoms) invalidates the previously-mentioned bullish outlook. Trade recommendations : Intraday traders should be looking for valid short-term BUY trades around the price zone of 1.0815 - 1.0775. S/L to be placed below 1.0740 while T/P levels to be located around 1.0850, 1.0900 and 1.1075. The material has been provided by InstaForex Company - www.instaforex.com |
| April 23, 2020 : GBP/USD Intraday technical analysis and trade recommendations. Posted: 23 Apr 2020 08:19 AM PDT
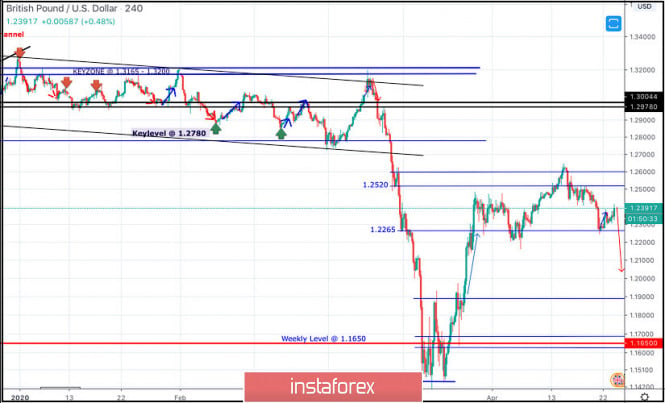
Recently, the GBPUSD has reached new LOW price levels around 1.1450, slightly below the historical low (1.1650) achieved in September 2016. That's when the pair looked very OVERSOLD around the price levels of 1.1450 where a double-bottom reversal pattern was recently demonstrated as depicted on the chart. Technical outlook will probably remain bullish if bullish persistence is maintained above 1.1890-1.1900 (Double-Bottom Neckline) on the H4 Charts. Bullish breakout above 1.1900 invalidated the bearish scenario temporarily & enabled a quick bullish movement to occur towards 1.2260. Next bullish targets around 1.2520 and 1.2680 were expected to be addressed if sufficient bullish momentum was maintained. However, early bearish pressure signs have originated around 1.2470 leading to the previous bearish decline towards 1.2265. That's why, H4 Candlestick re-closure below 1.2265 was needed to hinder further bullish advancement and enhance the bearish momentum on the short term. On the other hand, the recent bullish persistence above 1.2265 has enhanced another bullish pullback movement up to the price levels of 1.2520-1.2590 where early signs of bearish rejection were manifested. A Bearish Head & Shoulders reversal pattern may be in progress. That's why, the current bearish decline below 1.2520 is probably confirming this reversal pattern. Bearish persistence below 1.2265(Reversal Pattern Neckline) is needed to enhance another bearish movement towards 1.2100, 1.2000 then 1.1920 where price action should be evaluated again. Trade recommendations : Conservative traders should be looking for bearish breakout below 1.2265 as a valid SELL entry. T/P level to be located around 1.2100, 1.2000 then 1.1920 while S/L should be placed above 1.2400. The material has been provided by InstaForex Company - www.instaforex.com |
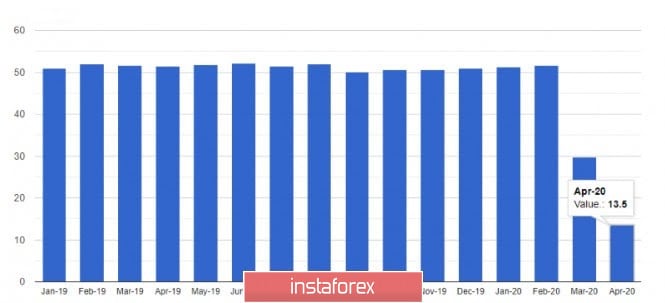
| EURUSD: Continued decline in the Eurozone economic activity Posted: 23 Apr 2020 07:46 AM PDT Economic activity in the eurozone countries continues to decline at a record pace, and, despite preliminary data, the euro responded by falling against a number of world currencies, while the US dollar continues to strengthen. A particularly large drop was observed in the service sector, which suffered the most due to the spread of coronavirus and is in a very terrible state. Even during the financial crisis, there was no such record drop in performance. Given the quarantine measures that most of the eurozone countries have resorted to, the service sector will continue to decline, so it's too early to talk about bottoming out with indices. Accordingly, all this will affect the general indicator of GDP, which economists have not yet talked about at all, making only general forecasts, According to the data, the sentiment index in business circles of France in April of this year fell to 82 points against 98 points in March, while its decline was forecasted to reach 91 points. The mood in business circles will continue to decline further, since no one is going to cancel quarantine measures, and it is hard to say when the economy will return to its full functioning. According to the statistics agency Markit, the preliminary index of PMI procurement managers for the manufacturing sector in France in April this year fell to 31.5 points against 43.2 points in March with a forecast of 37.0 points. As I noted above, the service sector suffered the most, where the preliminary PMI of purchasing managers fell to a record 10.4 points in April against 27.4 points in March and a forecast of 25 points from economists. Similar indicators in Germany also failed to please traders, although the decline in economic activity in the key eurozone economy is not as strong as in other countries. However, it is also impossible to say that the indicators will not have a negative impact on GDP. The report of the statistics agency indicated that the preliminary index of PMI procurement managers for the manufacturing sector in Germany in April fell to 34.4 points from 45.4 points in March with a forecast of 39.0 points. The service sector collapsed to 15.9 points against 31.7 points in March, with a forecast of 28.6 points. The leading indicator of consumer sentiment in Germany indicated another drop in the indicator due to the coronavirus pandemic and related isolation measures. According to a report by the GfK research group, the consumer confidence index in Germany in May 2020 fell to -23.4 points from 2.3 points in April after the indicator was revised downward. Economists had expected that in May the indicator would decline only to -1.8. However, Gfk noted that, given the almost complete freezing of the economy, an unprecedented fall was not surprising. The return of the economy to life will lead to a rapid recovery of the indicator. Data on the economic activity of the eurozone as a whole negatively affected euro quotes. The report indicates that the preliminary index of PMI procurement managers for the manufacturing sector of the eurozone in April dropped to 33.6 points against 44.5 points in May with a forecast of 9.3 points. The preliminary index of PMI procurement managers for the eurozone services sector fell to 11.7 points in April from 26.4 points in March. It is very difficult to talk about when the activity starts to recover, as much will depend on support measures from the European regulator, as well as on the departure of the coronavirus pandemic, which is actively progressing in the EU countries. The PMI Composite Purchasing Managers Index, which includes services and manufacturing, fell to 13.5 points in April from 29.7 points in March. The material has been provided by InstaForex Company - www.instaforex.com |
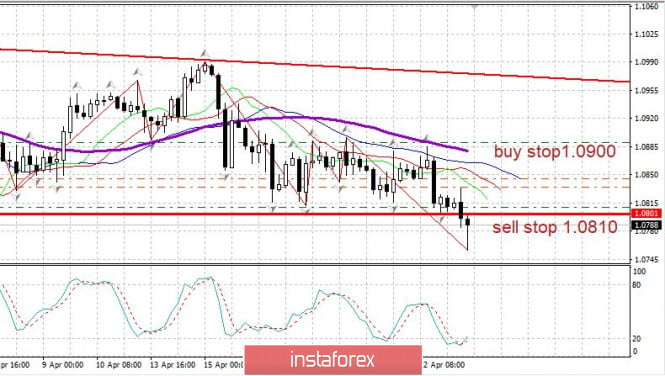
| Evening review for April 23, 2020. EURUSD. US unemployment rate Posted: 23 Apr 2020 06:19 AM PDT
A weekly report on US employment has been released. The number of unemployment applications surged to 4.4 million, but this is still considered a growth slowdown, as forecasts predicted a growth rate of 5 million. Long-term unemployment rose to 16 million people. The euro opened down from 1.0810, and while we are standing down, we moved our stops to 1.0835. But the euro is eager to fight this downfall. Be ready to buy euros at a turn from 1.0890. The material has been provided by InstaForex Company - www.instaforex.com |
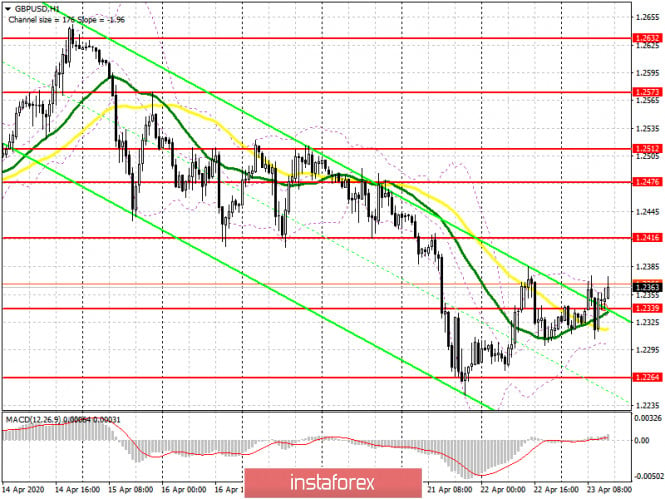
| Posted: 23 Apr 2020 04:47 AM PDT To open long positions on GBPUSD, you need: The British pound is actively fighting for the level of 1.2339, which I drew attention to in my morning review. Terrible data on the reduction of the UK services sector put pressure on the pair in the first half of the day, but it was not possible to achieve a larger downward trend. At this moment, the bulls regained the level of 1.2339, and trading above this range can be expected to continue the upward correction in the district resistance of 1.2416, and then to test the high of 1.2476, where I recommend taking the profit. In the scenario of a repeated return of GBP/USD to the support of 1.2339, it is best to look at long positions only for a rebound from the weekly low in the area of 1.2264, and then, in the calculation of an upward correction of 30-40 points within the day. To open short positions on GBPUSD, you need: Sellers have tried several times to resume the bearish trend below the level of 1.2339, but so far they have not been able to do so. One of the advantages is the inability of the bulls to update the highs of yesterday, which keeps the market on the side of sellers of the pound. As soon as the bears once again push the pair under the support of 1.2339, and fix themselves below it, you can open short positions in order to continue the decline of GBP/USD to the area of the minimum of 1.2264 and a larger fall of the pair to the support of 1.2173, where I recommend fixing the profits. In the scenario of GBP/USD growth in the second half of the day, you can return to short positions after testing the maximum of 1.2416, or even higher, from a large resistance of 1.2476, counting on correction of 30-40 points within the day.
Signals of indicators: Moving averages Trading is conducted around the 30 and 50 daily averages, which indicates market uncertainty with a slight advantage of bears. Note: The period and prices of moving averages are considered by the author on the hourly chart H1 and differ from the general definition of the classic daily moving averages on the daily chart D1. Bollinger Bands A break in the lower border of the indicator around 1.2295 will increase the pressure on the pair. A break of the upper limit in the area of 1.2365 will lead to a larger upward correction. Description of indicators
|
| Posted: 23 Apr 2020 04:46 AM PDT Corona virus summary:
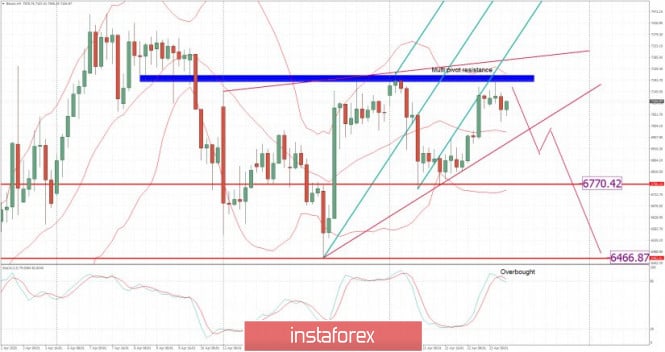
Australia's Prime Minister Scott Morrison said all members of the World Health Organization (WHO) should cooperate with a proposed independent review into the spread of coronavirus. (04.35) And the US government announced that it will assess whether the World Health Organization is being run the way that it should be. (02.30) Meanwhile Germany's Angela Merkel called the WHO an "indispensable partner" (08.55) and China donated a further $30 million to the organization, which is seeking more than $1 billion to fund its battle against the coronavirus pandemic. (10.02) Technical analysis: BTC been trading upwards. The price tested and rejected of the major resistance pivot at the price of $7,200. Be careful with buying into the resistance. My advice is to wtach for selling opportunities if you see any intrraday bearish pattern. Trading recommendation: Watch for potential selling opportunities and eventual breakout of the rising support trendline in the backgorund. There is potential for the downside rotation towards the levels at $6,770 and $6,465. Stochastic oscillator is showing overbought condition and potential for the rotation to the downside. The material has been provided by InstaForex Company - www.instaforex.com |
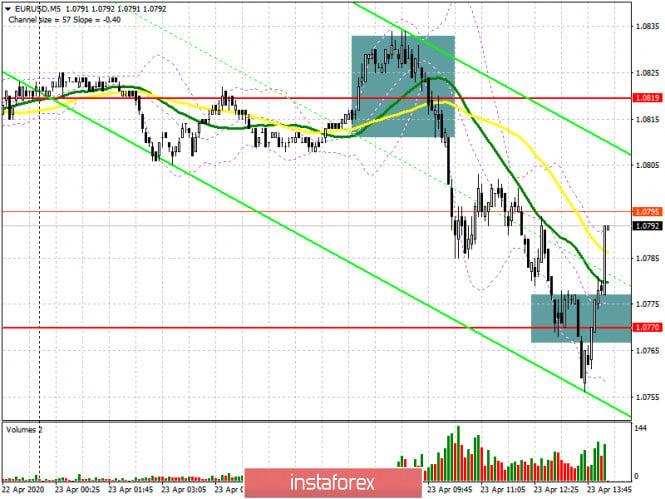
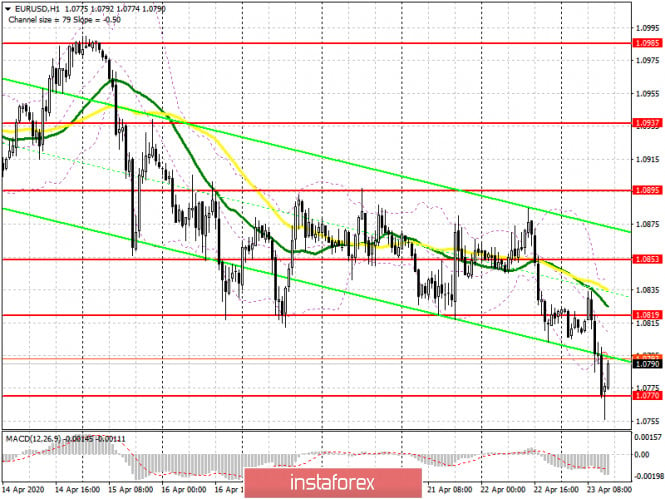
| Posted: 23 Apr 2020 04:44 AM PDT To open long positions on EURUSD, you need: Today, the European currency quite predictably collapsed against the US dollar after the release of a number of reports indicating a sharp reduction in economic activity in the Eurozone. The services sector suffered the most. Back in the morning review, I recommended opening short positions after forming a false breakout in the resistance area of 1.0819, which happened. This is clearly visible on the 5-minute chart, where the activity of buyers appeared only after updating the minimum of 1.0770. At the moment, the bulls will focus on holding this level, since only in this scenario can we expect an upward correction to the resistance area of 1.0819, where I recommend fixing the profits. All hope for the EU summit and for good news on the allocation of a new package of assistance to fight the consequences of the crisis. In the scenario of a further decline in EUR/USD in the second half of the day, which is more likely to be true, it is best to consider new long positions around the minimum of 1.0718 in the expectation of correction of 30-40 points within the day.
To open short positions on EURUSD, you need: Sellers coped well with the morning task and continued the fall of the euro, as I discussed in detail in my review. After reaching the support of 1.0770, the bears retreated from the market, which led to a slight rebound of the pair up. However, as we can see on the chart, it seems that the sellers are not going to stop. Bad news on the US labor market and economic activity in the US, along with the failed EU summit, will definitely hit the euro's positions, which will lead to a repeat test of the minimum of 1.0770 and to its breakdown. After that, you can count on updating the support of 1.0718 and returning EUR/USD to the minimum of March this year (1.0636), where I recommend fixing the profits. In the scenario of an upward correction of the pair in the second half of the day, you can return to short positions only after the formation of another false breakout from the resistance of 1.0819 or sell the euro immediately on a rebound from the maximum of 1.0853.
Signals of indicators: Moving averages Trading is below the 30 and 50 daily moving averages, which indicates a further fall in the euro. Note: The period and prices of moving averages are considered by the author on the hourly chart H1 and differ from the general definition of the classic daily moving averages on the daily chart D1. Bollinger Bands In the case of an upward correction, the upper limit of the indicator around 1.0840 will act as a resistance. Description of indicators
|
| Posted: 23 Apr 2020 04:36 AM PDT Corona virus summary:
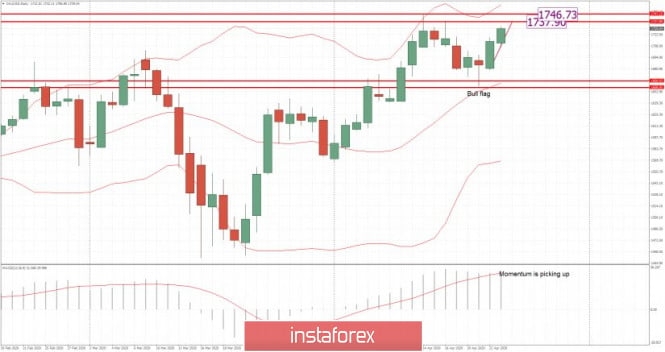
" Technical analysis: Gold been trading upwards as I expected yesterday. The Gold ris very close to reach first upward target at the price of $1,737. The trend is still to the upside and there is the big chance for the upside momentum to continue. Trading recommendation: MACD oscillator is showing increasing in the upside momentum, which is good additional sign fo the buyers. The material has been provided by InstaForex Company - www.instaforex.com |
| Posted: 23 Apr 2020 04:29 AM PDT Corona virus summary:
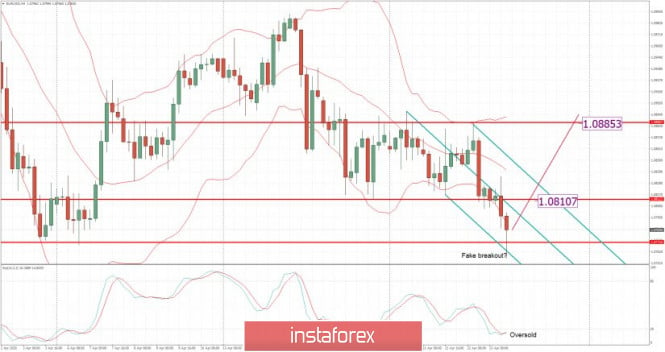
Germany risks damaging its recent achievements in subduing the spread of Covid-19, Angela Merkel has warned, admonishing regional leaders and party representatives for trying to rush their way out of lockdown restrictions. Some smaller, non-essential stores reopened their doors in Germany this week as state authorities started to ease physical distancing measures introduced a month ago. The country's decentralised political system has allowed some of the 16 federal states to surge ahead with special exemptions for local businesses, such as North-Rhine Westphalia allowing the opening of larger furniture stores. Technical analysis: EUR/USD has been trading downwards. The price tested the level of 1,0755. Anyway, I found that there is potential for the fake breakout of the 20-day low at the price of 1,0770, which is good opportunity for the long positions. Trading recommendation: Watch for potential buying opportunities due to fake breakout of the 20-day low at the price of 1,0755. The upward targets are set at the price of 1,0810 and 1,0855. Stochastic oscillator is showing oversold condiiton, which is sign that sellerrs got exhausted.... Support level is set at 1,0770. The material has been provided by InstaForex Company - www.instaforex.com |
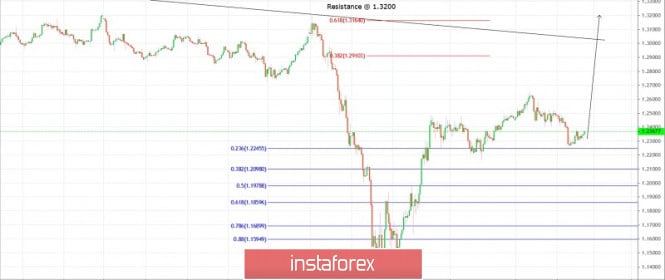
| Trading plan for GBP/USD for April 21, 2020 Posted: 23 Apr 2020 04:29 AM PDT
Technical outlook: GBP/USD is most likely to resume a rally towards 1.3200 and 1.3500 levels. The currency pair has re-tested 1.2245 levels, which is fibonacci 0.236 retracement of the previous rally between 1.1450 and 1.2485 respectively. Please note that it is possible for yet another drop towards 1.2100 levels, which is fibonacci 0.382 support of the above rally. Overall, GBP/USD is expected to resume its rally towards 1.3200 and 1.3500 levels either from the current levels (1.2350) or from 1.2100 levels respectively. The bullish structure is expected to remain intact until prices stay above 1.1414 support. Immediate resistance is seen towards 1.3200 levels and a break higher would confirm long term trend reversal. Only a drop below 1.1414 levels would nullify the above bullish structure. Trading plan: Remain long, stop at 1.1414, target is open. Good luck! The material has been provided by InstaForex Company - www.instaforex.com |
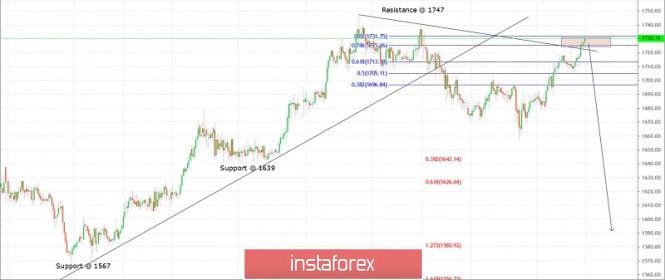
| Trading plan for Gold for April 23, 2020 Posted: 23 Apr 2020 04:14 AM PDT
Technical outlook: Gold is retracing its earlier drop between $1,747 and $1,659 levels. As seen on the hourly chart , the yellow metal is testing just above the fibonacci 0.786 retracement of earlier drop. Furthermore, a resistance trend line connecting $1,747 and $1,738 levels is also being tested at this point in writing. Ideally, a bearish reversal is expected from current price action, which could drag the yellow metal lower towards $,1630 and further. Only a push above $1,747 would be a matter of concern for bears and delay matters further. Immediate price resistance is seen towards $1,738, while support is at $1,640 respectively. Bears would remain poised to push lower and target below $1,640 levels in the short term. The bottom line is that prices should stay below $1,747 levels, for bears to remain in control. Trading plan: Remain short, stop at $1,747, target is open. Good luck! The material has been provided by InstaForex Company - www.instaforex.com |
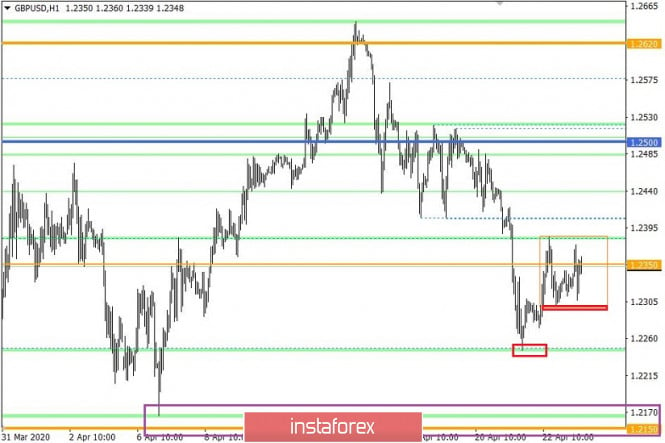
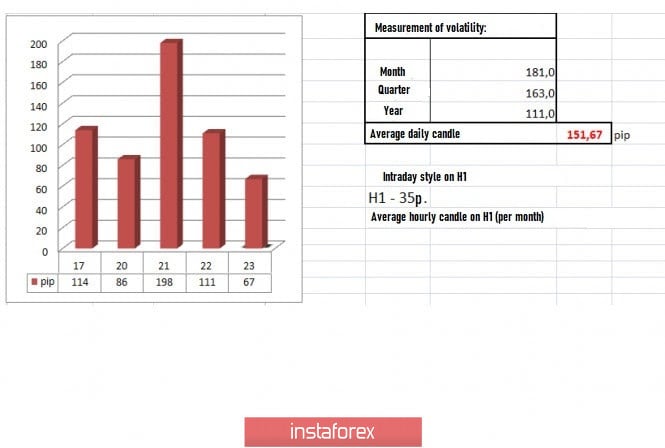
| Trading recommendations on GBP/USD for April 23, 2020 Posted: 23 Apr 2020 04:02 AM PDT Concentration of trading forces within the mirror level is observed. The variable support point of 1.2250 and the 400 points course of the resistance level did not go unnoticed. Quotes went into local correction and met the familiar mirror level of 1.2350. Actual price fluctuations within the 1.2350 level reflect a peculiar regrouping of trading forces, which means that the mirror level can still give us due acceleration. Downward move is still possible. Further acceleration may still be triggered by the theory of compression, which can break the control points and resume the main trend. Correlation between EUR/USD and GBP/USD remains, so a similar scenario may reflect with the pound, that is, the development of recovery process relative to March 20-April 14's course. To further understand the theory and intentions of the single currency, read this article. A round of long positions started at the European session yesterday. Quotes managed to locally overcome the mirror level of 1.2350, and subsequent fluctuation occurred along the level of 1.2350 before the close of the daily candle. In the previous review, traders considered lowering the rates by working out the resistance level of 1.2350. The adjustment happened, but the turn was only enough to reach the value of 1.2300. Volatility is still lower than the daily average by about 26%. Nevertheless, it is still above the 100 points mark, which indicates that the slowdown is still too early. Details of volatility: Monday - 165 points; Tuesday - 245 points; Wednesday - 172 points; Thursday - 358 points; Friday - 359 points; Monday - 144 points; Tuesday - 271 points; Wednesday - 676 points; Thursday - 354 points; Friday - 522 points; Monday - 267 points; Tuesday - 296 points; Wednesday - 333 points; Thursday - 452 points; Friday - 352 points; Monday - 148 points; Tuesday - 227 points; Wednesday - 108 points; Thursday - 126 points; Friday - 198 points; Monday - 116 points; Tuesday - 217 points; Wednesday - 131 points; Thursday - 122 points; Friday - 42 points; Monday - 87 points; Tuesday - 146 points; Wednesday - 193 points; Thursday - 119 points; Friday - 114 points; Monday - 86 points; Tuesday - 198 points; Wednesday - 111 points. The average daily indicator, relative to the dynamics of volatility, is 151 points [see the table of volatility at the end of the article]. Outlines of the head and shoulders pattern can still be observed in the daily chart. To form the "right shoulder", the quote needs to show local upward interest in the direction of 1.2430–1.2470. However, the downward trend still remains. Meanwhile, Britain's inflation data coincided with forecasts, recording a decrease from 1.7% to 1.5%. Regarding quarantine measures, according to British Foreign Minister Dominic Raab, who is temporarily replacing the ill Prime Minister, the introduction of quarantine was not later than necessary, but strictly in accordance with the recommendation of doctors and scientists. "The government has always followed the recommendations of doctors and scientists, and will continue to follow them ... I do not accept such accusations," said Raab, in response to questions and accusations last Wednesday. Raab also said that the UK still has not passed the "peak" of the pandemic, and restrictive measures will be reviewed according to the official record of coronavirus cases and recommendations of scientists. Downing Street previously provided a set of requirements to take into account when easing quarantine measures. The key points are: - Assurance that the National Health Service can cope with its work, and that the NHA can provide adequate level of necessary assistance throughout the UK. - A steady and consistent drop in daily mortality rates, to be sure that the peak incidence in the UK is passed. - Obtain reliable data from the Scientific Advisory Group on Emergencies, showing that the level of infection has decreased to acceptable levels in all areas. - Guarantee that any adjustments to the current quarantine measures will not lead to the risk of a re-outbreak, which will become an unbearable burden for the health system. Britain's preliminary data on business activity indices were published today, which turned out much worse than forecasts. Business activity in the service sector fell from 34.5 to 12.3, and production index fell from 47.8 to 32.9. As a result, the composite index fell from 36.0 to 12.9. Terrible reports on the UK economy will not end soon. A similar index for the US will be published in the afternoon. Nothing good is expected. The weekly data on US unemployment benefits will also come out, where the volume of initial applications is expected to be 4,545,000, and the number of repeated ones is expected to be 13,000 000. Further development Fluctuation along the mirror level of 1.2350 is observed in the current trading chart. Regrouping of trade forces will lead to a new round of activity. Considering the main movements, a downward move is not ruled out. Meanwhile, market activity is fixed within the framework of accumulation, which is a sign of a high coefficient speculative interest. Traders continue considering short positions, but the fluctuation drives market focus to the local framework. Downward move may remain, where main positions will occur after consolidation below 1.2300. With the local acceleration, overcoming April 21's low [1.2246] may be possible. Based on the above information, we drew these trading recommendations: - Consider short positions below 1.2300, towards 1.2250. Consolidation below opens path to the main level of 1.2150. - Alternatively, consider long positions if the price consolidates above 1.2390, going towards the direction of 1.2430–1.2480. Indicator analysis Indicators of hourly and daily periods continue to signal sales, which reflects general interest. Minute intervals are in variable chatter. Volatility per week / Measurement of volatility: Month; Quarter; Year Volatility measurement reflects the average daily fluctuation, calculated per Month / Quarter / Year. (April 23 was built, taking into account the time of publication of the article) Current volatility is 67 points, which is 44% below the average daily value. Local accumulation incase of a break of the frames 1.2300 / 1.2380 is expected. Key levels Resistance zones: 1.2350 **; 1.2500; 1.2620; 1.2725 *; 1.2770 **; 1.2885 *; 1.3000; 1.3170 **; 1.3300 **; 1.3600; 1.3850; 1.4000 ***; 1.4350 **. Support Areas: 1.2280 (1.2240); 1.2150 **; 1.2000 *** (1.1957); 1.1850; 1.1660; 1.1450 (1.1411); 1.1300; 1,1000; 1,0800; 1,0500; 1,0000. * Periodic level ** Range Level *** Psychological level **** The article was built based on the principle of conducting a transaction, with daily adjustment The material has been provided by InstaForex Company - www.instaforex.com |
| Trading plan for EUR/USD for April 23, 2020 Posted: 23 Apr 2020 03:59 AM PDT
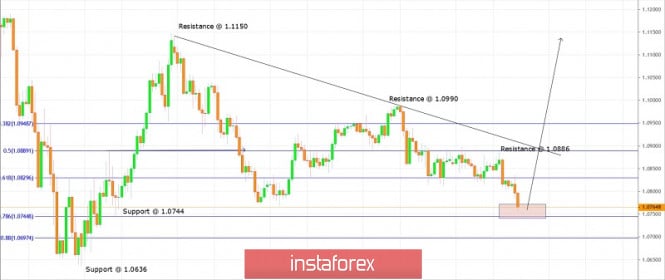
Technical outlook: EUR/USD drops below 1.0768 levels today and hits 1.0756 levels. The single currency pair is seen to be trading around 1.0765 levels at this point in writing and is expected to find support around 1.0745 levels before turning higher again. lease note that 1.0745 is also the fibonacci 0.786 retracement of the entire rally between 1.0636 and 1.1150 respectively. If EUR/USD drops below 1.0745 consistently, it could threaten 1.0636 lows as well. For now, the overall structure remains constructive until prices stay above 1.0636 levels and bulls would still be inclined to push towards 1.1500 levels going forward. Immediate support is at 1.0745, while interim resistance is seen towards 1.0886 levels respectively. A break above 1.0886 would be encouraging for bulls. Trading plan: Remain long stop at 1.0636, target is open. Good luck! The material has been provided by InstaForex Company - www.instaforex.com |
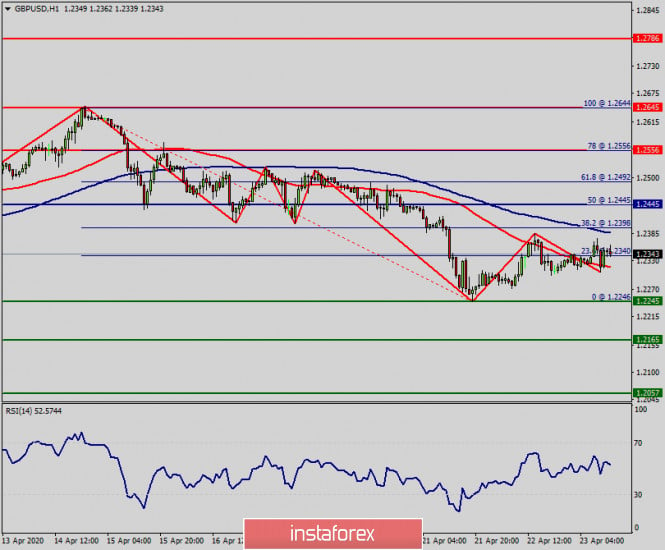
| Technical analysis of GBP/USD for April 23, 2020 Posted: 23 Apr 2020 03:38 AM PDT Overview: As expected the GBP/USD pair has kept moving downwards from the level of 1.2445. Yesterday, the pair dropped from the level of 1.2445 (this level of 1.2445 is coincided with the pivot point) to the bottom around 1.2245. Current price is set at the price of 1.2345. Today, the first resistance level is seen at 1.2445 followed by 1.2556, while daily support 1 is seen at 1.2245 . According to the previous events, the GBP/USD pair is still moving between the levels of 1.2445 and 1.2245; for that we expect a range of 200 pips (1.2245 - 1.2445). If the GBP/USD pair fails to break through the resistance level of 1.2445, the market will decline further to 1.2245. This would suggest a bearish market because the RSI indicator is still in a positive area and does not show any trend-reversal signs. The pair is expected to drop lower towards at least 1.2200 with a view to test the daily major support. On the contrary, if a breakout takes place at the resistance level of 1.2445 (pivot), then this scenario may become invalidated. The material has been provided by InstaForex Company - www.instaforex.com |
| EUR/USD: dollar remains first while the euro is nervous Posted: 23 Apr 2020 03:26 AM PDT Like a phoenix, the dollar is reborn from the ashes over and over again. It is hardly to be surprised at such metamorphoses, if US stock indices jump up or down instead of steadily rising. On the other hand, the quotes of WTI oil fell below zero for the first time in history, and investors look with apprehension at the weekly data on applications for unemployment benefits in the US. According to the forecast of experts recently surveyed by Reuters, the US economy may lose as many jobs in a month or so, as it created during the longest employment boom that started in September 2010 – about 26.2 million, or 16% of the total labor force. As a result, the exchange rate of the single European currency against the US dollar fell to almost four-week lows. The euro was pressured by data on consumer confidence in the Eurozone. Investors also adjusted their positions ahead of a meeting of EU officials on the Alliance's response to the economic turmoil caused by the coronavirus pandemic. According to preliminary estimates, the consumer confidence index in the eurozone in April declined to negative 22.7 points from negative 11.6 points in March. The rate of decline in monthly terms was the highest since the publication of the index in 1985. On the other hand, European leaders are due to discuss the region's economic recovery plan on Thursday, April 23. More than € 2 trillion is at stake. The approaches of the EU member states to the formation of sources of financing are different, so the discussion promises to be strong and long: some insist on issuing general bonds - corona bond, others prefer the creation of a special fund, and others talk about debt cancellation. At the same time, special attention should be paid to the rescue of "drowning people". The Italian government expects that the country's budget deficit will increase to 10% of GDP in 2020, the national economy will shrink by 8%, and the size of the national debt will grow from 135% to 150% of GDP. Italian Prime Minister Giuseppe Conte intends to ask the local parliament to expand the budget deficit by € 55 billion to finance a new package of measures to stimulate domestic demand after the outbreak of coronavirus. For these purposes, Italy will be forced to increase the issue of government bonds, however, given the potential lowering of the country's credit rating by S&P on April 24, the yield of local bonds is growing, it will be expensive to service the public debt. The ECB can throw a lifeline to Rome. The day before, the regulator announced a decision to accept some bonds with a" junk " rating as collateral for loans with the proviso that such securities had an investment rating level at least until April 7. The continued high demand for protective assets, concerns about disappointing data on US unemployment, shocking news from the oil market, as well as serious disagreements about the fiscal stimulus in the EU allowed the bears to push the EUR/USD pair below the level of 1.0800. The technical picture suggests that the pair retains the potential to continue the downward movement with the possibility of checking the strength level of 1.0700, and in case of breakdown, it can resume to the March lows in the region of 1.0636. The material has been provided by InstaForex Company - www.instaforex.com |
| Gold to reach $3,000 per ounce Posted: 23 Apr 2020 03:07 AM PDT
Experts are unanimous that the value of gold will increase as well as the interest of the investors and the need for a protective asset will reach unthinkable limits. Precious metals market strategists along with traders support these sentiments. Gold is almost the only asset that is not afraid of price fluctuations or global cataclysms. As a rule, the downturns in the precious metals market are temporary and the surges cause unprecedented enthusiasm. Currently, gold forecasts are optimistic despite the height of the COVID-19 pandemic. It is not surprising to know if the investors prefer yellow metal along with the dollar, since both are proven to be traditionally protective assets. In fact, analysts see that the price of the gold will exponentially rise amid the current crisis conditions. Experts recall that the dynamics of the price of gold depends on the exchange rate of the greenback. Gold and greenback have an inverse correlation, that is, if the greenback decreases, the cost of precious metals increases, and vice versa. However, the possible fall of the greenback is not enough to drown the gold, and the temporary collapse of its price will not violate the harmonious picture of moderate growth too much. Many experts are confident that gold is immune to any crisis. Currency strategists of the precious metals market are positive about its future prospects since, in the conditions of the spread of coronavirus, it will continue to remain a protective asset for investors. According to current forecasts, the precious metals market will receive support from geopolitical and fiscal decisions of government circles. Experts are sure that a possible price correction will not harm the gold. If it drops to $ 1,650 per ounce, this mark will remain a reliable level of support. At the beginning of the week, the spot price of gold was $ 1,678 per ounce, an increase of 11% since the beginning of this year. On Thursday, April 23, a key precious metal is trading in the range of $ 1751– $ 1752 per ounce, gradually gaining momentum. The current situation gives analysts a reason for optimism. Currency strategists at Bank of America revised their 18-month gold outlook to improve. Experts expect a gradual increase in the price of precious metals, where, in 2020 it will run at around $ 1,695 per ounce, in 2021 it will rise to $ 2,063, and in a year and a half will reach $ 3,000. The bank does not exclude explosive price increases at any stage. Bank of America recalls that gold has shown quite positive dynamics since the moment when the Federal Reserve changed its monetary policy in January of this year. The cause of the radical changes was due to the threat of the COVID-19 pandemic. The regulator had to lower rates to zero, introduce a limitless purchase of assets, and initiate ambitious plans to support the US economy. The Fed's aggressive moves jeopardized further dollar growth and triggered volatility in the precious metals market, but now key protective assets are on the way to equilibrium. According to analysts, the actual doubling of the balances of leading central banks and budget deficits in developed countries in order to mitigate the effects of the pandemic will help gold growth. According to Peter Grosskopf, managing director of investment company Sprott Inc., today the yellow metal is a unique financial tool to help survive the current crisis with the least loss. Investors have long begun to shift their capital to gold amid a planetary rampant coronavirus infection, and this step was the most correct. Now it remains to wait for the price of precious metals to rise to $ 3,000 and higher, in order to finally establish themselves in the correctness of such a choice, analysts summarize. The material has been provided by InstaForex Company - www.instaforex.com |
| You are subscribed to email updates from Forex analysis review. To stop receiving these emails, you may unsubscribe now. | Email delivery powered by Google |
| Google, 1600 Amphitheatre Parkway, Mountain View, CA 94043, United States | |






No comments:
Post a Comment