Forex analysis review |
- EUR/GBP approaching resistance, potential drop!
- NZD/USD approaching a major support!
- USD/JPY near key support, a bounce is possible!
- Fractal analysis of major currency pairs for May 24
- GBP / USD h4. Options for the development of the movement from May 24, 2019 Analysis of APLs & ZUP
- EUR / USD h4. Options for the development of the movement from May 24, 2019 Analysis of APLs & ZUP
- EURUSD: the eurozone economy will slow down in the 2nd quarter of this year due to the manufacturing sector
- EUR/USD: attack on the 10th figure ended in failure
- GBP/USD. May 23rd. Results of the day. While Theresa May prepares for her resignation, another deputy leaves Parliament
- EUR/USD. May 23rd. Results of the day. Eurozone business activity indexes expectedly failed
- Bitcoin analysis for May, 23.2019
- GBP/USD analysis for May, 23.05.2019
- Bullish reversal candlestick pattern in the 4 hour chart of EURUSD
- Analysis of Gold for May, 23.2019
- Technical analysis for Gold for May 23, 2019
- May 23, 2019 : EUR/USD Intraday technical analysis and trade recommendations.
- May 23, 2019 : GBP/USD Intraday technical analysis and trade recommendations.
- Total trade war can collapse most currencies
- Technical analysis of USD/CHF for May 23, 2019
- Technical analysis of USD/CAD for May 23, 2019
- Euro will fall and there is no reason for optimism at all
- GBP/USD: plan for the US session on May 23. The pound updated its monthly lows but held above 1.2612
- EUR/USD: plan for the US session on May 23. Weak reports on the eurozone allowed to break through the level of 1.1143
- Elections to the European Parliament and the possible resignation of Theresa May
- The dollar has reached a monthly high and is preparing to take a new height
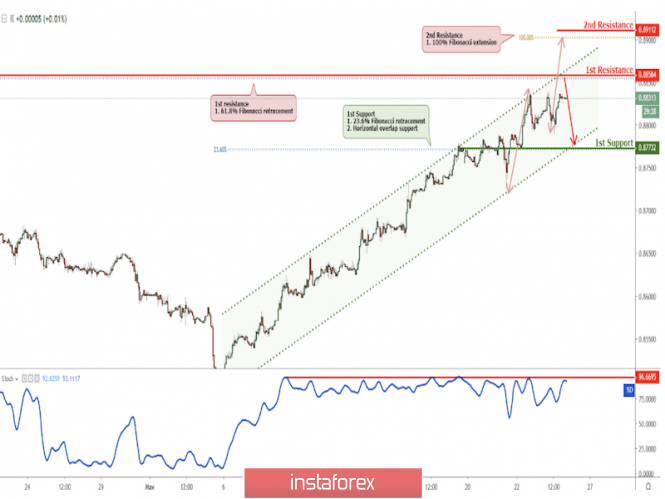
| EUR/GBP approaching resistance, potential drop! Posted: 23 May 2019 07:46 PM PDT
Price is approaching our first resistance level. Entry : 0.8858 Why it's good : 61.8% Fibonacci retracement, ascending channel's resistance Stop Loss : 0.8911 Why it's good : 100% Fibonacci extension Take Profit : 0.8773 Why it's good : 23.6% Fibonacci retracement, horizontal overlap support
|
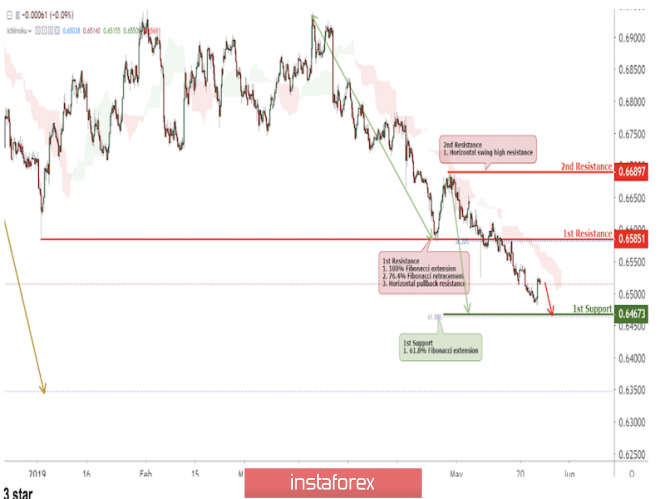
| NZD/USD approaching a major support! Posted: 23 May 2019 07:43 PM PDT
Price is in a downtrend where it is expected that it will continue falling to approach its major support at 0.6467. Entry : 0.6585 Why it's good : horizontal swing high resistance, 38.2% Fibonacci retracement Stop Loss : 0.6689 Why it's good : 61.8% Fibonacci extension, 61.8% Fibonacci retracement Take Profit : 0.6467 Why it's good : 61.8% Fibonacci extension
|
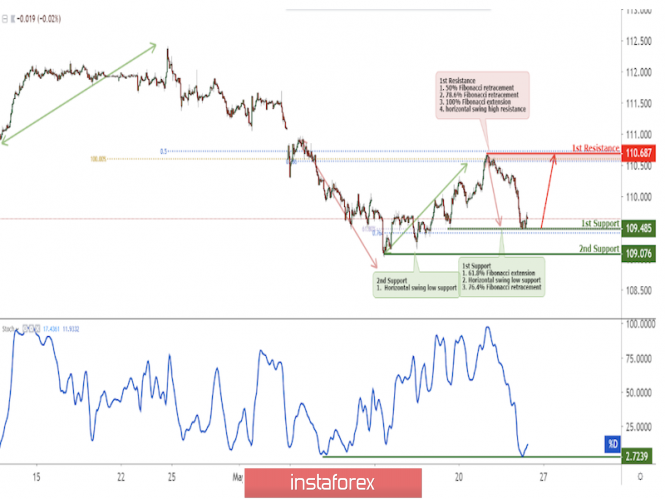
| USD/JPY near key support, a bounce is possible! Posted: 23 May 2019 07:40 PM PDT
USDJPY near key support, a bounce to first resistance is possible Entry: 109.49 Why it's good : 61.8% Fibonacci extension, 76.4% Fibonacci retracement, horizontal swing low support Stop Loss : 109.08 Why it's good :horizontal swing low support Take Profit : 110.69 Why it's good: 100% Fibonacci extension, horizontal swing high resistance. 78.6% &50% Fibonacci retracement
|
| Fractal analysis of major currency pairs for May 24 Posted: 23 May 2019 07:08 PM PDT Forecast for May 24: Analytical review of H1-scale currency pairs: For the euro / dollar pair, the key levels on the H1 scale are: 1.1269, 1.1248, 1.1217, 1.1206, 1.1191, 1.1167, 1.1154 and 1.1136. Here, the price forms the potential initial conditions for the upward movement of May 23. Continuation of the movement to the top,is expected after the breakdown at 1.1191. In this case, the goal is 1.1206. Consolidation is near this level. The price passage of the noise range 1.1206 - 1.1217 must be accompanied by a pronounced upward movement. In this case, the target is 1.1248. The potential value for the top is considered at the level of 1.1269. After which, we expect a rollback to the bottom. Short-term downward movement is possible in the range 1.1167 - 1.1154. The breakdown of the latter value will lead to a prolonged correction. Here, the target is 1.1136. This level is a key support to the top. The main trend is the formation of initial conditions for the top of May 23. Trading recommendations: Buy 1.1191 Take profit: 1.1206 Buy 1.1218 Take profit: 1.1246 Sell: 1.1167 Take profit: 1.1155 Sell: 1.1153 Take profit: 1.1136 For the pound / dollar pair, the key levels on the H1 scale are: 1.2811, 1.2737, 1.2693, 1.2612, 1.2553, 1.2478 and 1.2428. Here, we continue to monitor the local structure of May 21. Continuation of the movement to the bottom is expected after the breakdown at 1.2612. Here, the target is -1.2553. The breakdown of which must be accompanied by a pronounced downward movement. In this case, the target is 1.2478. We consider the level of 1.2428 as a potential value at the bottom. Upon reaching this level, we expect consolidation in the corridor 1.2478 - 1.2428, as well as a departure to a correction. Short-term upward movement is possible in the corridor 1.2693 - 1.2737. The breakdown of the latter value will have to form an upward movement. Here, the target is 1.2811. The main trend is a local downward structure of May 21. Trading recommendations: Buy: 1.2693 Take profit: 1.2735 Buy: 1.2738 Take profit: 1.2810 Sell: 1.2612 Take profit: 1.2555 Sell: 1.2550 Take profit: 1.2478 For the dollar / frank pair, the key levels on the H1 scale are: 1.0086, 1.0062, 1.0045, 1.0023, 1.0010, 0.9991 and 0.9978. Here, we are following the formation of the downward structure of May 22. Continuation of the movement to the bottom is expected after the price passes the noise range 1.0023 - 1.0010. In this case, the target is 0.9991. The potential value for the bottom is at the level of 0.9978. After reaching which, we expect a consolidation. Short-term upward movement is possible in the corridor 1.0045 - 1.0062. Breaking the last value will lead to a prolonged correction. Here, the goal is 1.0086. This level is a key support for the downward structure. The main trend - the development of the downward structure of May 22, we expect the registration of large initial conditions. Trading recommendations: Buy : 1.0045 Take profit: 1.0060 Buy : 1.0062 Take profit: 1.0086 Sell: 1.0010 Take profit: 0.9991 Sell: 0.9990 Take profit: 0.9978 For the dollar / yen pair, the key levels on the scale are : 110.21, 109.94, 109.73, 109.36, 109.14, 108.98 and 108.51. Here, the price forms the medium-term initial conditions for the downward cycle of May 21. Continuation of the movement to the bottom is expected at level 109.36 after the breakdown. In this case, the goal is 109.14. Consolidation is near this level. The price pass of the noise range of 109.14 - 108.98 should be accompanied by a pronounced downward movement. Here, the goal is 108.51. Near this level, we expect consolidation and possible rollback to the correction. Short-term upward movement is possible in the corridor 109.73 - 109.94. The breakdown of the latter value will lead to in-depth correction. Here, the goal is 110.21. This level is the key support for the downward cycle. The main trend: the formation of medium-term initial conditions for the downward cycle of May 21. Trading recommendations: Buy: 109.73 Take profit: 109.92 Buy: 109.95 Take profit: 110.20 Sell: 109.36 Take profit: 109.15 Sell: 108.98 Take profit: 108.51 For the Canadian dollar / US dollar pair, the key levels on the H1 scale are: 1.3611, 1.3556, 1.3534, 1.3403, 1.3464, 1.3444 and 1.3409. Here, the price forms the medium-term initial conditions for the upward cycle of May 22. Continuation of the development of this structure is expected after the breakdown of 1.3503. In this case, the goal is 1.3534. Consolidation is near this level. The price passage of the noise range 1.3534 - 1.3556 should be accompanied by a pronounced upward movement. Here, the potential target is 1.3611. Short-term downward movement is possible in the corridor 1.3464 - 1.3444. The breakdown of the latter value will lead to a prolonged correction. Here, the goal is 1.3409. This level is a key support for the top. The main trend is the formation of medium-term initial conditions for the upward cycle of May 22. Trading recommendations: Buy: 1.3503 Take profit: 1.3534 Buy : 1.3556 Take profit: 1.3610 Sell: 1.3464 Take profit: 1.3445 Sell: 1.3442 Take profit: 1.3412 For the Australian dollar / US dollar pair, the key levels on the H1 scale are : 0.6932, 0.6917, 0.6901, 0.6891, 0.6861, 0.6848, 0.6838, 0.6813 and 0.6795. Here, we continue to monitor the formation of local initial conditions for the downward movement of May 20. Continuation of the movement to the bottom is expected after the breakdown of 0.6861. Here, the target is 0.6848. Consolidation is near this level. Passing through the noise range 0.6848 - 0.6838 will lead to the development of a pronounced movement. In this case, the target is 0.6813. For potential value at the bottom, the level of 0.6795 is considered. After reaching which, we expect a rollback to the top. Short-term upward movement, perhaps, is in the range of 0.6891 - 0.6901. The breakdown of the latter value will lead to a prolonged movement. Here, the goal is 0.6917. This level is a key support for the downward structure. The main trend is the formation of a local descending structure of May 20. Trading recommendations: Buy: 0.6891 Take profit: 0.6900 Buy: 0.6903 Take profit: 0.6916 Sell : 0.6860 Take profit : 0.6848 Sell: 0.6838 Take profit: 0.6815 For the euro / yen pair, the key levels on the H1 scale are: 123.29, 122.92, 122.72, 122.12, 121.76, 121.54 and 120.96. Here, the price forms the expressed initial conditions for the downward cycle of May 21. Continuation of the movement to the bottom is expected after the breakdown of 122.12. In this case, the goal is 121.76. Consolidation is near this level. Short-term downward movement is in the corridor 121.76 - 121.54. The breakdown of the last value will allow to count on the movement towards a potential target - 120.96. From this level, we expect a rollback to the top. Short-term upward movement is possible in the corridor 122.72 - 122.92. The breakdown of the latter value will lead to a prolonged correction. Here, the goal is 123.29. This level is a key support for the downward structure. The main trend is the formation of medium-term initial conditions for the downward cycle of May 21. Trading recommendations: Buy: 122.72 Take profit: 122.90 Buy: 122.93 Take profit: 123.25 Sell: 122.12 Take profit: 121.78 Sell: 121.74 Take profit: 121.55 For the pound / yen pair, the key levels on the H1 scale are : 140.18, 139.51, 139.14, 138.70, 138.36, 137.49 and 136.85. Here, we are following the development of the downward structure of May 21. Continuation of the movement to the bottom is expected after the passage of the price of the noise range 138.70 - 138.36. In this case, the goal is 137.49. Consolidation is near this level. Potential value for the bottom is considered at the level of 136.85. After reaching which, we expect to go into a correction. Short-term upward movement is possible in the corridor 139.14 - 139.51. The breakdown of the latter value will lead to a prolonged correction. Here, the goal is 140.18. This level is a key support for the downward structure. The main trend is a local downward structure of May 21. Trading recommendations: Buy: 139.15 Take profit: 139.50 Buy: 139.55 Take profit: 140.10 Sell: 138.34 Take profit: 135.55 Sell: 137.46 Take profit: 136.90 The material has been provided by InstaForex Company - www.instaforex.com |
| Posted: 23 May 2019 07:07 PM PDT Minuette (h4) Great Britain Pound vs US Dollar ____________________ From May 24, 2019, the movement of the currency GBP/USD with a sufficient degree of probability, will continue in the equilibrium zone (1.2630 <-> 1.2710 <-> 1.2795) Minuette operational scale fork. The marking of the movement options within the equilibrium zone of the Minuette operational scale fork is shown in the animation graphics. ____________________ The prospect of the development of the upward movement (buy) The breakdown of the level of resistance of 1.2795 (upper boundary of the ISL38.2 equilibrium zone of the Minuette operational scale fork) -> The option of continuing the upward movement of GBP / USD to the upper boundary of the 1/2 Median Line Minuette channel (1.2815) and the equilibrium zone (1.2840 <-> 1.2915 <-> 1.2985) Minuette operating scale fork. Details are shown in the animated graphics. ____________________ The prospect of the development of the downward movement (sell) The breakdown of the level of support 1.2630 (lower boundary of ISL61.8 equilibrium zone of the Minuette operational scale fork) followed by updating the minimum 1.2607 and the breakdown of the control line LTL (1.2595) of the Minuette operational scale fork will make the development of the downward movement of the GBP / USD to the final FSL Minuette (1.2340). Details are shown in the animated graphics. ____________________ The review was compiled without taking into account the news background, the opening of trading sessions of the main financial centers and is also not a guide to action (placing orders "sell" or "buy"). |
| Posted: 23 May 2019 07:07 PM PDT Minuette (h4) Euro vs US Dollar ____________________ The development of the movement of the single European currency EUR / USD from May 24, 2019 will be determined by the direction of the range breakdown : -> resistance level of 1.1160 (lower boundary of the 1/2 Median Line channel Minuette); -> support level of 1.1140 (upper boundary of the 1/2 Median Line channel Minuette). ____________________ The prospects for the development of the upward movement (buy) The breakdown of the level of resistance of 1.1160 -> the development of traffic EUR / USD will continue within the boundaries of the channel of the Median Line 1/2 (1.1160 <-> 1.1178 <-> 1.1195) and the equilibrium zone (1.1185 <-> 1.1212 <-> 1.1235) Minuette operational scale fork with the prospect of achieving the lower boundary of ISL38.2 (1.1255) Minuette operational scale. Details are shown in the animated graphics. ____________________ The prospects for the development of the downward movement (sell) The breakdown of the level of support of 1.1140 -> movement of the single European currency will continue in the 1/2 Median Line channel (1.1140 <-> 1.1120 <-> 1.1090) of the Minuette operating scale with the possibility of reaching the warning line LWL100.0 Minuette (1.1045). Details are shown in the animated graphics. ____________________ The review was compiled without taking into account the news background, the opening of the trading session of the main financial centers, and is not a guide to action (placing orders "sell" or "buy"). |
| Posted: 23 May 2019 04:21 PM PDT The euro continued to decline in the morning after the publication of the minutes of the ECB meeting held on April 9-10. In them, the leadership of the central bank expressed concern about weak inflation and a sharp slowdown in the manufacturing sector, which we will discuss below. ECB leaders also warned that the eurozone economy may not recover as expected in the second half of 2019, and also called for an analysis of the impact of negative interest rates on banks' profitability. Until recently, problems with negative interest rates in the euro area did not arise. As I noted above, the problems in the industrial area of the eurozone are quite serious. According to today's data, the preliminary PMI Purchasing Managers Index for the manufacturing sector in Germany fell even more to 44.3 points in May against 44.4 points in April. Economists expected a slight increase to the level of 44.7 points. Things are much better for the service sector. The report indicates that the preliminary PMI Purchasing Managers Index for Germany's service sector was 55.0 points in May, while it was projected at 55.5 points. Back in April, the above index reached 55.7 points. As for the general composite index of purchasing managers in Germany, it was at the level of 52.4 points in May. France's manufacturing sector is also on the verge of a slowdown. Thus, the preliminary PMI purchasing managers' index for the manufacturing sector in France came in at 50.6 points in May compared to 50 points in April. As for the general indicators for the eurozone, it is clear that the economy slows down after recovering at the beginning of the year. Export problems that extend to industry indicate weak growth in the 2nd quarter of this year. According to the research company IHS Markit, the composite index of PMI purchasing managers in the eurozone in May 2019 rose to 51.6 points from 51.5 points in April. Let me remind you that the indicator values above 50 indicate an increase in activity. In IHS Markit noted that, despite the growth of the indicator, the growth rate in the second quarter will be lower than in the first. Thus, the preliminary PMI Purchasing Managers Index for the manufacturing sector in the eurozone fell to 47.7 points in May, while in April it was 47.9 points. Economists had expected growth to 48.1 points. German data did not strongly support the euro in the morning. According to the report of the Federal Bureau of Statistics of Germany, Germany's GDP in the 1st quarter of 2019 increased by 0.4% compared with the previous quarter, or 1.7% year on year. Private consumption provided good support, which increased by 1.2% in the first quarter of 2019 compared to the previous quarter. The pace of investment accelerated by 1.9%. But the mood of companies in Germany in May deteriorated due to lower assessments of business conditions. According to the Ifo Institute, the business climate index in Germany in May dropped to 97.9 points from 99.2 points in April, while economists had expected the index to be 99.1 points in May. As for the technical picture of the EURUSD pair, the breakthrough of support for 1.1140, which took place during the European session, provides bears with further movement to the area of lows of 1.1110 and 1.1070. The material has been provided by InstaForex Company - www.instaforex.com |
| EUR/USD: attack on the 10th figure ended in failure Posted: 23 May 2019 03:44 PM PDT The bearish sentiment on the euro-dollar pair today unexpectedly gave way to the bulls after an unsuccessful attempt to storm the 10th figure. Apparently, buyers have not lost hope for a radical change in the situation. The market actually ignored the minutes of the last Fed meeting. Traders did not see anything new there, and many voiced theses were outdated. The members of the regulator reiterated that they were ready to continue to take a patient position regarding the prospects for interest rates, however, they did not say a word about a possible easing of monetary policy. Fed officials expectedly expressed concern about the weak growth of inflation indicators, thereby offsetting Jerome Powell's optimism, who at the final press conference described the slowdown of inflation as a "temporary phenomenon". The majority of Fed members in this part do not agree with their "boss" - in their opinion, this is a stable trend. But this fact has not weakened the position of the US currency. First, inflation data was published after this meeting and it somewhat eased concerns regarding this. Inflation, though not showing its rise, but at the same time slowed the decline. Secondly, the overwhelming majority of the members of the regulator spoke and are in favor of keeping the interest rate at the current level. Moreover, according to the Fed, the rate should remain at the current level even with improved economic conditions. This position was confirmed by Jerome Powell himself during his speech at the Atlanta Federal Reserve Bank. Thirdly, the published Fed minutes does not reflect the current situation in the financial world, since the May meeting was held even before relations between Beijing and Washington once again deteriorated. The minutes of the last meeting of the ECB, published today, also did not support the European currency. The regulator acknowledged that recently published macroeconomic data turned out to be weaker than forecasts, whereas inflation stays "well below the target level". In view of these circumstances, the members of the ECB are no longer so sure that the eurozone economy will recover in the second half of this year, although the key indicators (for the time being) correspond to the baseline scenario. It was also stated in the minutes that the conditions of the TLTRO program will be determined "at one of the upcoming meetings" (according to a number of analysts, in September). In addition, the regulator drew attention to the time that since the end of last year it records a significant decrease in lending volumes. According to members of the central bank, this corresponds to a slowdown in economic growth. In general, the minutes of the May meeting reflected the cautious position of the European regulator's members - but the traders did not see anything new in it. Almost all the theses mentioned there have already been voiced by either Draghi or other members of the ECB. Macroeconomic releases also play a minor role, although today's reports from the IFO strengthened the downward dynamics of EUR/USD, as they turned out to be worse than expected (as did the composite PMI index). But this factor served only as an additional touch to the overall fundamental picture, which so far does not add up in favor of the single currency. In other words, the single currency does not have any arguments for its own growth, so in the EUR/USD pair it has to follow the dollar. Today, the greenback attempted a downward assault, impulsively dropping by almost 50 points. Although the pair could not enter the area of the 10th figure, the price has updated its multi-year (from 2017) low. The blitzkrieg did not succeed: just a few minutes after the fall, the pair started to redeem itself, after which the price returned to the level of today's opening, and then updated its high. It should be noted that such a price spurt was not due to any particular fundamental factor. Traders argue about what served as a catalyst for such a sharp price drop. According to some experts, the situation with Brexit is weighing on the pair, given the increasing rumors about the resignation of May and the subsequent coming to power of Johnson. Other analysts blame China. China's President Xi Jinping recently hinted quite clearly that he could use China's dominance in the world market for rare-earth metals as a weapon in the trade war with the United States. Experts believe that the embargo on rare-earth metals from China is one of the most powerful trumps of the Chinese in the trade conflict with America. According to them, these metals are contained in almost every telephone, car, plane and so on. The lack of a steady supply of rare earth metals will inevitably disrupt the entire supply chain of American technology companies, including in the defense industry. Although the United States have their own rare earth reserves, Americans will need time to cover the necessary demand. Whether China will use such a powerful trump card or not is an open question. So far, Xi Jinping only hinted at this step: in the midst of the situation with Huawei, he unexpectedly visited the enterprise for the production of rare earth metals. A fairly transparent hint in the world of big politics. By and large, it does not matter whether Brexit was to blame for the dollar's temporary strengthening or China. The main conclusion of today's price fluctuations is that the EUR/USD bears are not capable of taking the 10th figure by storm. With a decline to the critical levels, the pair are bought back and the prices are driven up, despite the ambiguous fundamental background. The support level of 1.1120 (the bottom line of the Bollinger Bands indicator on the daily chart) is so far a reliable price outpost. If today, bulls of the pair conduct a counterattack and overcome 1.1185 (the middle line of the Bollinger Bands), they can count on further conquering the 12th figure. Otherwise, the bears will eventually make a similar attempt at a downward assault. The material has been provided by InstaForex Company - www.instaforex.com |
| Posted: 23 May 2019 03:30 PM PDT 4-hour timeframe The amplitude of the last 5 days (high-low): 64p - 86p - 42p - 129p - 95p. Average amplitude for the last 5 days: 83p (84p). If the European currency received a new portion of the negative in the form of weak macroeconomic reports from the European Union, the British pound was deprived of a point of negativity on Thursday, May 23. But the pound sterling has a huge negative fundamental background, which serves as the basis for traders to continue to getting rid of the British currency for almost three weeks without a single correction. Meanwhile, there is a new resignation in the British Parliament. This time, the leader of the House of Commons, Andrea Leeds, said that she no longer believes in the government's approach to Brexit and is leaving her post. Thus, the total number of politicians who left their posts due to Brexit has exceeded 20. Tomorrow, according to many experts, Theresa May herself can complete this list of resignations, who has completely lost the support of the government. In addition, the party organizer of the Conservative party, Mark Spencer said that for the week of June 3-7, the agenda in the House of Commons does not include voting for the "deal" on Brexit. Although previously Theresa May personally stated that the fourth vote will be held on June 3. It seems that the prime minister's plans were completely spoiled. It is not surprising that the pound sterling continues to fall down, losing 50-70 points every day. Needless to say once again, the bears continue to completely outplay the bulls. More precisely, the bulls do not even enter into this game, since there is no reason to buy the British pound right now. The market is completely unambiguous in its trading strategy. From our point of view, Theresa May's resignation is the only thing that could change the pound sterling's deplorable situation. Trading recommendations: The pound/dollar currency pair continues its downward movement. Therefore, now it is recommended to consider selling the pound sterling with targets support levels of 1,2604 and 1,2558 before the upward reversal of the MACD indicator. Buy orders could be considered in small lots only when the price has consolidated above the Kijun-sen line with the first target Senkou span B line. The mood of the GBP/USD currency pair remains frankly bearish. In addition to the technical picture also take into account the fundamental data and the time of their release. Explanation of the illustration: Ichimoku indicator: Tenkan-sen - the red line. Kijun-sen - the blue line. Senkou Span A - light brown dotted line. Senkou Span B - light purple dotted line. Chikou Span - green line. Bollinger Bands indicator: 3 yellow lines. MACD Indicator: Red line and histogram with white bars in the indicator window. The material has been provided by InstaForex Company - www.instaforex.com |
| EUR/USD. May 23rd. Results of the day. Eurozone business activity indexes expectedly failed Posted: 23 May 2019 03:16 PM PDT 4-hour timeframe The amplitude of the last 5 days (high-low): 58p - 29p - 24p - 46p - 31p. Average amplitude for the last 5 days: 38p (41p). On the penultimate trading day of the week, the euro/dollar pair resumed to decline and has already completed the first support level of 1.1120 and came close, as we expected, to the lows of April 26. In the morning we noted that, despite the preliminary values of business activity indexes in the services and production sectors of the eurozone, the market reaction to them will follow, because now all three values are close to the key level 50, above which the positive trend persists, below - the negative begins. The index of business activity in the manufacturing sector has already slipped below the level of 50, and today it has become known that this indicator turned out to be worse than the forecast and the previous value (47.7). This indicates a downward turn in the industry, which is another drawback to the collection of all the problems of the eurozone. This is another answer to the question as to why the US dollar continues to grow. Because traders, big players, analyze the economic situations of the US and the EU and do not see anything optimistic about the eurozone. Therefore, the demand for the US dollar remains stable, and traders are trying to get rid of the euro. Euro purchases are rare and short-term. A little later in the US, there will be a similar release of that of the European business activity indices, and if they turn out to be better than market expectations, the bears will raise the pressure on the pair and the euro currency. The technical picture for the EUR/USD pair is now almost unequivocal. All indicators are pointing down, all the turns of the correction ended exactly around the critical line. Thus, the initiative for the pair remains in the hands of bears. Trading recommendations: The EUR/USD pair resumed its downward movement. Thus, now it is recommended to continue to follow the trend, that is, to sell the euro in order to support the level of 1.1083. It is advised that you return to buying once traders manage to overcome the Kijun-sen line. In this case, the first target for buying the currency pair will be the upper boundary of the Ichimoku cloud. In addition to the technical picture also take into account the fundamental data and the time of their release. Explanation of the illustration: Ichimoku indicator: Tenkan-sen - the red line. Kijun-sen - the blue line. Senkou Span A - light brown dotted line. Senkou Span B - light purple dotted line. Chikou Span - green line. Bollinger Bands indicator: 3 yellow lines. MACD Indicator: Red line and histogram with white bars in the indicator window. The material has been provided by InstaForex Company - www.instaforex.com |
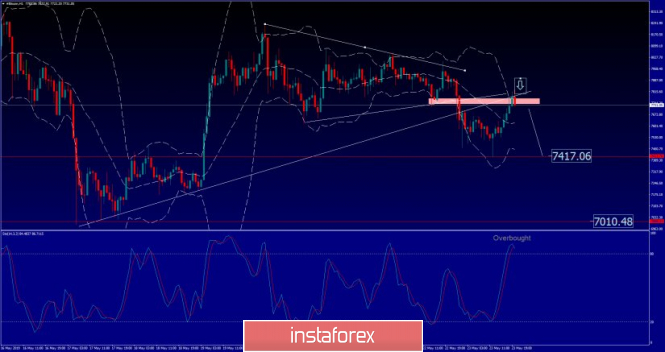
| Bitcoin analysis for May, 23.2019 Posted: 23 May 2019 10:45 AM PDT BTC price has has been trading downside as we expected. BTC tested and rejection of the $7.417. Anyway, we still expecting more downside on the BTC.
Red horizontal line - horizontal support Red Horizontal line 2 – horizontal support Red rectangle – Resistance cluster Breakout of symmetrical triangle in the background was the key for the sellers and today BTC is testing the lower diagonal of the triangle. Strong resistance is set at $7.745 and it is good place for short positions. Downward references are set at $7.417 and $7.010. Additionally, we found overbought condition on the Stochastic oscillator. Watch for selling opportunities with the first target at $7.417. The material has been provided by InstaForex Company - www.instaforex.com |
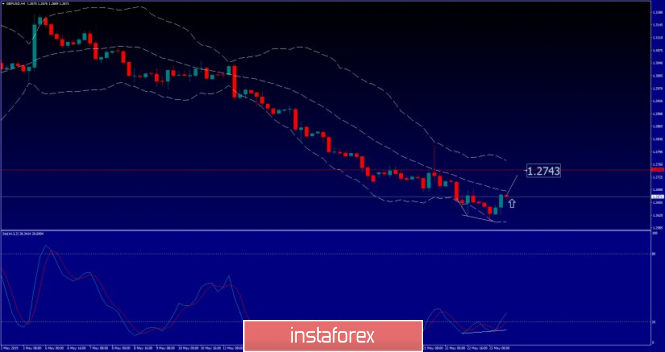
| GBP/USD analysis for May, 23.05.2019 Posted: 23 May 2019 10:36 AM PDT GBP/USD price has has been trading upside as we expected. The GBP tested the level of 1.2670. We are still expecting more upside on the GBP.
Red horizontal line - horizontal resistance White line- Bullish divergence line The bullish divergence on the H4 time-frame did set the tone for the day. The price is now testing the medium Bollinger band at 1.2675. Our advice is to watch for potential breakout of the medium Bollinger to confirm further upward movement. Watch for potential test of 1.2743. Key support is set at the price of 1.2605. The material has been provided by InstaForex Company - www.instaforex.com |
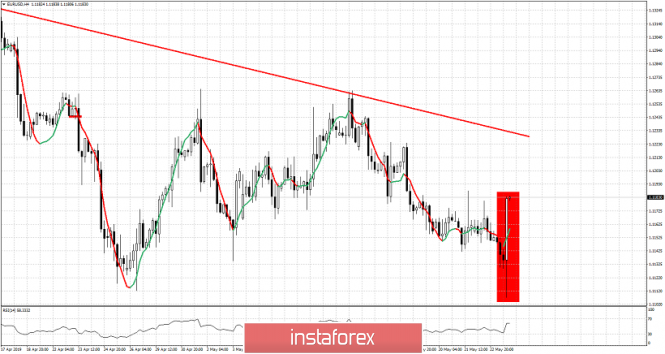
| Bullish reversal candlestick pattern in the 4 hour chart of EURUSD Posted: 23 May 2019 10:27 AM PDT EURUSD has been trading weak all morning breaking below 1.1150 support and reaching 1.11 as expected. In previous posts continued to note that trend remains bearish as long as price is below 1.1230-1.1260 but there were significant bullish divergence signs by the RSI. EURUSD has now made a 180degree turn with a 4 hour candle looking very bullish.
Red rectangle - reversal candlestick EURUSD has made a low at 1.1107 and closed the 4hour candlestick at 1.1182. Price remains below resistance still but traders should not ignore this long bullish reversal candle pattern. Short-term resistance is where the top of the candle is and recent highs where selling pressures started and lead to the decline to 1.11. Breaking above this level will open the way for a move towards the red resistance trend line at 1.1230. Trend will change to bullish if price breaks above 1.1230-1.1260. Until then bulls need to be cautious. Yes this is an important sign for the bullish scenario but we need to see follow through. Without any follow through this reversal pattern has no meaning. The material has been provided by InstaForex Company - www.instaforex.com |
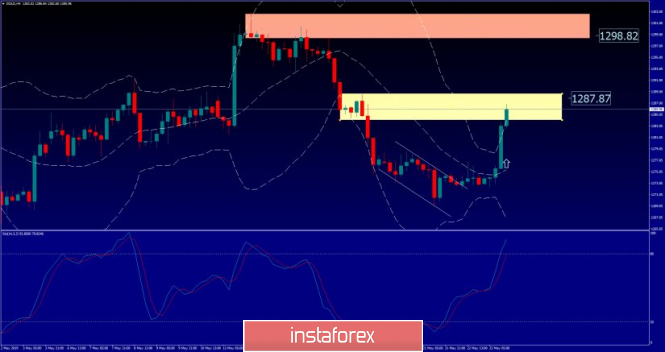
| Analysis of Gold for May, 23.2019 Posted: 23 May 2019 10:24 AM PDT Gold price has has been trading upside as we expected. The Gold tested the level of $1.287. We are still expecting more upside on the Gold.
Yellow rectangle - horizontal resistance Orange rectangle- horizontal resistance 2 Gold has been trading upside and our first target from yesterday at $1.287 is on the test. The momentum is upside and it is very risky for selling. We expect potential test of the second resistance at $1.298. Stochastic oscillator is looking stron as well, which adds more upside potential. Watch for buying opportunities. The material has been provided by InstaForex Company - www.instaforex.com |
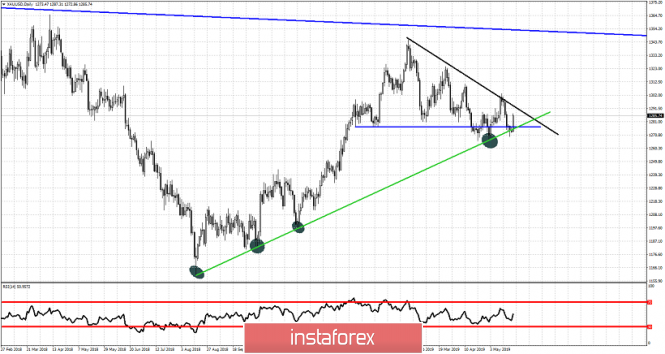
| Technical analysis for Gold for May 23, 2019 Posted: 23 May 2019 10:20 AM PDT Gold price was breaking below important support of $1,276 and was about to test $1,266 low. Price reversed and we are now looking at another try from bulls to change the trend. Resistance is still formidable at $1,300-$1,290 area so bears are still alive.
Green line - major support trend line Blue neckline -horizontal support Gold price although marginally broke below the green trend line support it is now well back above it challenging the black downward sloping trend line resistance. Gold price has recaptured the blue neckline and the green trend line. These are important wins for bulls but still not game over for bears. Bulls will need to break above $1,294 and of course recapture $1,300 in order to regain control of the trend and hope for a move to $1,350. As long as price remains below $1,300 bears have the upper hand. The material has been provided by InstaForex Company - www.instaforex.com |
| May 23, 2019 : EUR/USD Intraday technical analysis and trade recommendations. Posted: 23 May 2019 08:46 AM PDT
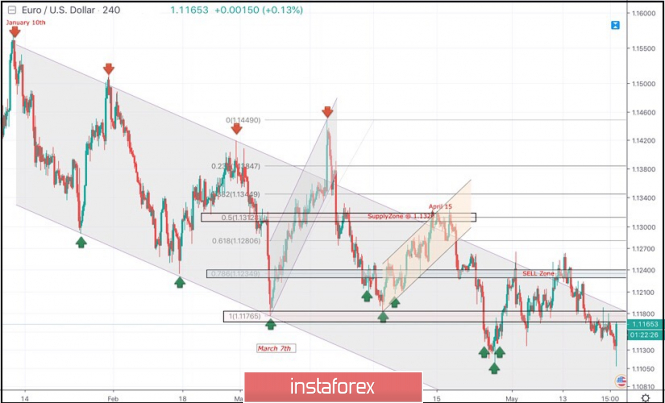
On January 10th, the market initiated the depicted bearish channel around 1.1570. Since then, the EURUSD pair has been moving within the depicted channel with slight bearish tendency. Few weeks ago, a bullish Head and Shoulders reversal pattern was demonstrated around 1.1200. This enhanced further bullish advancement towards 1.1300-1.1315 (supply zone) where significant bearish rejection was demonstrated on April 15. Short-term outlook turned to become bearish towards 1.1235 (78.6% Fibonacci) then 1.1175 (100% Fibonacci level). For Intraday traders, the price zone around 1.1235 (78.6% Fibonacci) stood as a temporary demand area which paused the ongoing bearish momentum for a while before bearish breakdown could be executed on April 23. On May 13, another bullish pullback was executed towards the mentioned price zone (1.1230-1.1250) where the current bearish movement was initiated. Recently, the EURUSD pair has been trapped above the next key-zone (1.1175) until last Friday when a bearish breakout below 1.1175 was achieved. Hence, further bearish decline should be expected towards 1.1115 provided that the price level of 1.1190 remains defended by the EURUSD bears. Trade recommendations : Conservative traders who were advised to have a SELL entry around the supply zone (1.1235-1.1250) should lower their S/L towards 1.1190 to secure more profits. Remaining Target level should be projected towards 1.1115. Intraday traders can watch for a counter-trend BUY entry upon bullish breakout above 1.1180. T/P level to be located around 1.1240. The material has been provided by InstaForex Company - www.instaforex.com |
| May 23, 2019 : GBP/USD Intraday technical analysis and trade recommendations. Posted: 23 May 2019 08:33 AM PDT
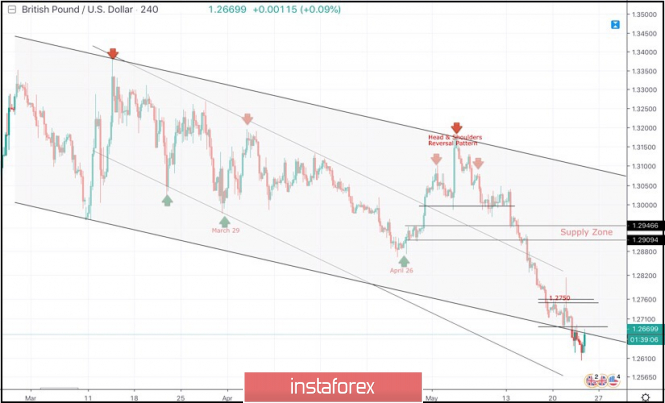
On March 29, a visit towards the price levels of 1.2980 (the lower limit of the newly-established bearish movement channel) could bring the GBPUSD pair again towards the upper limit of the minor bearish channel around (1.3160-1.3180). Since then, Short-term outlook has turned into bearish with intermediate-term bearish targets projected towards 1.2900 and 1.2850. On April 26, another bullish pullback was initiated towards 1.3000 (the same bottom of March 29) which has been breached to the upside until May 13 when a bearish Head and Shoulders pattern was demonstrated on the H4 chart with neckline located around 1.2980-1.3020. That's why, the price zone of 1.3000-1.3020 turned to become a prominent supply-zone where a valid bearish entry was offered few weeks ago. Bearish persistence below 1.2980 (Neckline of the reversal pattern) enhanced further bearish decline. Initial bearish Targets were already reached around 1.2900-1.2870 (the backside of the broken channel) which failed to provide any bullish support for the pair. Further bearish decline was demonstrated towards the lower limit of the long-term channel around (1.2700-1.2650). The GBPUSD pair looks oversold around the current price levels (1.2650-1.2700). That's why, SELL signals shouldn't be considered at such low prices. On the other hand, bullish persistence above 1.2690 and 1.2750 is needed to enhance the bullish side of the market on the short-term. Trade Recommendations: Conservative traders should wait for another bullish pullback towards 1.2870-1.2905 (newly-established supply zone) to look for valid sell entries. S/L should be placed above 1.2950. Counter-trend traders can wait for a bullish breakout above 1.2690-1.2700 as a BUY signal. T/P level to be located around 1.2750 and 1.2820. The material has been provided by InstaForex Company - www.instaforex.com |
| Total trade war can collapse most currencies Posted: 23 May 2019 06:34 AM PDT The threat of an escalation of the US and Celestial trade war triumphed the greenback and hit primarily on the positions of the currencies of developing countries. Based on the reports of Bloomberg, the salvo released by Donald Trump on May 10 for Chinese imports in the amount of $200 billion helped the US currency strengthen and caused damage to EM assets - from Taiwan and the Republic of South Africa to Brazil. According to Salman Ahmed of Lombard Odier Investment Managers, "The currencies of developing countries are most vulnerable to the escalation of the trade war of the two largest economies in the world. A quick solution to the problem is hardly worth the wait". As tensions increase in trade relations between Washington and Beijing, traders are trying to understand whether developing countries are able to overcome the problems that caused the exchange rates of national currencies to rise and fall in the US dollar, or at least be able to withstand the strengthening of the American currency. In turn, they could take advantage of the interest rate and higher returns. JPMorgan Chase strategists doubt this. Last week, they moved to a position "below the market" in EM currencies, including the South African rand and the Taiwan dollar. "A change in the direction of trade negotiations could lead to a downward revision of forecasts for the growth of currencies of developing countries. We believe that the market needs to adjust its expectations depending on the results of trade negotiations between the United States and China", representatives of the bank said. "It is the most undervalued topic on the market," commented by Thomas Korterg, an economist at Pictet Wealth Management. Experts at Goldman Sachs warned that there may be many currencies in the line of fire - from the euro to the South African rand and the Chilean peso. "Taiwan and South Korea could lose the most if the situation escalates. Won and Chinese yuan, as well as the Taiwanese, Australian and Canadian dollars, are subject to risks, and the euro can fall quite strongly. To protect against downside risks, I advise you to take short positions in these currencies or invest in bonds of the respective countries", said by the head of the currency strategy at Westpac, Richard Franulovich. Nordea Investment Funds believes that "If Washington and Beijing fail to make a deal that will prevent an all-out trade war, then the Chinese yuan will be 10% depreciated. This can create a domino effect on the currencies of developing countries sector". The material has been provided by InstaForex Company - www.instaforex.com |
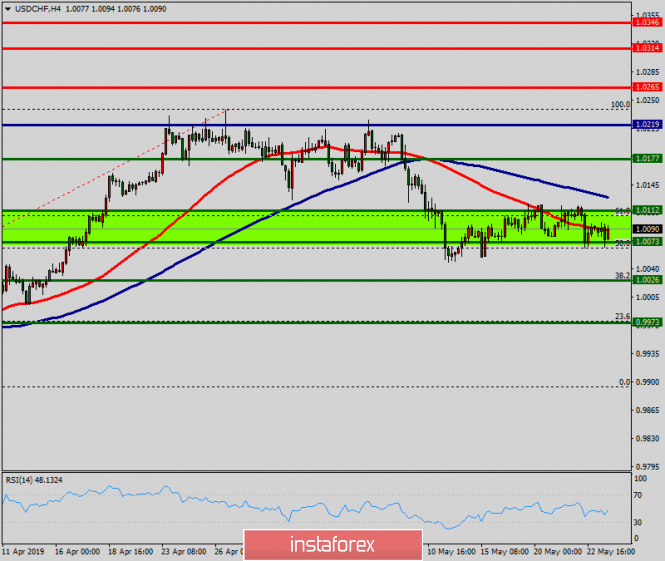
| Technical analysis of USD/CHF for May 23, 2019 Posted: 23 May 2019 06:32 AM PDT The USD/CHF pair continues moving in a bullish trend from the support levels of 1.0123 and 1.0177. Currently, the price is in an upward channel. This is confirmed by the RSI indicator signaling that the pair is still in a bullish trend. As the price is still above the moving average (100), immediate support is seen at 1.0177. Consequently, the first support is set at the level of 1.0177. So, the market is likely to show signs of a bullish trend around 1.0177. In other words, buy orders are recommended above the level of 1.0177 with the first target at the level of 1.0265. Furthermore, if the trend is able to breakout through the first resistance level of 1.0265, we should see the pair climbing towards the point of 1.0314. However, it would also be wise to consider where to place a stop loss; this should be set below the second support of 1.0123. The material has been provided by InstaForex Company - www.instaforex.com |
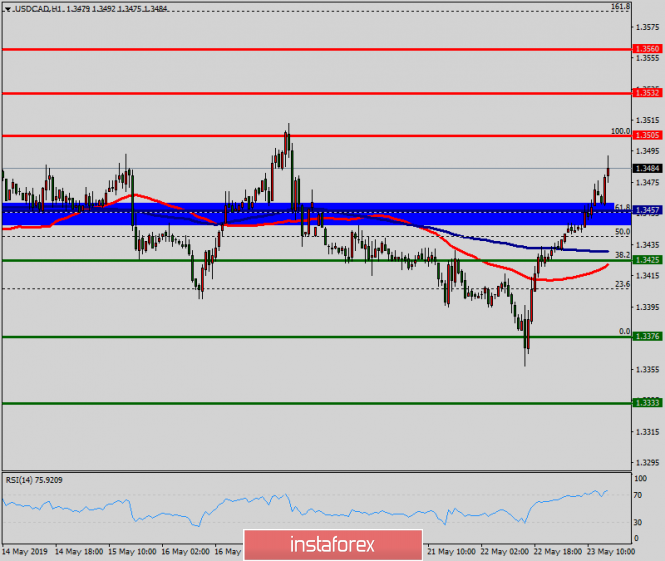
| Technical analysis of USD/CAD for May 23, 2019 Posted: 23 May 2019 06:26 AM PDT The USD/CAD pair continues to move upwards from the level of 1.3457. The pair rose from the level of 1.3457 (the level of 1.3457 coincides with a ratio of 61.8% Fibonacci retracement) to a top around 1.3505. But it rebounded from the top pf 1.3505 to 1.3477. Today, the first support level is seen at 1.3457 followed by 1.3425, while daily resistance 1 is seen at 1.3457. According to the previous events, the USD/CAD pair is still moving between the levels of 1.3505 and 1.3457; for that we expect a range of 48 pips (1.3505 - 1.3457). On the one-hour chart, immediate resistance is seen at 1.3505. Currently, the price is moving in a bullish channel. This is confirmed by the RSI indicator signaling that we are still in a bullish trending market. The price is still above the moving average (100), Therefore, if the trend is able to break out through the first resistance level of 1.3505, we should see the pair climbing towards the daily resistance at the levels of 1.3532 and 1.3560. It would also be wise to consider where to place stop loss; this should be set below the second support of 1.3425. The material has been provided by InstaForex Company - www.instaforex.com |
| Euro will fall and there is no reason for optimism at all Posted: 23 May 2019 06:19 AM PDT Business growth in the eurozone has accelerated but it is difficult to call it good news for the euro. The rise was minimal due to the ongoing downturn in the manufacturing industry. The data confirms the words of the ECB President Mario Draghi about the need for "greater support for the eurozone economy." The IHS Markit Purchasing Managers Index (PMI), which is considered to be an indicator of the state of the economy, rose only to 51.6 points in May from 51.5 points in April. At present, one cannot hope for stronger growth in the second quarter, as the economy is in limbo. Indicators suggest that GDP growth is likely to be 0.2 percent in this quarter, which is less than the previous forecast of 0.3 percent. Separately, it is possible to note more pessimistic moods from business leaders for the first time since August 2014 as they have reduced the number of staff. The employment index fell to 49.0 from 50.7 points. The index of business activity in the manufacturing sector is noticeably lagging behind the service sector, which is currently dominant. It is true that growth here has slowed down. Moreover, PMI fell from 52.8 to 52.5 points, which contradicts expectations of moderate growth to 53.0 points. The export business among service firms, including the trade between member countries of a block, has suffered due to weaker global growth, as well as trade tensions and Brexit. The sub-index fell to 48.1 points, which is one of the weakest values since IHS Markit began collecting these data at the end of 2014. |
| GBP/USD: plan for the US session on May 23. The pound updated its monthly lows but held above 1.2612 Posted: 23 May 2019 06:11 AM PDT To open long positions on GBP/USD, you need: Buyers showed themselves in the support area of 1.2612, which I drew attention to in my morning review, and now their goal is to return to the resistance level of 1.2670, on which a further upward correction will depend. The main goal of buyers to build a good trend will be the highs of 1.2730 and 1.2789, where I recommend fixing the profits. In the scenario of a repeated decline to the support area of 1.2612, it is best to open long positions from there, provided that a false breakout is formed, or a rebound from the minimum of 1.2564. To open short positions on GBP/USD, you need: Bears continue to push the pound down and are waiting for a steep collapse amid talk that British Prime Minister Theresa May will announce her resignation this weekend. The formation of a false breakout in the resistance area of 1.2670 will lead to a new wave of short positions in the pound and a decrease in the pair to the low of 1.2612, the breakthrough of which will provide sellers with a road to the support area of 1.2564 and 1.2500, where I recommend fixing the profit. In a scenario of rising above the 1.2670 during the second half of the day, the short position it is best to return the bounce from a high of 1.2730. Indicator signals: Moving Averages Trading is below 30 and 50 moving averages, indicating a bearish market. Bollinger bands In the case of growth the pound, the upward trend will be limited to the upper border of the indicator in the area of 1.2680. Description of indicators
|
| Posted: 23 May 2019 06:11 AM PDT To open long positions on EURUSD, you need: Buyers missed the support level of 1.1143 against the background of weak reports on the Eurozone and Germany, which indicated a decrease in activity indices. A new task for the second half of the day is to return to the range of 1.1143, which may lead to an update of the morning resistance level in the area of 1.1166, where I recommend fixing the profits. In the case of a further decline in the euro, it is best to return to long positions to rebound from a large low of 1.1112. To open short positions on EURUSD, you need Bears are required to form a false breakdown in the resistance area of 1.1143, which will maintain the downward potential and lead to a further reduction of EUR/USD to the support area of 1.1112 and 1.1079, where today I recommend fixing the profits. In a scenario of growth of EUR/USD above the resistance of 1.1143, short positions can be opened immediately to rebound from a maximum of 1.1166. Given the elections to the EU Parliament, volatility will continue to be extremely low. Indicator signals: Moving Averages Trading is below 30 and 50 moving averages, which indicates the bearish nature of the market. Bollinger Bands The volatility of the indicator is low, which does not give signals to enter the market. Description of indicators
|
| Elections to the European Parliament and the possible resignation of Theresa May Posted: 23 May 2019 04:23 AM PDT
It seems that there are no more interesting events than the elections to the European Parliament, which will start today. Therefore, traders should closely monitor the dynamics of the euro, from which we can expect increased volatility in the coming days. Many investors fear that populist parties may take a significant number of seats in the representative body of the EU. By Sunday, it will be known whether eurosceptics will be able to get enough mandates to block rather than just slow down the legislative process. The results can also have a significant impact on the upcoming elections in Italy. Rome plans to adopt a budget whose deficit exceeds the threshold value of the eurozone. If the Italian populists enlist sufficient support, then they can feel confident in their abilities and go for a confrontation with Brussels. Despite the widespread belief that anti-European sentiment is negative for the euro, it should be recognized that populism does not always harm currencies. Take, for example, the United States and Australia. Donald Trump's protectionist policies helped the US dollar, and his Australian namesake strengthened after the unexpected victory of Prime Minister Scott Morrison's center-right Liberal Party over the weekend. Will the euro be able to grow if the eurosceptic succeed in the elections? It's hard to say for sure now. The election results will be published gradually, so we can not see the breakdown until at least Sunday, and then you can even expect a gap. Technically, the EUR/USD pair is trading in a downtrend and, apparently, will not unfold until it closes above the mark of 1.1250. Meanwhile, the pressure on other currencies remains strong. The pound sterling fell to 6-month lows against the US dollar after a negative reaction to the proposal of Prime Minister Theresa May on Brexit. Apparently, T. May's plan was not viable, since Labor and the Conservatives said that they would not support her proposal to first approve the deal on the Customs Union and may consider the option of holding a second referendum on this issue. In addition, there are many rumors that the Conservatives will try to send T. May to resign in the coming days, not even giving her a chance for the last attempt. British Prime Minister T. May is preparing to resign, reports The Times, citing her fellow party members, who believe that the head of the Cabinet will announce this tomorrow, May 24, after a meeting with the Chairman of the Parliamentary "Committee of 1922" Graham Brady. "She hoped that she should take the last step, but if this is not possible, then she gets out of the way," said one of the colleagues of the British Prime Minister. "It seems that now among the most likely scenarios are the failure of the vote in early June, the resignation of T. May and the announcement of general elections in the country. It is possible that this will lead either to a "hard" Brexit or to the formation of the government of Jeremy Corbyn. Neither looks good for the pound. It is still unknown whether the clouds that are over the Old World and over the euro due to the elections to the European Parliament will be able to keep the EUR/GBP pair below 0.8800, however, the pressure on GBP/USD may well turn into a passage to the support level of 1.2500 and even a little further," – says John Hardy, currency strategist at Saxo Bank. After updating the monthly lows, the USD/CAD pair returned to the range in which it has been since the end of April. "Loonie" was under attack due to lower risk appetite and almost 3% drop in oil prices. Analysts at Danske Bank believe that the chances for a moderate strengthening of the "Canadian" remain. "Despite the extremely negative signals from the United States and China, the parties are in no hurry with the implementation of the latest threats, and the growth of the global economy in the near future may not be as weak as investors expect, and will contribute to maintaining high oil prices," – said the representatives of the financial institution. According to the forecast of Danske Bank, within a month, USD/CAD will fall to the level of 1.33, and in the three-month perspective – to the level of 1.31. The bank also believes that investors are mistaken in their expectations regarding the interest rate cut by the Bank of Canada. "The probability of this event in the next 12 months is estimated by the market at 50%, but we are confident that the rate will remain unchanged. However, we do not think that the re-evaluation of the prospects will provide "loonie" significant support, as investors look at the rate in Canada through the prism of the Fed's rates, so the adjustment of expectations is unlikely to affect the differential rates," – said the experts. |
| The dollar has reached a monthly high and is preparing to take a new height Posted: 23 May 2019 04:23 AM PDT The dollar has updated the monthly maximum and is not going to stop; the economic and political uncertainty that has swept Europe and Asia is pushing the "American" up and putting pressure on most major currencies, including the euro and the yuan. The problems of German production, the consequences of the trade war for Asian countries, concerns about Brexit and the upcoming European parliamentary elections — against this background, the US, where the only problem is the trade conflict with China, looks the most attractive, and investors see the dollar as a relatively safe haven. There is every reason to believe that in the short term, the dollar will retain its popularity as a safe haven, even though the Fed is more relaxed than expected. Especially against the background of other central banks, which are lowering interest rates one by one, the Fed looks like an "aggressor". The pigeon tone of the world Central Bank will support the growth of the dollar. Other factors are also on the side of the "American". The activity in the services and manufacturing sectors in Germany is falling, which indicates problems in Europe's largest economy. Concerns about the global economy are exacerbated by growing political uncertainty, especially in Europe. Brexit and parliamentary elections make investors worry about the stability of the euro and the pound. Both currencies are falling in price. In addition to the dollar, one should pay attention to the Japanese yen, which has risen sharply in price, since the constant fears of another escalation in the trade conflict between the US and China are excellent grounds for growth. If we add Brexit and other European problems to this, then the yen is waiting for a further rise. The currency rose to 110.23 yen per dollar, rebounding from a two-week low of 110.675, broken through on Tuesday, and also rose 0.2% against the euro, added 0.5% against the pound and rose 0.3% against the Australian dollar. The material has been provided by InstaForex Company - www.instaforex.com |
| You are subscribed to email updates from Forex analysis review. To stop receiving these emails, you may unsubscribe now. | Email delivery powered by Google |
| Google, 1600 Amphitheatre Parkway, Mountain View, CA 94043, United States | |





No comments:
Post a Comment