
Forex analysis review |
- Technical analysis for EURUSD for May 24, 2019
- Technical analysis for Gold for May 24, 2019
- Bitcoin analysis for May, 24.2019
- May 24, 2019 : EUR/USD Intraday technical analysis and trade recommendations.
- Analysis of Gold for May, 24.2019
- GBP/USD analysis for May, 24.05.2019
- May 24, 2019 : GBP/USD demonstrating early signs of bullish recovery.
- Who is stronger, the euro or the dollar?
- GBPUSD: Theresa May resigns, and the pound remains under pressure due to the risk of hard Brexit
- GBP/USD: plan for the US session on May 24. Theresa May resigns, and the pound leaves this case without attention
- EUR/USD: plan for the US session on May 24. Buyers reached the morning level of 1.1206, but then slowed down
- The dollar is punished for overconfidence
- Striking heroism of the euro and restrained optimism of the pound
- Wave analysis for EUR / USD and GBP / USD pairs on May 24: Theresa May resigns June 7
- The oil market has experienced the worst week in the last six months
- The berries can be bitter: we expect local movement in the ranges of EUR/USD and USD/CAD pairs
- Technical analysis of EUR/USD for May 24, 2019
- Technical analysis of NZD/USD for May 24, 2019
- Bitcoin regains momentum to reside at $8,000 again, May 24, 2019
- Trading Plan for EUR/USD pair on 05/24/2019
- We waited for a rebound (a review of EUR / USD and GBP / USD on 05/24/2019)
- Trading recommendations for the GBPUSD currency pair - prospects for further movement
- EUR / USD: the dollar has ceased to receive dividends from the trade war
- Burning forecast EURUSD 05/24/2019
- Indicator analysis. Daily review for May 24, 2019 for currency pairs EUR / USD and GBP / USD
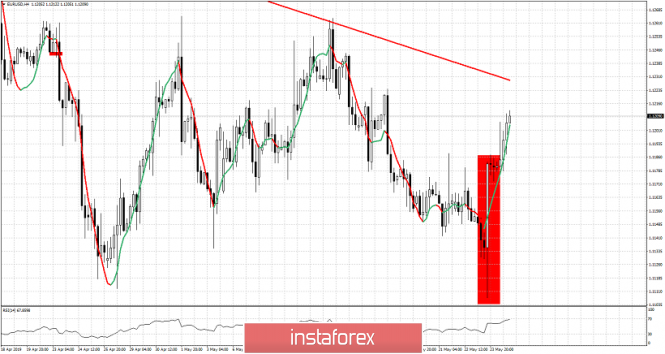
| Technical analysis for EURUSD for May 24, 2019 Posted: 24 May 2019 12:52 PM PDT After an impressive 4 hour reversal candle pattern yesterday, EURUSD is now moving higher confirming our bullish expectations as we noted in our last analysis. We singled out the long bullish candlestick yesterday and we said that this was a reversal pattern. A follow through would be bullish for EURUSD.
Red line - resistance trend line Red rectangle - bullish reversal 4 hour candlestick pattern EURUSD is trading above 1.12 today near the week highs. Having started the week on a weak note, yesterday's 4 hour candle inside the red rectangle was a clear sign of reversal. There are many chances that a major low is in for EURUSD. However in order to be sure, we will need price to break and stay above 1.1260. Resistance is found at 1.1230 at the upper channel boundary also shown by the red line in the chart above. Previous high at 1.1260 is also important resistance so clearing both of these levels will open the way for a much bigger bounce. The material has been provided by InstaForex Company - www.instaforex.com |
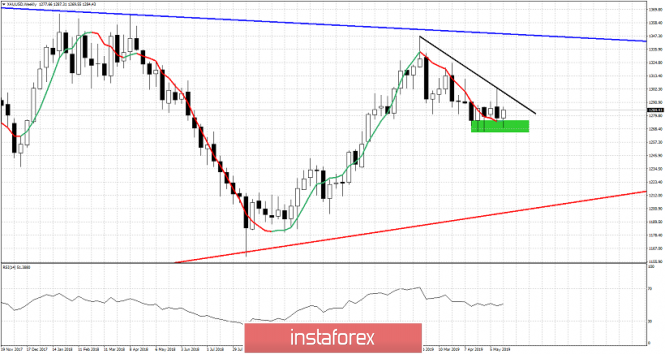
| Technical analysis for Gold for May 24, 2019 Posted: 24 May 2019 12:45 PM PDT Gold price is trading near its weekly highs after challenging important support at the start of the week. Price initially broke below important support trend lines but the week is ending on a more bullish note than when it started. Price is approaching major resistance area of $1,290-$1,300 again.
Green rectangle - support area Red line - major support trend line Blue line - major resistance trend line Gold price bounced once again from the green support area. Bulls manage to hold above $1,266 and price recaptured $1,280. Gold price is now challenging the $1,290-$1,300 resistance area. For more upside bulls will need to break this resistance and recapture and hold above $1,300. Failure to do so will bring price back to $1,270 and if $1,266 is broken we will most certainly see a move to $1,250-20. For now bulls are still alive but bears continue to hold the upper hand. The material has been provided by InstaForex Company - www.instaforex.com |
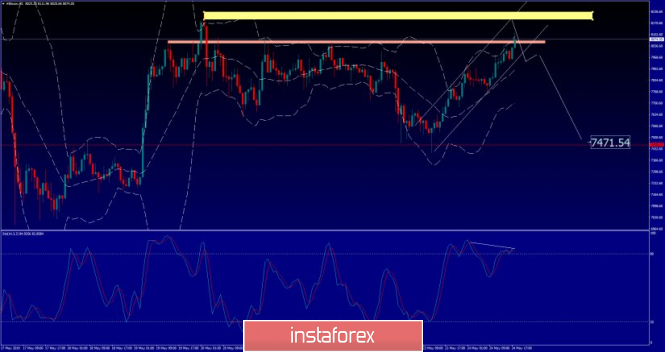
| Bitcoin analysis for May, 24.2019 Posted: 24 May 2019 08:56 AM PDT BTC has been trading upwards. The price tested the level of $8.100. Anyway, it looks risky for buying since the key resistance line at the price of $8.233 is there.
Yellow rectangle – swing high resistance Red horizontal line – swing low support White lines – Upward channel BTC is trading inside of the upward channel. Anyway, strong resistance cluster at the price of $8.233 is there and buying looks risky at this stage. Our advice is to watch for potential break of the upward channel in order to confirm down movement. Stochastic oscillator is showing the bearish divergence, which is another sign of the weakness. The material has been provided by InstaForex Company - www.instaforex.com |
| May 24, 2019 : EUR/USD Intraday technical analysis and trade recommendations. Posted: 24 May 2019 08:55 AM PDT
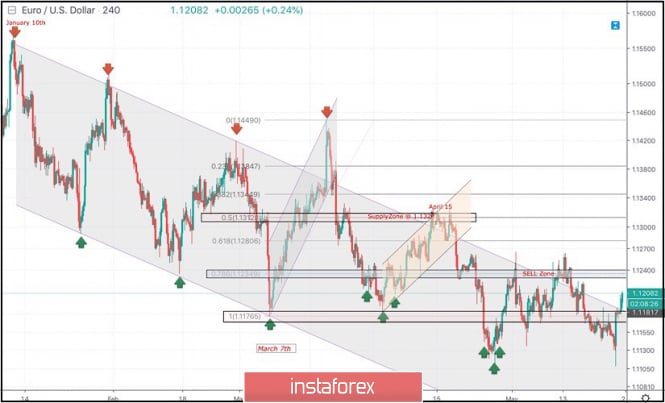
On January 10th, the market initiated the depicted bearish channel around 1.1570. Since then, the EURUSD pair has been moving within the depicted channel with slight bearish tendency. Few weeks ago, a bullish Head and Shoulders reversal pattern was demonstrated around 1.1200. This enhanced further bullish advancement towards 1.1300-1.1315 (supply zone) where significant bearish rejection was demonstrated on April 15. Short-term outlook turned to become bearish towards 1.1235 (78.6% Fibonacci) then 1.1175 (100% Fibonacci level). For Intraday traders, the price zone around 1.1235 (78.6% Fibonacci) stood as a temporary demand area which paused the ongoing bearish momentum for a while before bearish breakdown could be executed on April 23. On May 13, another bullish pullback was executed towards the mentioned price zone (1.1230-1.1250) where the current bearish movement was initiated. For the past few weeks, the EURUSD pair has been trapped above the next demand-zone (1.1175) until last Friday when a bearish breakdown below 1.1175 was temporarily achieved. As expected, further bearish decline was expected towards 1.1115. This is where significant bullish recovery was demonstrated by the end of Yesterday's consolidations. This brought the pair back above 1.1175 (previous weekly low). Currently, The EURUSD pair remains trapped between the depicted price zones (1.1175-1.1235) with recent bullish tendency until a definitive range-breakout occurs in either direction. Trade recommendations : Intraday traders can look for a counter-trend BUY entry upon the recent bullish breakout anywhere around the price level of 1.1175. T/P level to be located around 1.1240. Stop loss should be placed below 1.1150. The material has been provided by InstaForex Company - www.instaforex.com |
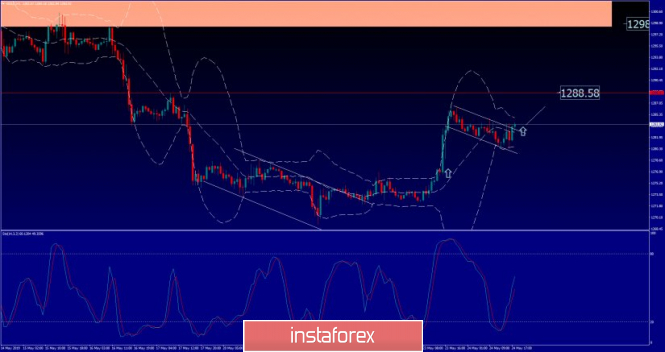
| Analysis of Gold for May, 24.2019 Posted: 24 May 2019 08:41 AM PDT Gold has been trading sideways at the price of $1.283.85. From our view, Gold did only consolidation before potential new wave up.
Red horizontal line – swing high resistance Orange rectangle- Resistance 2 White lines – bullish flag boundiries Broken bull flag on the 1H time-frame, watch for potential buying opportunities. We found that after the mark up phase yesterday, today price action looks like a corrective down move before new wave up. Downward references are set at $1.280 and $1.278. Upward references are set at $1.288 and $1.298. Stochastic oscillator did flip for upside as well, which adds more for the upside. The material has been provided by InstaForex Company - www.instaforex.com |
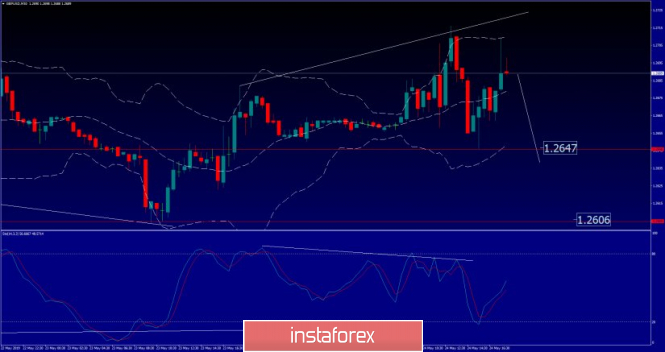
| GBP/USD analysis for May, 24.05.2019 Posted: 24 May 2019 08:32 AM PDT GBP has been trading upwards. The price tested the level of 1.2117. Anyway, I found potential fake breakout of yesterday's high at 1.2684, which is sign that buying at this stage looks risky.
Red horizontal line – swing low support Red horizontal line 2- Swing low support 2 White lines – Bolinger bands GBp/USD did try to push higher but we found that bearish divergence on the Stochastic oscillator, which is sign for potential downside. Key intraday resistance is set at the price of 1.2716. Downward references are set at 1.2647 and 1.2606. Our advice is to watch for potential selling opportunities. The first downward target is set at the price of 1.2647. The material has been provided by InstaForex Company - www.instaforex.com |
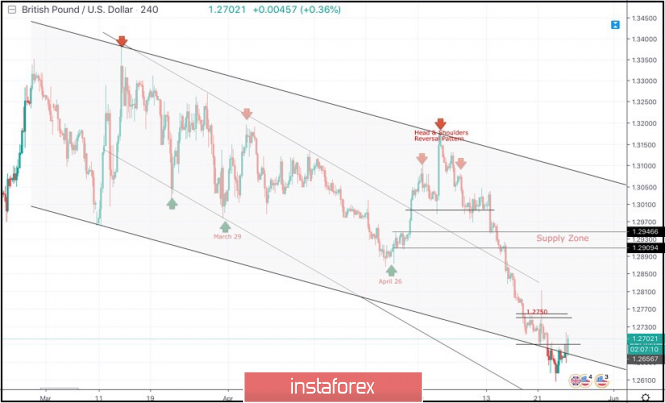
| May 24, 2019 : GBP/USD demonstrating early signs of bullish recovery. Posted: 24 May 2019 08:03 AM PDT
On March 29, a visit towards the price levels of 1.2980 (the lower limit of the newly-established bearish movement channel) could bring the GBPUSD pair again towards the upper limit of the minor bearish channel around (1.3160-1.3180). Since then, Short-term outlook has turned into bearish with intermediate-term bearish targets projected towards 1.2900 and 1.2850. On April 26, another bullish pullback was initiated towards 1.3000 (the same bottom of March 29) which has been breached to the upside until May 13 when a bearish Head and Shoulders pattern was demonstrated on the H4 chart with neckline located around 1.2980-1.3020. That's why, the price zone of 1.3000-1.3020 turned to become a prominent supply-zone where a valid bearish entry was offered few weeks ago. Bearish persistence below 1.2980 (Neckline of the reversal pattern) enhanced further bearish decline. Initial bearish Targets were already reached around 1.2900-1.2870 (the backside of the broken channel) which failed to provide any bullish support for the pair. Further bearish decline was demonstrated towards the lower limit of the long-term channel around (1.2700-1.2650). The GBPUSD pair looks oversold around the current price levels (1.2650-1.2700). That's why, SELL signals shouldn't be considered at such low prices. On the other hand, bullish persistence above 1.2690 and 1.2750 is needed to enhance the bullish side of the market towards 1.2870 (Bottom of April 26). Trade Recommendations: Conservative traders should wait for another bullish pullback towards 1.2870-1.2905 (newly-established supply zone) to look for valid sell entries. S/L should be placed above 1.2950. Counter-trend traders can consider the current bullish breakout above 1.2690-1.2700 as a valid BUY signal. T/P level to be located around 1.2750 and 1.2820. S/L to be located below 1.2640. The material has been provided by InstaForex Company - www.instaforex.com |
| Who is stronger, the euro or the dollar? Posted: 24 May 2019 07:16 AM PDT Brilliant campaigns of "bears" on EUR/USD ended in failure. The first sign of their weakness was their inability to anchor below the support level of $1.13. And it all started so well. Why the euro bounced up while the dollar was thrown off its pedestal. After all, in economic terms, the positions of currencies are almost equal – both countries are predicted to slow growth. The American policy of protectionism is a serious blow to competitors, but at the same time, it goes to the States themselves. The recent series of introduced tariffs will cost US consumers $106 billion a year, the New York Federal Reserve Bank estimated. The situation was aggravated by the disappointing statistics on the real estate market and business activity. Rates on 2-year US government securities deepened to a 15-month bottom, "ten-year" fell to 19-month lows, the yield curve went into the red zone, and the risks of lowering the Fed rate this year jumped to 78% from 68% earlier. In this situation, the dollar is difficult to stay afloat, not to mention the growth. As for the euro, the continued decline in purchasing managers' indices in the manufacturing sector of Germany and the eurozone, together with a serious fall in the business climate from the IFO, hit the quotes powerfully. The ECB added fuel to the fire. Financial officials predicted a long-term slowdown in eurozone GDP and low inflation expectations. It is worth noting that, in a panic selling the euro, very few people noticed the published positive. Thus, PMI in the services sector, which accounts for 73% of the euroblock economy, is still stable. Business activity in France jumped to its highest level in six months. Another important point: the members of the European Central Bank believe that negative rates will negatively affect the financial results of the banking system. It is possible that the ECB will raise them and at the same time provide a generous LTRO package. Isn't it a bullish factor for EUR/USD? Indeed, economic growth in the eurozone may slow down in the second quarter, but America is far from "chocolate". According to estimates of the leading indicator from the Atlanta Fed, the US GDP growth rate in the period from April to June will be reduced to 1.2% from 3.2%. Quite perceptible. The slogan "America First!" and the accompanying policy seems to have the opposite effect, and Donald Trump cuts the branch on which he sits. Next year, voters are unlikely to be impressed by the slow development of the economy. By the way, Trump, looking at the fall of the S&P 500, announced his intention to support local farmers affected by trade wars, and announced the amount. This year, it will be increased to $16 billion from $12 billion earlier. The owner of the White House also made it clear that the Chinese technology giant Huawei could become a bargaining chip in the protracted dispute between the United States and China. Yes, the company's activity threatens US national security, but the President is ready to withdraw sanctions for the sake of signing an agreement with China. Now, the market is dominated by anti-risk sentiment. The American economy is causing concern this time. The fall of the S&P 500, as expected, increased the demand for protective assets – yen, franc, and gold. The material has been provided by InstaForex Company - www.instaforex.com |
| GBPUSD: Theresa May resigns, and the pound remains under pressure due to the risk of hard Brexit Posted: 24 May 2019 07:16 AM PDT Perhaps all the attention of traders today was focused on the news that British Prime Minister Theresa May announced her resignation. This decision was quite predictable, which did not lead to a significant change in the market situation, except for a small profit taking on the British pound in the area of large support levels. Theresa May announced today that she will resign on June 7, and the struggle for leadership in the Conservative Party will begin on June 10. Until that time, until the election of a new leader, May will remain as head of the party. The main reason why British Prime Minister Theresa May left her post was another unsuccessful attempt to enlist the support of Parliament regarding the agreement on the conditions for the country's withdrawal from the EU. It is likely that her post will get a supporter of tougher Brexit than expected developed May's agreement. However, the current situation has already been taken into account in the quotes of the GBPUSD pair, which has been declining over the past two weeks. According to experts, among the main favorites in the struggle for the Prime Minister's seat is former foreign Minister Boris Johnson, as well as former Brexit Secretary Dominique Raab. Let me remind you that these two candidates are supporters of a sharp break in relations with the EU, which increases the likelihood of a hard Brexit. However, do not rush and sell the pound at current lows. It should be understood that even if the new Prime Minister takes the side of a tougher Brexit, a break in relations with the EU without announcement still seems unlikely, as this will not change the balance of power in Parliament. First of all, we are talking about the Conservative Party, in which quite a few people are waiting for a milder development of the situation. On the other hand, most likely, it will be possible to forget about the second referendum, which Theresa May recently emphasized in her agreement. As for today's fundamental data, retail sales failed to provide strong support to the British pound. According to the report, in April of this year, compared with March, the volume of retail sales in the UK did not change. The data were much better than forecasts of economists, who expected a decline in sales by 0.3%. The report of the National Bureau of Statistics suggests that consumers will continue to support the economy of the country in 2019, which can offset the limited costs of companies in the face of uncertainty with Brexit. As for April last year, the volume of retail sales grew by%, 2%. The material has been provided by InstaForex Company - www.instaforex.com |
| Posted: 24 May 2019 06:07 AM PDT To open long positions on GBP/USD, you need: Today's news that British Prime Minister Theresa May will resign on June 7, passed for the market without a trace, as it was quite expected. Buyers of the pound in the second half of the day need to stay above the support of 1.2662, and the formation of a false breakdown there will be a signal to open long positions based on updating the morning high of 1.2723 and its breakthrough, which will open a direct road to the resistance area of 1.2789, where I recommend fixing the profits. When returning to the support of 1.2662, it is best to open long positions to rebound from a low of 1.2607. To open short positions on GBP/USD, you need: Bears are expected to return in the resistance area of 1.2723, after a report on retail sales in the UK, which did not please traders. The main task for the second half of the day will be a decrease and a breakthrough of the support of 1.2662, which will lead to a new, larger will of sales of GBP/USD with the update of the lows in the area of 1.2607 and 1.2564, where I recommend fixing the profit. Indicator signals: Moving Averages Trading is conducted in the area of 30 and 50 moving averages, which indicates the lateral nature of the market and further uncertainty. Bollinger Bands The volatility of the indicator is low, which does not give signals to enter the market. Description of indicators
|
| Posted: 24 May 2019 06:07 AM PDT To open long positions on EURUSD, you need: The goal of updating the resistance of 1.1206 was completed at the first half of the day, and as long as the trade is conducted above the new support level of 1.1178, the demand for the euro will continue. The main task of the bulls in the afternoon will be a breakthrough of the resistance of 1.1206, which may contribute to the bad data on the US economy, which will be released soon. In this scenario, you can count on updating the maximum of 1.1237, where I recommend fixing the profits. When returning to the support of 1.1178, it is best to return to the long positions in EUR/USD to the rebound from 1.1149. To open short positions on EURUSD, you need: Bears are required to form a false breakdown in the resistance area of 1.1206, which will be the first signal to open short positions with the main goal of returning to the support area of 1.1178, where I recommend fixing the profits. In the EUR/USD growth scenario above the resistance of 1.1206, it is possible to open short positions immediately on the rebound from the maximum of 1.1037. Indicator signals: Moving Averages Trading is conducted above 30 and 50 moving averages, which keeps the market on the side of euro buyers. Bollinger Bands The volatility of the indicator is low, which does not give signals to enter the market. Description of indicators
|
| The dollar is punished for overconfidence Posted: 24 May 2019 05:42 AM PDT When there is too much negativity on the market, it can sadly end for bears. The sellers increased the EUR/USD quotes to the base of the 11th figure amid worsening European business activity and concerns of the ECB about a long period of slowing down of the eurozone economy. But, it did not take into account the fact that the States are experiencing problems due to trade wars. The fall in US purchasing managers' indices and disappointing statistics on the US real estate market contributed to the growth of fears about the imminent recession. The inversion of the yield curve and the increased likelihood of the Fed lowering the rate in 2019 to 78% hit the dollar. If in 2018 the "American" perceived trade wars as a pretext for strengthening, then the situation changed in 2019. The USD index no longer has support from a large-scale fiscal stimulus and is ready to raise the federal funds rate of the Fed. Judging by business activity, the eurozone's GDP in the second quarter will slow down from 0.4% to 0.2% q/q, however, the growth rate of the US economy will decline from 3.2% to 1.2% according to the leading indicator from the Atlanta Fed. The escalation of the trade conflict between Washington and Beijing, coupled with growing recession risks, is a weighty argument in favor of increasing the chances of monetary expansion in the current year, which negatively affects the dollar position. Dynamics of the probability of the Fed rate change It seems that the EUR/USD "bears" overdid it and the fall in stock indices made the main currency pair go on a roller coaster ride and for some time return above 1.12. The development of the correction of the S&P 500 will help non-residents to flee from the securities issued in the States, which will result in a rollback on the USD index. In this regard, a logical question arises: Will trade wars really continue to support the US dollar as the currency of a country that is a potential winner of the conflict? In my opinion, the answer is no. The yen, the franc and gold regained the status of the main safe-haven assets. Therefore, weak statistics from the May purchasing indices of China's purchasing managers will contribute to a fall in world stock indices and the USD/JPY pair. In order to cling to the lower limit of the medium-term consolidation range of 1.12-1.15, the EUR/USD bulls must go through the elections to the European Parliament and the release of data on German unemployment, retail sales and inflation. Improving the situation in the leading currency bloc economy will be a catalyst for the euro. The single European currency was supported by the pound in which the principle of "sell on rumors, buy on facts" was implemented. For a long time they were getting rid of the sterling because of the talk about the resignation of Theresa May from the post of prime minister, but as soon as it was officially announced, the GBP/USD pair began to grow. Technically, the failure of the EUR/USD "bears" to consolidate below the support at 1.113 was the first sign of their weakness. A double bottom was formed, which increases the risks of activating and realizing the Wolfe Wave pattern with an initial target near 1.15. At the same time, a successful assault on resistance at 1.1265 will add optimism to the "bulls". In this scenario, the expanding wedge reversal pattern will become relevant. EUR / USD daily chart |
| Striking heroism of the euro and restrained optimism of the pound Posted: 24 May 2019 05:38 AM PDT After falling to the lowest levels since May 2017, the pair EUR/USD was able to recover and close yesterday around 1.1180, where it is consolidating today. Investors' concerns about the increased tension in trade relations between Washington and Beijing, as well as concerns about the prospects of the US economy provoked the sale of the dollar on Thursday, against which the euro managed to win back the previously lost points. The weak data on housing sales and business activity in the manufacturing sector of the US economy released yesterday caused talk about the possible onset of a recession in the country next year. On these rumors, the yield of 10-year treasuries sank to 2-year lows at 2.30%, and the USD index retreated from annual highs near 98. It should be recognized that there is no reason for a significant strengthening of the euro. Recent economic releases for the eurozone have been weaker than expected. Business activity in the services and manufacturing sectors in Germany and the currency bloc as a whole has slowed down. The IFO report on Germany also showed a deterioration: the business climate index fell to its lowest level since 2014. The US and China trade war affected the mood of the German business circles, and, according to the head of the IFO Clemens Fuest, there is a reason for concern, especially on the manufacturing sector. In addition, until the end of May, the "European" will not have guidelines in the form of meetings of the European Central Bank, which will take another decision on monetary policy only in June. The pound also managed to win back its losses against the dollar against the background of reports of the impending resignation of British Prime Minister Theresa May. The GBP/USD pair found strong support near 1.2600 and was able to recover most of the points after falling to 4.5-month lows. Today, T. May announced that she will resign as leader of the ruling conservative party in the United Kingdom on June 7. Until her successor is elected, T. May will continue to perform the duties of the head of the Cabinet of Ministers. The election process for a new Tory leader will begin on June 10. The main candidate is former foreign Minister Boris Johnson. After the statement of T. May, the pound against the dollar jumped by 0.5%, exceeding the level of $1.27, but then stopped the growth. Apparently, investors fear that the successor of T. May could withdraw Foggy Albion from the EU without a deal or call early parliamentary elections. "T. May's resignation is most likely already in the quotes, but I am not sure that the market is ready for B. Johnson," said Andrew Cole from Pictet Asset Management. "The market's attention is already turning to what will happen after the resignation of T. May. We still see further potential for the pound to decline even after the recent sharp sell-off," said Fritz low, currency strategist at MUFG Bank. According to Russell Silberston, portfolio Manager of Investec Asset Management, the British currency can test levels below $1.20 if the chances of a "hard" Brexit or the probability of holding general elections continue to grow. "In the short term, the only thing that can work in favor of the pound is any benefits for the pro-European parties in the elections to the European Parliament, which are held this week," he said. "The next Prime Minister may find himself in the same impasse faced by T. May, which will increase the risk of a disordered UK exit from the EU and increase the loss of the pound. However, it is possible that the British Parliament will eventually vote for the abolition of Brexit", – said Luke Hickmore of Aberdeen Standard Investments. He expects the pound to stabilize at $1.30–1.35. The material has been provided by InstaForex Company - www.instaforex.com |
| Wave analysis for EUR / USD and GBP / USD pairs on May 24: Theresa May resigns June 7 Posted: 24 May 2019 05:32 AM PDT EUR / USD pair Trading the EUR/USD pair ended on Thursday, May 23, with an increase of 30 basis points, which somewhat confused the cards at the hands of traders. The wave pattern implied a further fall in the euro but now an alternative scenario is emerging, which implies the completion of the construction of the downward trend that takes its start on March 20. The unsuccessful attempt to break through the minimum of the supposed wave 1, 3, 3 speaks precisely in favor of this and shows the unavailability of the pair to fall. All of these changes are associated with weak American statistics. Business activity in both areas of production and services unexpectedly turned out to be much worse than forecast. Meanwhile, markets were disappointed with such figures and began to get rid of the dollar. Now, the tool can attempt to break through the maximum of wave 2, 3, and 3. Sales targets: 1.1097 - 161.8% Fibonacci 1.1045 - 200.0% Fibonacci Purchase targets: 1.1324 - 0.0% Fibonacci General conclusions and trading recommendations: The euro/dollar is still in the process of building a downtrend trend. But after yesterday's withdrawal of quotes from the lows reached, I recommend waiting for the signal down from the MACD and again selling the euro with targets at 1.1097 and 1.1045, which corresponds to 161.8% and 200.0% in Fibonacci. I recommend to place a restrictive order above the level of 100.0% Fibonacci. GBP / USD pair On May 23, the GB /USD pair also gained 30 basis points. However in consideration of the average market activity for the pair, the reaction is completely unequal to the reaction for the euro/dollar pair. There is no reason to clarify the current wave marking on the instrument now, even if the MACD indicator gave an upward signal. This also warns at least a rollback. Nevertheless, given the not so rosy news background from the UK, there is every reason to wait for the resumption of the fall of the sterling pound. Just a few hours ago, the current Prime Minister of Great Britain, Theresa May, announced that she was retiring on June 7. Markets did not respond to this statement, although one could expect a wave of optimism since the new prime minister is more likely to bring Brexit to a logical end. May lost the support of both the public and the parliament early in the year. Sales targets: 1.2554 - 200.0% Fibonacci 1.2360 - 261.8% Fibonacci Purchase targets: 1.3175 - 0.0% Fibonacci General conclusions and trading recommendations: The wave pattern of the pound/dollar instrument implies a continuation of the instrument decline within the wave c. Thus, now I still recommend selling pounds sterling with targets located near the estimated levels of 1.2554 and 1.2360, which corresponds to 200.0% and 261.8% Fibonacci. With one clarification, I recommend waiting for the signal MACD for new sales. The material has been provided by InstaForex Company - www.instaforex.com |
| The oil market has experienced the worst week in the last six months Posted: 24 May 2019 05:24 AM PDT
According to experts, this week was the most disastrous for the black gold market in the last six months. Attempts to restore it on Friday, May 24, do not give a special result, although they can help avoid strong subsidence. Oil prices are trying to go "to the kings" after the collapse the day before. The cost of Brent increased by 0.87% to $68.57 per barrel. The price of WTI light oil rose 0.74% to $58.63 per barrel. The end of this week brought the oil quotes the most significant drop since January 2019. According to analysts, pressure on oil prices was exerted by such factors as the fear of a slowdown in the world economy and the growth of black gold reserves in the US to the highs since July 2017. Analyzing the incoming data on the oil market, experts record the rise in prices for short-term contracts. Experts come to the conclusion that such a picture is typical for a situation when the current production and sale of oil is more profitable than its storage and sale after a certain period of time. At the moment, market participants are following the actions of the two main figures in the trade conflict, the United States and China. They pay special attention to the degree of tension in relations between the two powers, believing that this confrontation will reduce the demand for black gold. At the end of this week, the margin of oil refineries in Asia (refineries) fell to its lowest level in ten years, experts say. Analysts fear that the trade conflict between the US and China will lead to a further collapse of oil prices, which is difficult to stop. Unfortunately, the "snowball" effect has not been canceled. According to experts of the analytical company London Capital Group, if Washington and Beijing do not come to a compromise in the near future, then a further rally in oil prices will be questionable. |
| The berries can be bitter: we expect local movement in the ranges of EUR/USD and USD/CAD pairs Posted: 24 May 2019 04:00 AM PDT Yesterday's collapse in crude oil prices, along with the fall of stock indices in Europe and the possibility of further negatively affect investor sentiment amid the protracted trade conflict between China and the United States may further, which ultimately will have an impact or rather already reflected in the real dynamics of the world economy, which is experiencing great difficulties with growth. The events of recent months clearly indicate that without reaching a compromise in the trade dispute between the Chinese and the Americans. The world economy will slow down in its growth, which in the future may lead to a new recession and economic crisis. Markets understand this and act on the basis of the logic of self-preservation, believing that the disputants will still have to agree. Indeed, everything is logical and correct but there are "but" that prevent it and can really be insurmountable, which can cause a new global economic crisis and complicated by the political opposition of countries. The first and most important "but" is too energetic and even one can say that Donald Trump's brazen pressure on China. The States in his person does not just want to crush an economic rival but it seems to crush him politically. As they say, this is already a bust and can simply exclude any possible agreement. The internal political confrontation of the US President with his opponents in the country pushes him to take radical and simply extremist actions on the outer contour, which will impede the achievement of a compromise. The desire of the opposing sides in an economic dispute to save face is a very important obstacle. In our opinion, investors' hopes may not be justified. There were too many events in history that seemed insignificant at first, illogical and simply wrong, but ultimately led to dire economic consequences and even wars. Investors are still hoping for common sense, which is why we don't see the hardest collapse in world markets, which so far are simply balancing. While it is difficult to say how it will end, But the consequences can really be unpredictable and very difficult. The crisis of 2008 may seem like flowers in this situation but the berries can be bitter. Forecast of the day: The EUR/USD pair seems to be trading again in the range. Investors are not yet ready to drive her to the floor amid hopes that the Fed will still have to start lowering rates this year. The pair is trading above the level of 1.1185 and may continue the local upward trend to 1.1260. The USD/CAD pair has been trading since the end of April in the range 1.3370-1.3500. An attempt to restore oil prices may lead to a decrease in the pair to the lower limit of the range at 1.3370. |
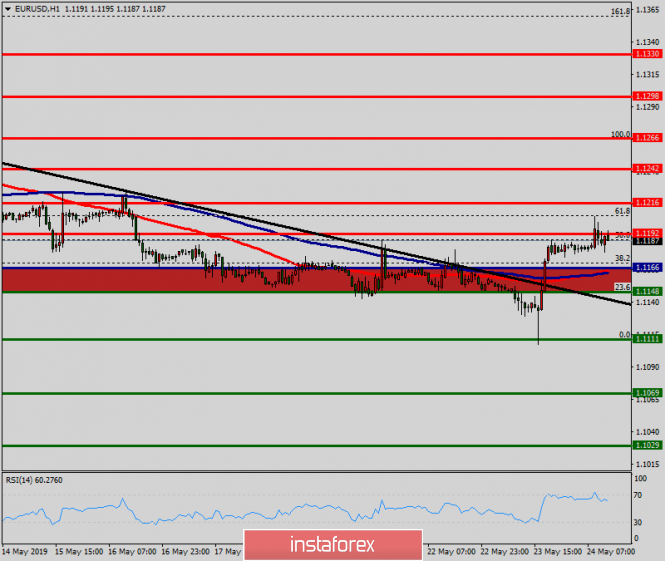
| Technical analysis of EUR/USD for May 24, 2019 Posted: 24 May 2019 03:51 AM PDT Pivot point: 1.1166. The EUR/USD pair continues to move downwards from the level of 1.1192. Last week, the pair dropped from the level of 1.1192 to the bottom around 1.1111. Today, the first resistance level is seen at 1.1192 followed by 1.1216, while daily support 1 is seen at 1.1111. According to the previous events, the EUR/USD pair is still moving between the levels of 1.1192 and 1.1111; for that we expect a range of 81 pips. If the EUR/USD pair fails to break through the resistance level of 1.1111, the market will decline further to 1.1069. This would suggest a bearish market because the RSI indicator is still in a positive area and does not show any trend-reversal signs. The pair is expected to drop lower towards at least 1.1069 with a view to test the second support. However, if a breakout takes place at the resistance level of 1.1192 (major resistance), then this scenario may become invalidated. The material has been provided by InstaForex Company - www.instaforex.com |
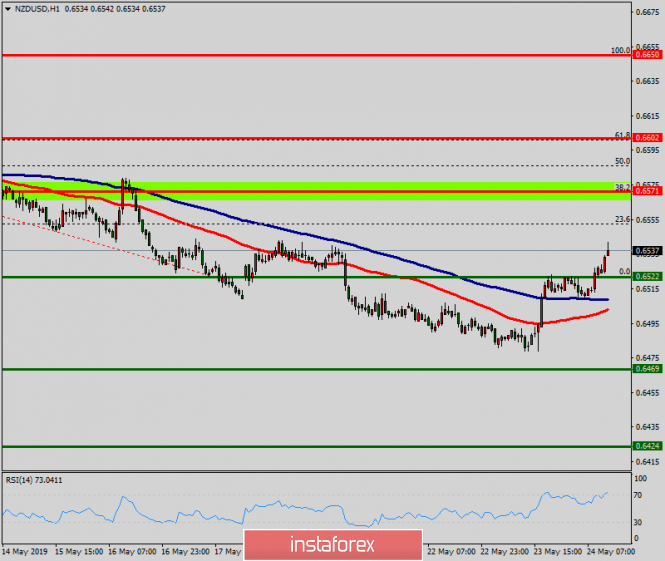
| Technical analysis of NZD/USD for May 24, 2019 Posted: 24 May 2019 03:47 AM PDT The NZD/USD pair is showing signs of weakness following a breakout of the lowest level of 0.6571. On the H1 chart, the level of 0.6571 coincides with 38.2% of Fibonacci, which is expected to act as minor resistance today. Since the trend is below the 38.2% Fibonacci level, the market is still in a downtrend. However, the resistance is seen at the level of 0.6571. Furthermore, the trend is still showing strength above the moving average (100). Thus, the market is indicating a bearish opportunity below the above-mentioned support levels, for that the bearish outlook remains the same as long as the 100 EMA is headed to the downside. Therefore, resistance will be found at the level of 0.6571 providing a clear signal to buy with a target seen at 0.6500. If the trend breaks the first supprt at 0.6500, the pair is likely to move downwards continuing the bearish trend development to the levels 0.6469 and 0.6424. The material has been provided by InstaForex Company - www.instaforex.com |
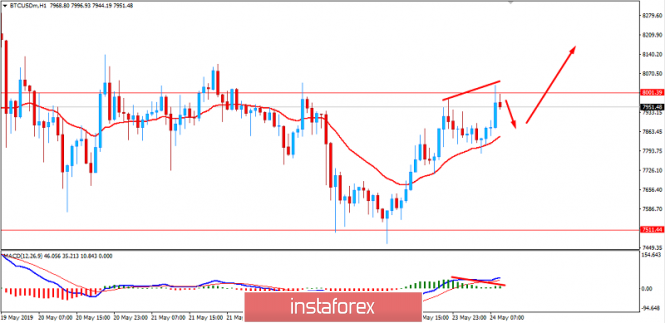
| Bitcoin regains momentum to reside at $8,000 again, May 24, 2019 Posted: 24 May 2019 02:50 AM PDT Bitcoin managed to regain momentum after a certain throwback towards $7,500 area recently. The price is currently residing at the edge of $8,000 and after certain corrections along the way, the price is expected to resume a rise in the coming days. BTC failed to break the resistance at $8,300 after several attempts, so it started a move downwards that looked convincing. It reached an intraday low of just over $7,500 before turning around and marching back upwards. The crypto market dumped around $15 billion as a result. It appears to have settled back in the channel and may well remain there for a few more days. Many traders and investors are still waiting for this to occur as prices have been surging upwards without any significant retreat since early February. Last Friday's flash crash knocked just 15 percent of bitcoin price, so a larger correction is still expected. Overall, the crypto market has rebounded as another correction gets recovered. The big dip from yesterday was expected to accelerate today and throughout the weekend, but bitcoin and its brethren appear to have settled at higher levels of support and have managed to reach the resistance area of $8000 area again. So far, the total market capitalization has been back over $240 billion as a result. As of the current scenario, the price is showing certain bearish pressure off the $8,000 area while forming the Bearish Continuous Divergence along the way. It indicates certain retrace towards the dynamic level of 20 EMA i.e. at $7,800 area. If the price shows any further evidence of bullish momentum off the rejection to the dynamic level of 20 EMA, i.e. $7,800 area, the price will possibly break above $8,000 and shoot for the $8,300 resistance area again in the coming days. As the price remains above $7,500 area with a daily close, the impulsive bullish pressure is expected to continue. SUPPORT: 7,500, 7,800 RESISTANCE: 8,000, 8,300 BIAS: BULLISH MOMENTUM: VOLATILE
|
| Trading Plan for EUR/USD pair on 05/24/2019 Posted: 24 May 2019 02:45 AM PDT EUR/USD trend: signal to the top Two events had an impact on the market: Theresa May's resignation statement, which is expected Friday. It gives hope for a way out of the endless crisis around Brexit. Second: The US stock market showed a strong decline. At the same time, the yield of treasuries plummeted, this changes the situation against the dollar. The EUR/USD rate has broken up a key maximum of 1.1190. The beginning of the big trend will be a breakthrough above 1.1270. We buy from 1.1190. |
| We waited for a rebound (a review of EUR / USD and GBP / USD on 05/24/2019) Posted: 24 May 2019 01:29 AM PDT You should never forget about the overbought or oversold of a particular currency, especially when it comes to the dollar. The longer the correction is delayed, the stronger and more unexpected the rebound. That is exactly what happened yesterday. At first, the dollar continued to grow steadily, supported by weak and rather strange preliminary data on European business activity indices. In particular, the composite index of business activity rose from 51.5 to 51.6, while they expected growth to 51.7. However, as a composite index could grow, it remains a mystery. The fact is that the business activity index in the service sector has decreased from 52.8 to 52.2, and the production index from 47.9 to 47.7. So it is completely incomprehensible how something can increase if all its component parts have decreased. Apparently, this is some kind of new European mathematics. But shortly before as similar data for the United States should have been published, the dollar began to grow at an incredible rate. Like someone knew something. And as soon as the data was published, this spring, which was compressed for nearly two weeks in a row, fired so that a little more - and one could see the stratosphere. After all, the business activity index in the manufacturing sector decreased from 52.6 to 50.6, and in the services sector from 53.0 to 50.9, which led to a decrease in the composite index of business activity from 53.0 to 50.9. A little later, the data on sales of new homes has already decreased by 6.9%, which only heightened negative emotions. It is also noteworthy that the market tritely ignored data on applications for unemployment benefits, the total number of which increased by 13 thousand. But they went out to business activity indices and sales of new homes. This happened due to an increase of 14 thousand in the number of repeated applications for unemployment benefits. Also, the number of initial applications decreased by 1 thousand. Apparently, it is time for Markit to seriously think about internal security and to check his employees for friendly gatherings with the Wall Street guys. Theresa May's resignation is expected on June 10. After all, in fact, the British Prime Minister has no other choice, since she even understands that for the fourth time, the version of the "divorce" agreement with the European Union that she proposes will be rejected. And this time, perhaps, with a crushing score, for even the general provisions of this very agreement are completely rejected by both the conservatives and the laborers. Moreover, her own partners in the Conservative Party gently hinted that it would be better to leave in a good way, otherwise she would be asked to leave the office of the prime minister. In short, what happened was not quite scandalous. In any case, it is obvious that Brexit will have to deal with her changer, and there will be no definite time for any negotiations with Europe, which, moreover, has made it clear that there will be no more negotiations and changes to the proposed version of the agreement. Therefore, someone else will be responsible for the unregulated Brexit, with all its remarkable implications for the economy of the United Kingdom. But the concern is not only this endless political booth, but also the real state of affairs. Indeed, in the UK, retail sales data is also published, the growth rate of which should slow down from 6.7% to 4.6%. So the dollar has a reason for growth not only because of the uncertainty that awaits Europe in the event of an unregulated Brexit, but also because of weak British statistics. However, it will not be too long to rejoice. Thus, the single European currency is likely to be waited first by a decline to 1.1150, followed by a return to 1.1200. The scenario for the pound is about the same, and first we are waiting for a decline to 1.2625, and then a return to 1.2675. |
| Trading recommendations for the GBPUSD currency pair - prospects for further movement Posted: 24 May 2019 01:27 AM PDT For the last trading day, the currency pair pound / dollar showed a low volatility of 78 points, which was expressed in the slowdown and subsequent pullback. From the point of view of technical analysis, we see that the quotation slowed down after reaching the key level of 1.2620, and then moved into the rollback stage smoothly. Overall plan: for three weeks we watched a not tedious descending movement, having as a result more than 550 points without any correction, whether the quote overheated is unconditional. Oversold, overheating - these words have tormented traders for more than one day, so what, the correction has come? The question is, of course, a philosophical one, but we will return to it later. Now, let's talk about the news flow. Brexit background has been densely populated in the market and in the minds of speculative investors, even when we don't have any statements made by dignitaries, the market still reacts cautiously to everything and is more prone to draining the pound. From the news feed, we had statistics on new home sales in the United States, where we were expected to receive a decline, but stronger: Prev. 8.1% --- Prog. -2.8% ---- Fact. -6.9%, perhaps against this background, the oversold pound received at least some support. Today, in terms of the economic calendar, we have statistics on UK retail sales, where there is nothing good. According to forecasts, they expect a decline from 6.2% to 4.2%. In the afternoon, there will be data on the volume of orders for durable goods in the United States, where they also expect a decline from 2.8% to -2.0%. As it turns out, the outgoing data for both countries, frankly, not very much. The first thing that comes to mind is a temporary dragging in the form of a tug of trading power. What can put additional pressure is the information background, which can set the direction. If we look in more detail at this moment, we see that the British Prime Minister Theresa May will announce her resignation from the post of leader. The upcoming trading week in terms of the economic calendar is empty. The week starts with a day off in the United States and the UK, although some kind of activity begins only on Thursday, where the data on US GDP will be released, and, in principle, everything. In any case, at least a week has a modest amount of statistical data in it, do not forget that the information background does not sleep. Monday Closed: USA - Memorial Day Closed: UK - Spring Bank Holidays Thursday United States 12:30 UTC+00 - GDP (q / q) (Q1): Prev. 3.2% ---> Forecast 3.1% United States 12:30 UTC +00 - The number of initial claims for unemployment benefits United States 14:00 UTC +00 - Index of pending sales in the real estate market (m / m) (Apr): Prev. 3.8% ---> Forecast 1.1% Friday United Kingdom 8:30 Universal time - The volume of mortgage lending (Apr): Prev. 4.12V ---> Forecast 3.54 These are preliminary and subject to change. Further development Analyzing the current trading schedule, we see that the quotation is trying to correct, but on its way there is a periodic value of 1.2690 and a huge information and news background that holds it. The first thing we are considering is a temporary fluctuation within 1.2620 / 1.2700. Then we are already analyzing the outgoing information flow, in particular, the reaction to Theresa May. There are not so many options for the price behavior. Thus, we will either stay within the range, or quickly break through it. Our methodology will be incorporated in the form of analysis of fixation points outside the expected boundaries, and then entering the market. Based on the available data, it is possible to decompose a number of variations. Let's consider them: - Buying positions will be considered in case of price fixing higher than 1.2700. - Sell positions will be considered in the case of price fixing lower than 1.2590, with a prospect of 1.2500, the first point. Indicator Analysis Analyzing a different sector of timeframes (TF), we see that indicators in the short-term perspective jump arbitrarily, with respect to current indicators, interest is descending. Intraday perspective has changed interest from descending to ascending due to rollback. The medium-term outlook keeps the downward interest on the general decline. Weekly volatility / Measurement of volatility: Month; Quarter; Year Measurement of volatility reflects the average daily fluctuation, based on monthly / quarterly / year. (May 24, was based on the publication of the article) The current time volatility is 36 points. If the information background puts pressure on the market, then the volatility will quickly overcome the average daily value, otherwise we will be trapped in a range, relative to which and see the current volatility. Key levels Zones of resistance: 1.2620; 1.2770 **; 1.2880 (1.2865-1.2880) *; 1.2920 * 1.3000 **; 1.3180 *; 1,3300 **; 1.3440; 1.3580 *; 1.3700 Support areas: 1.2620; 1,2500 *; 1.2350 **. * Periodic level ** Range Level The material has been provided by InstaForex Company - www.instaforex.com |
| EUR / USD: the dollar has ceased to receive dividends from the trade war Posted: 24 May 2019 12:46 AM PDT The dollar index soared to its two-year highs yesterday, marking in the area of 98 points. The surge in volatility was primarily due to investors' concerns about China's retaliatory steps in a trade war. However, the dollar did not remain "on horseback" for long. An hour after reaching the peak values, the greenback collapsed throughout the market, especially with respect to defensive assets. Although the US currency is usually in demand during periods of global tensions taking into account possible countermeasures from China, which in this case, investors were afraid to invest in the dollar. Rumors that Beijing could use its advantage in the market of rare metals excited traders, after which the stock market significantly decreased, pulling the greenback and the yield on 10-year Treasuries. Consequently, the US stock indices slipped yesterday by 1.1-1.6% against the background of investors' concerns about the aggravation of the trade conflict between the United States and China. For example, the Dow Jones industrial index fell by 1.11%, (to 25,490.4) points, the NASDAQ high-tech companies index - by 1.58%, to 7,628.28 points, and the S&P 500 broad market index - by 1.19%, (up to 2822.24 points). The yield on 10-year Treasury securities fell from 2.42% to 2.32%, which was the minimum value since October 2017. Macroeconomic reports that came out in the red zone yesterday also put pressure on the dollar. According to data published yesterday, sales of new buildings in the United States decreased by 6.9% to 673 thousand compared to the revised March figure. This is the weakest result since December of the year before. According to preliminary estimates with the updated multi-year lows and a composite US PMI, it collapsed to 50.9 points in May with a forecast of growth to 53.6 points in April. An increase to 53 points was recorded. The indicator came close to the key mark of "50", which is the boundary between the improvement and the deterioration of the situation in the business sphere. According to one of the experts, the rate of created business projects showed the lowest result since the 2008 crisis. Although the macroeconomic data published yesterday are of a secondary nature, they added to the alarming fundamental picture. According to most analysts, the further conflict between the US and China will lead to the fact that economic growth in America will slow down. According to investors, Chinese countermeasures may cause more significant damage to the US economy than previously thought. Yttrium, scandium, erbium, lanthanum, lanthanoids - all these little-known names of representatives of rare-earth metals suddenly appeared to be heard by traders. After all, experts believe that it is in this area that Beijing can strike back with an economic blow to the States. The fact is that China annually produces more than 100 thousand tons of rare-earth metals, which in turn amounts to more than 80% of the total world production. Such a monopoly position in the RMZ market allows Beijing to "show its teeth" in a trade war. An embargo or restriction of the export of rare-earth metals from the PRC will deal a severe blow to the American technological sector. These metals are actively used in radio electronics, instrument making, nuclear engineering, mechanical engineering, chemical industry, and metallurgy. RMZ is used almost everywhere, even in the production of mobile phones. In other words, China has a powerful Trump card in the trade conflict and is fully capable of using it - at least the unexpected visit of the PRC leader to one of the enterprises for processing RMZ eloquently testifies to this. At the same time, Beijing proposed to resume negotiations through its diplomats but on condition of "equality of the parties". What exactly is behind this general demand can only be guessed, but at the same time it is obvious that Beijing will demand additional concessions from the Americans. So far, the White House is not ready to take such steps and at the same time, the recent actions of Washington suggest the opposite. In particular, it became known that the States, following Huawei, can also blacklist the Chinese corporation Hikvision yesterday. This company is one of the world's largest manufacturers of video surveillance equipment. It is worth noting that immediately after the introduction of sanctions against Huawei, Washington took a step back, issuing the appropriate 90-day license to the Chinese. However, these are not signs of a "thaw" in relations between the PRC and the United States since the trade war is in full swing. Apparently, it has moved to a "technological level". Such metamorphoses were not to the liking of dollar bulls, which are forced to follow the stock market and the yield of 10-year-old treasuries. All of these allow buyers of EUR/USD pair to divert the price from the base of the 11th figure, protecting themselves from stalling in the 10th figure and below. The single currency is still helpless, thus the corrective growth of the pair is due only to the weakness of the dollar. Currently, traders are testing a resistance level of 1.1190 (the middle line of the Bollinger Bands indicator, which coincides with the Tenkan-sen and Kijun-sen lines). If the EUR/USD bulls overcome this target, they can count on the assault on the upper line of the Bollinger Bands, which corresponds to the price of 1.1235. When consolidating above, the pair will finally return to its "April range" of 1.1240-1.1310. The material has been provided by InstaForex Company - www.instaforex.com |
| Burning forecast EURUSD 05/24/2019 Posted: 24 May 2019 12:20 AM PDT On Thursday, the EURUSD broke through the long-term lows of 1.1130 and 1.1110. However, it sharply turned up and approached the key level upwards of 1.1190 at the end of the day. On Friday morning, the euro broke through the level of 1.1190. This is a strong signal for an upward turn, and perhaps a signal for an upward trend. We need to look at the closing of the day - in the case of closing above 1.1190 - the probability of an upward trend will increase. We buy from 1.1190 with a target of 1.2000. |
| Indicator analysis. Daily review for May 24, 2019 for currency pairs EUR / USD and GBP / USD Posted: 24 May 2019 12:20 AM PDT On Thursday, the market in both currencies moved in different directions. The GBP / USD pair has gradually shifted to the side channel after a strong trend. The first sign of a pullback. The rollback level of 76.4% - 1.2662 (blue dashed line) was retested. The EUR / USD pair, moving down before lunch, tested the lower fractal - 1.1108 (yellow dotted line). But then, the most interesting thing happened. Having gone up to the pullback, the price received a powerful support in the form of a foundation. As a result - a rally upwards by 81 points. On Friday, strong calendar news come out at 8.30 (pound), 12.30 (US dollar) Universal time. Trend analysis (Fig. 1). Today, the price will continue to move upward with the first target of 1.1204 (blue dashed line) - the pullback level of 61.8% and then move further upwards to the resistance line of 1.1234 (white thin line). Fig. 2 (daily schedule). Comprehensive analysis: - indicator analysis - up; - Fibonacci levels - up; - volumes - up; - candlestick analysis - up; - trend analysis - down; - Bollinger lines - down; - weekly schedule - down. General conclusion: On Friday, we are expecting a pullback upward movement. The first upper target of 1.2689 is the pullback level of 14.6% (yellow dotted line). The material has been provided by InstaForex Company - www.instaforex.com |


| You are subscribed to email updates from Forex analysis review. To stop receiving these emails, you may unsubscribe now. | Email delivery powered by Google |
| Google, 1600 Amphitheatre Parkway, Mountain View, CA 94043, United States | |
No comments:
Post a Comment