
Forex analysis review |
- Fractal analysis of major currency pairs for May 28
- USD/CHF approaching resistance, potential drop!
- AUD/USD approaching resistance, potential reversal coming!
- USD/JPY near key support, a bounce is possible!
- EUR / USD: trade war does not allow the dollar to grow, but the euro is in no hurry to strengthen
- What to expect from USD / JPY in June?
- May 27, 2019 : GBP/USD Intraday technical analysis and trade recommendations.
- May 27, 2019 : EUR/USD Intraday technical analysis and trade recommendations.
- Vertex Conqueror: Bitcoin is growing steadily, exceeding the annual maximum
- Trading recommendations for the EUR/USD currency pair - placement of trading orders on May 27
- Technical analysis of USD/CAD for May 27, 2019
- Technical analysis of EURUSD for May 27, 2019
- Bitcoin analysis for May, 27.2019
- Technical analysis of USD/CHF for May 27, 2019
- Technical analysis of Gold for May 27, 2019
- GBP / USD plan for the American session on May 27. Enthusiasm of pound buyers is diminishing
- GBP/USD analysis for May, 27.05.2019
- EUR/USD plan for the US session on May 27. Buyers are preparing the lower level of the new rising channel
- Analysis of Gold for May, 27.2019
- Wave analysis of EUR / USD and GBP / USD for May 27. We are waiting for the new fall of the euro and pound sterling
- Review for the "Regression Channels" system for GBP/USD pair on May 27: rexit party won the European Parliament election
- Results of the elections to the European Parliament only slightly differed with the forecasts
- Review for the "Regression Channels" system for EUR/USD pair on May 27: Eurocurrency prospects are still vague
- Bitcoin: When will it reach 9,000?
- Simplified wave analysis for GBP / USD and AUD / USD pairs and forecast on May 27
| Fractal analysis of major currency pairs for May 28 Posted: 27 May 2019 07:51 PM PDT Forecast for May 28: Analytical review of H1-scale currency pairs: For the euro / dollar pair, the key levels on the H1 scale are: 1.1269, 1.1248, 1.1217, 1.1206, 1.1191, 1.1167, 1.1154 and 1.1136. Here, the price forms the potential initial conditions for the upward movement of May 23. Continuation of the movement to the top is expected after the breakdown of 1.1191. In this case, the goal is 1.1206, wherein consolidation isn near this level. The price passage of the noise range 1.1206 - 1.1217 must be accompanied by a pronounced upward movement. In this case, the target is 1.1248. For the potential value for the top, we consider the level of 1.1269. After reaching which, we expect a rollback to the bottom. Short-term downward movement is possible in the range of 1.1167 - 1.1154. The breakdown of the last value will lead to a prolonged correction. Here, the goal is 1.1136. This level is a key support for the top. The main trend is the formation of initial conditions for the top of May 23. Trading recommendations: Buy 1.1191 Take profit: 1.1206 Buy 1.1218 Take profit: 1.1246 Sell: 1.1167 Take profit: 1.1155 Sell: 1.1153 Take profit: 1.1136 For the pound / dollar pair, the key levels on the H1 scale are: 1.2811, 1.2737, 1.2693, 1.2612, 1.2553, 1.2478 and 1.2428. Here, the price is still in equilibrium: a downward structure of May 21, as well as the formation of a potential of May 23. Continuation of the movement to the bottom is expected after the breakdown of 1.2612. Here, the target is the level of 1.2553. The breakdown of which must be accompanied by a pronounced downward movement. In this case, the target is 1.2478. We consider the level of 1.2428 to be a potential value for the bottom. Upon reaching this level, we expect a consolidation in the range of 1.2478 - 1.2428, as well as a departure to a correction. Short-term upward movement is possible in the range of 1.2693 - 1.2737. The breakdown of the latter value will have to form an upward movement. Here, the target is the level of 1.2811. The main trend is the equilibrium situation. Trading recommendations: Buy: 1.2693 Take profit: 1.2735 Buy: 1.2738 Take profit: 1.2810 Sell: 1.2612 Take profit: 1.2555 Sell: 1.2550 Take profit: 1.2478 For the dollar / franc pair, the key levels on the H1 scale are: 1.0086, 1.0062, 1.0045, 1.0023, 1.0010, 0.9991 and 0.9978. Here, we are following the formation of the downward structure of May 22. Continuation of the movement to the bottom is expected after the price passes the noise range of 1.0023 - 1.0010. In this case, the target is the level of 0.9991. For the potential value for the bottom, we consider the level of 0.9978. After reaching which, we expect a consolidation. Short-term upward movement is possible in the range of 1.0045 - 1.0062. The breakdown of the latter value will lead to a prolonged correction. Here, the target is the level of 1.0086. This level is a key support for the downward structure. The main trend is the development of the downward structure of May 22. We expect the registration of large initial conditions. Trading recommendations: Buy : 1.0045 Take profit: 1.0060 Buy : 1.0062 Take profit: 1.0086 Sell: 1.0010 Take profit: 0.9991 Sell: 0.9990 Take profit: 0.9978 For the dollar / yen pair, the key levels on the scale are : 110.21, 109.94, 109.73, 109.36, 109.14, 108.98 and 108.51. Here, the price forms the medium-term initial conditions for the downward cycle of May 21. Continuation of the movement to the bottom is expected after the breakdown of 109.36. In this case, the goal is 109.14, wherein consolidation is near this level. The price pass of the noise range of 109.14 - 108.98 should be accompanied by a pronounced downward movement. Here, the goal is 108.51. Near this level, we expect a consolidation and a possible rollback to the correction. Short-term upward movement is possible in the range of 109.73 - 109.94. The breakdown of the latter value will lead to in-depth correction. Here, the goal is 110.21. This level is a key support for the downward cycle. The main trend: the formation of medium-term initial conditions for the downward cycle of May 21. Trading recommendations: Buy: 109.73 Take profit: 109.92 Buy: 109.95 Take profit: 110.20 Sell: 109.36 Take profit: 109.15 Sell: 108.98 Take profit: 108.51 For the Canadian dollar / US dollar pair, the key levels on the H1 scale are: 1.3611, 1.3556, 1.3534, 1.3503, 1.3474, 1.3428, 1.3409, 1.3387 and 1.3355. Here, the price forms the medium-term initial conditions for the upward cycle of May 22. Continuation of the development of this structure is expected after the breakdown of the level of 1.3474. In this case, the first target is 1.3503. The breakdown of which, in turn, will lead to a movement to the level of 1.3534, wherein consolidation is near this level. The price passage of the noise range 1.3534 - 1.3556 should be accompanied by a pronounced upward movement. Here, the potential target is the level of 1.3611. Short-term downward movement is possible in the range of 1.3428 - 1.3409. The breakdown of the latter value will lead to a prolonged correction. Here, the target is the level of 1.3388. This level is a key support for the top. The main trend is the formation of medium-term initial conditions for the upward cycle of May 22. Trading recommendations: Buy: 1.3474 Take profit: 1.3501 Buy : 1.3503 Take profit: 1.3534 Sell: 1.3426 Take profit: 1.3410 Sell: 1.3408 Take profit: 1.3388 For the pair Australian dollar / US dollar, the key levels on the H1 scale are : 0.7013, 0.6994, 0.6965, 0.6955, 0.6941, 0.6910, 0.6897, 0.6882 and 0.6863. Here, the price forms the expressed initial conditions for the top of May 23. Continuation of the movement to the top is expected after the breakdown 0.6941. Here, the first goal is 0.6955, near this level is a price consolidation. The price passage of the noise range of 0.6955 - 0.6965 should be accompanied by a pronounced upward movement. In this case, the target is the level of 0.6994. For the potential value for the top, we consider the level of 0.7013. After reaching which, we expect a rollback to the bottom. Short-term downward movement is possible in the range of 0.6910 - 0.6897. The breakdown of the latter value will lead to a prolonged movement. Here, the target is the level of 0.6882. This level is a key support for the upward structure. The main trend is the formation of initial conditions for the top of May 23. Trading recommendations: Buy: 0.6941 Take profit: 0.6955 Buy: 0.6967 Take profit: 0.6992 Sell : 0.6910 Take profit : 0.6898 Sell: 0.6895 Take profit: 0.6884 For the euro / yen pair, the key levels on the H1 scale are: 123.29, 122.92, 122.72, 122.12, 121.76, 121.54 and 120.96. Here, the price forms the expressed initial conditions for the downward cycle of May 21. Continuation of the movement to the bottom is expected after the breakdown of 122.12. In this case, the goal is 121.76, wherein consolidation is near this level. Meanwhile, in the range of 121.76 - 121.54, there is a short-term downward movement. The breakdown of the last value will allow to count on the movement towards a potential target - 120.96. From this level, we expect a rollback to the top. Short-term upward movement is possible in the range of 122.72 - 122.92. The breakdown of the latter value will lead to a prolonged correction. Here, the goal is 123.29. This level is a key support for the downward structure. The main trend is the formation of medium-term initial conditions for the downward cycle of May 21. Trading recommendations: Buy: 122.72 Take profit: 122.90 Buy: 122.93 Take profit: 123.25 Sell: 122.12 Take profit: 121.78 Sell: 121.74 Take profit: 121.55 For the pound / yen pair, the key levels on the H1 scale are : 140.18, 139.51, 139.14, 138.70, 138.36, 137.49 and 136.85. Here, we are following the development of the downward structure of May 21. Continuation of the movement to the bottom is expected after the passage of the price of the noise range 138.70 - 138.36. In this case, the goal is 137.49, wherein consolidation is near this level. For the potential value for the bottom, we consider the level of 136.85. After reaching which, we expect to go into a correction. Short-term upward movement is possible in the range of 139.14 - 139.51. The breakdown of the latter value will lead to a prolonged correction. Here, the goal is 140.18. This level is a key support for the downward structure. The main trend is a local downward structure of May 21. Trading recommendations: Buy: 139.15 Take profit: 139.50 Buy: 139.55 Take profit: 140.10 Sell: 138.34 Take profit: 135.55 Sell: 137.46 Take profit: 136.90 The material has been provided by InstaForex Company - www.instaforex.com |
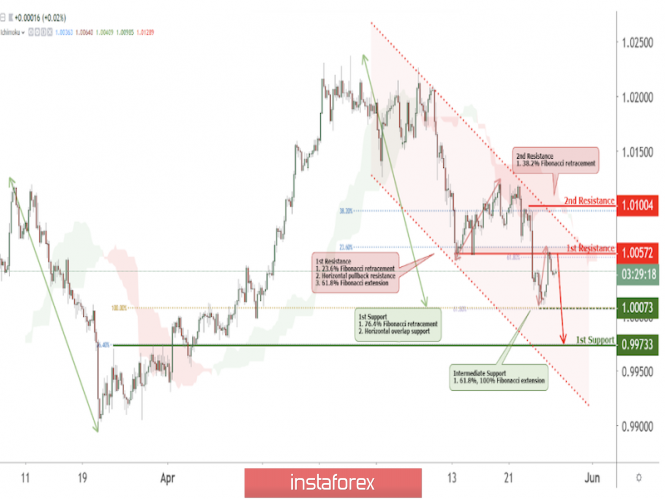
| USD/CHF approaching resistance, potential drop! Posted: 27 May 2019 06:57 PM PDT
Price is approaching our first resistance level. Entry : 1.0057 Why it's good : Horizontal overlap resistance, 23.6% Fibonacci retracement, descending channel, 61.8% Fibonacci extension Stop Loss : 1.0100 Why it's good : horizontal swing high resistance, 38.2% Fibonacci retracement Take Profit : 0.9973 Why it's good : 76.4% Fibonacci retracement, horizontal overlap support
|
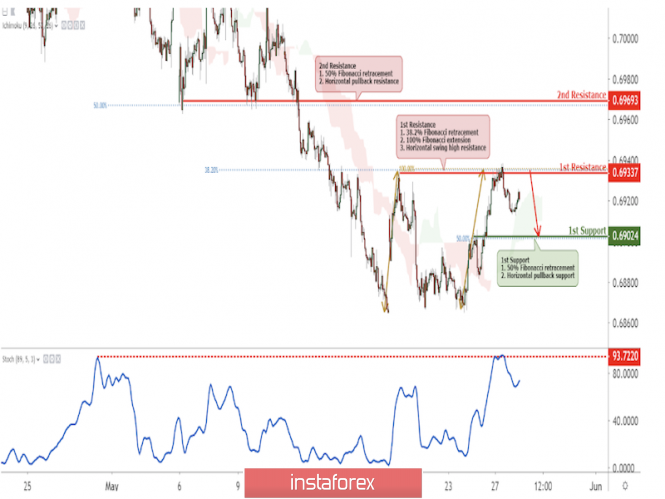
| AUD/USD approaching resistance, potential reversal coming! Posted: 27 May 2019 06:55 PM PDT
Price is approaching our first resistance where we might see a corresponding drop in price. Entry : 0.6933 Why it's good : 38.2% Fibonacci retracement, 100% Fibonacci extension, horizontal swing high resistance Stop Loss : 0.6969 Why it's good : 50% Fibonacci retracement, Horizontal pullback resistance Take Profit : 0.6902 Why it's good : Horizontal pullback support, 50% Fibonacci retracement
|
| USD/JPY near key support, a bounce is possible! Posted: 27 May 2019 06:52 PM PDT |
| EUR / USD: trade war does not allow the dollar to grow, but the euro is in no hurry to strengthen Posted: 27 May 2019 05:03 PM PDT Last week, Greenback updated its multi-month highs, but ended with a decline against most major currencies. This reversal, apparently, made many think about what happened. The dollar, considered a safe-haven asset, usually responds by reinforcing the risk aversion, the indicator of which is the fall in the value of stocks and oil prices. However, this time, the USD rate was falling along with Wall Street and oil, not paying attention to the growth of treasury yields. Why is everything turned upside down? According to experts, the reasons should be sought in the dual nature of the dollar. On the one hand, it acts as a defensive asset that investors turn to when global risks increase. On the other hand, greenbacks are the national currency, and they buy it when they believe that the American economy is stronger than the rest. However, the protracted trade war between Washington and Beijing makes investors increasingly doubt that the United States will win, other things being equal, which is why the dollar falls along with stocks and raw materials. "There is a thin line somewhere between the dollar as a defensive asset, which is bought as soon as the word "tariff" shakes the air in the market, and the dollar, which should pay attention to how the prospects of the American economy, are tied to a trade conflict that threatens to develop into a technological cold war." analysts say. However, the recent decline of the "American" also found a quite banal explanation: closing long USD positions at the reached maximums on the threshold of a three-day weekend in the USA and the UK. That is, market participants simply decided to cut the dollar "longs" to reduce risks. It is assumed that in the coming days, Greenback will be able to play all back. EUR/USD spent most of the past week in a narrow range. The maximum range of its fluctuations did not exceed 45 points. The turning point was the publication on Thursday of releases on business activity in the EU and the USA. All indicators turned out to be worse than expected, but if European statistics showed only local deterioration, the American data came out rather disappointing. Against this background, the EUR/USD pair stopped the downward trend and returned above the 1.12 mark. One of the key topics at the opening of this week was the results of elections to the European Parliament. According to preliminary data, a group of representatives of eurosceptics (Le Pen bloc in France, the Italian League of the North, the British movement Brexit, right-wing conservative ESPD) managed to get more seats than in the 2014 elections, but most seem to remain with the united group of Euro-optimists and centrists. It is expected that the EU will continue to pursue a policy of integration in the face of a common threat in the form of American protectionism, which means that there is no need to worry about the collapse of the currency bloc. At the same time, the health status of the eurozone economy still raises questions. The latest data on business activity and business climate signal a slowdown in the region's GDP. Before the May "tweets" of the head of the White House Donald Trump about raising tariffs for Chinese imports, a foundation was created for restoring the upward trend in the euro. It would seem that the economies of the Middle Kingdom and the Eurozone began to grope the bottom, and investors became confident that Washington and Beijing would soon end the trade war. However, in late spring, the situation changed radically. Apparently, the time for a confident rally of EUR/USD has not yet arrived, so it makes sense to rely on the medium-term consolidation in the range of 1.1-1.15. |
| What to expect from USD / JPY in June? Posted: 27 May 2019 04:56 PM PDT If the market initially believed in saving a trade, now hopes are scattered. The absence of a trade agreement between the United States and China, as well as the option of a protracted technological war between the two largest economies, form a bearish mood. As the leading strategists of the world, including Citigroup, note, the worst outcome of the trade dispute is not yet priced in, so you should take a closer look at buying the US dollar against Asian currencies. The Chinese authorities advised traders not to play against the yuan, since losses, in their opinion, would be inevitable. The Central Bank of the Celestial Empire uses a larger arsenal of tools available to it, and the national currency may rise significantly in the short term. At the same time, in May, the yuan fell by 2.6% against the dollar, and the indicator, which assesses the willingness of traders to bet on its further decline against other Asian currencies, peaked in history. Traders are set to sell Chinese currency. On Monday, the dollar / yuan pair was trading at $ 6.9094. It is worth noting that the American currency, like the medal, has two sides. The first is a protective one, peculiar to it as a world reserve currency. A dollar is bought when risks increase in other countries or the world. The second is national. They buy it when they believe in the American economy, namely that it is stronger than others. A trade war forces market participants to doubt America's steadfastness. According to published data, US GDP also suffers losses due to trade wars. Given the signs of a slowdown, market expectations are increasing with respect to the Fed rate cut this year. In this regard, the dollar behaves cyclically - repeats the movement of shares. On Monday, the dollar / yen pair slightly increased in price due to the growth of the stock market. It looks like Donald Trump is in high spirits during his visit to Tokyo. This eases concerns about a bilateral trade deal and puts pressure on the yen. According to Trump, the United States has made "significant progress" in negotiations with Japan, but the deal can take place only after the July elections in the Land of the Rising Sun. Despite attempts at recovery, the dollar / yen pair is unlikely to grow. The market is not showing any appetite for risk. As it approaches $ 110, the dollar, in conjunction with the yen, faces a key level of resistance. Recovery by the end of May above the upper levels of $ 109 will indicate that the pair has found support, and a breakthrough below will pave the way for the development of the downward trend in June. As for the yen as a whole, in case of erroneous market behavior regarding long-term US Treasury securities, cross-pairs with the Japanese currency can seriously change direction. It is worth observing whether the new minima of the American profitability will retain the status of the main matching indicator. The material has been provided by InstaForex Company - www.instaforex.com |
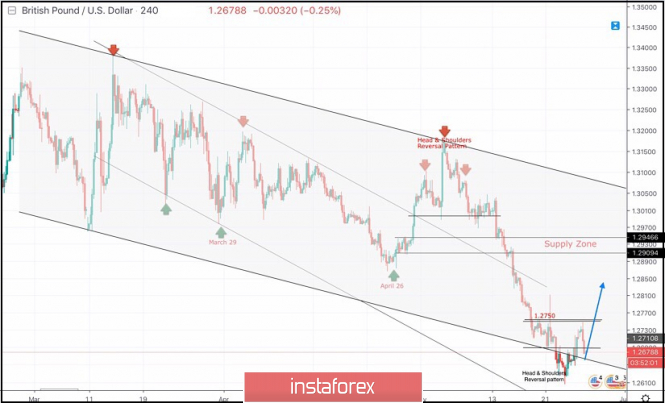
| May 27, 2019 : GBP/USD Intraday technical analysis and trade recommendations. Posted: 27 May 2019 10:19 AM PDT
On March 29, a visit towards the price levels of 1.2980 (the lower limit of the newly-established bearish movement channel) could bring the GBPUSD pair again towards the upper limit of the minor bearish channel around (1.3160-1.3180). Since then, Short-term outlook has turned into bearish with intermediate-term bearish targets projected towards 1.2900 and 1.2850. On April 26, another bullish pullback was initiated towards 1.3000 (the same bottom of March 29) which has been breached to the upside until May 13 when a bearish Head and Shoulders pattern was demonstrated on the H4 chart with neckline located around 1.2980-1.3020. Bearish persistence below 1.2980 enhanced further bearish decline. Initial bearish Targets were already reached around 1.2900-1.2870 (the backside of the broken channel) which failed to provide any bullish support for the pair. Further bearish decline was demonstrated towards the lower limit of the long-term channel around (1.2700-1.2650). The GBPUSD pair looks oversold around the current price levels (1.2650-1.2700). That's why, SELL signals shouldn't be considered at such low prices. On the other hand, bullish persistence above 1.2690 and 1.2750 is needed to enhance the bullish side of the market towards 1.2870 (Bottom of April 26). Trade Recommendations: Conservative traders should wait for another bullish pullback towards 1.2870-1.2905 (newly-established supply zone) to look for valid sell entries. S/L should be placed above 1.2950. Counter-trend traders can consider the recent bullish breakout above 1.2690-1.2700 as a signal to look for a valid BUY entry around the current price levels. T/P level to be located around 1.2750 and 1.2820. S/L to be located below 1.2640. The material has been provided by InstaForex Company - www.instaforex.com |
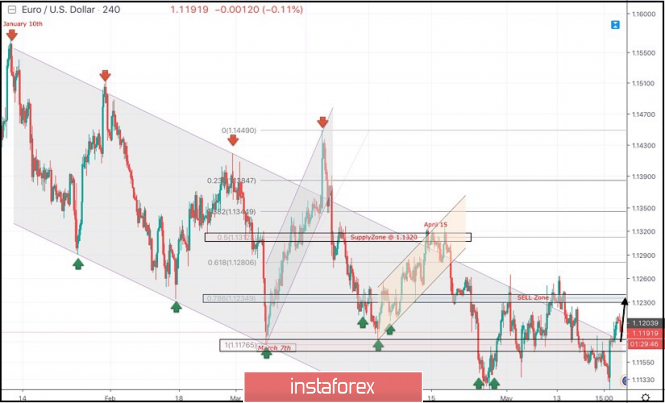
| May 27, 2019 : EUR/USD Intraday technical analysis and trade recommendations. Posted: 27 May 2019 09:05 AM PDT
Since January 10, the EURUSD pair has been moving within the depicted channel with slight bearish tendency. Few weeks ago, a bullish Head and Shoulders reversal pattern was demonstrated around 1.1200. This enhanced further bullish advancement towards 1.1300-1.1315 (supply zone) where significant bearish rejection was demonstrated on April 15. For Intraday traders, the price zone around 1.1235 (78.6% Fibonacci) stood as a temporary demand area which paused the ongoing bearish momentum for a while before bearish breakdown could be executed on April 23. Short-term outlook turned to become bearish towards 1.1175 (a previous weekly bottom which has been holding prices above for a while) On May 17-20, a bearish breakdown below 1.1175 was temporarily achieved. As expected, further bearish decline was expected towards 1.1115. This is where significant bullish recovery was demonstrated by the end of Thursday's consolidations. This brought the pair back above 1.1175. Currently, The EURUSD pair remains trapped between the depicted price zones (1.1175-1.1235) with some bullish outlook until a definitive range-breakout occurs in either direction. Trade recommendations : Intraday traders can look for a counter-trend BUY entry upon the recent bullish breakout anywhere around the price level of 1.1175. T/P level to be located around 1.1240. Stop loss should be placed below 1.1150. The material has been provided by InstaForex Company - www.instaforex.com |
| Vertex Conqueror: Bitcoin is growing steadily, exceeding the annual maximum Posted: 27 May 2019 07:36 AM PDT On Monday, May 27, cryptocurrency number 1 demonstrates steady growth, coming close to the mark of $9000. The Bitcoin rate has reached $ 8755.10 and analysts say that it is ready to continue moving. According to the observations of experts, the leading digital currency has risen by almost 140%since the beginning of 2019 and reached a maximum level since May 2018. Experts believed that the current breakthrough is the latest news confirming the growing interest of a number of large companies in virtual assets. According to the estimates of cryptocurrency experts, the global digital currency market has good potential both in the short and long term. However, many investors were slow to remember the recent collapse of the virtual asset market. Recalling that the volume of transactions on it lags behind the pace of price increases, they considered this market "overheated". Some analysts believe that the current rise will soon be followed by a recession. At the same time, about 15% of experts declared a decline in the cryptocurrency market, while supporters of its growth are about 45%. Optimistic analysts predicted a rise in the price of Bitcoin to the $9,550 mark. In analyzing the value of cryptocurrency number 1 in the medium term, the number of positive experts rose to 70%. |
| Trading recommendations for the EUR/USD currency pair - placement of trading orders on May 27 Posted: 27 May 2019 07:22 AM PDT By the end of the last trading week, the Euro / Dollar currency pair showed low volatility of 36 points. Yet, the correction phase was retained even with this small amplitude. From the point of view of technical analysis, we see that the long-awaited correction against the background of the overbought dollar has come to our edges, discarding us more than 100 points from the pivot point 1.1112. Considering the general plan, we see that the global downtrend remains on the market and there are no hints of its change so far. The only thing that holds is the pivot level of 1.1112, which is the local minimum of the current year. The key event of the past week can rightly be called the resignation of British Prime Minister Theresa May, who said she would leave the post of leader of the Conservative Party on June 7. Frankly, the news is twofold. On the one hand, waiting for changes in current policy and on the other hand, perhaps even worse. In turn, the market reacted quite positively. The pound was rising in price, followed by the euro. I would call all this as premature fantasies. The Brexit topic will continue to hold the interest of speculators and with the new face of the party leader, Nigel Farage, it may even get worse if it comes to the disappointing withdrawal of a country from the EU without a deal. The news background on Friday had statistics on durable goods in the United States, where they waited for a reduction of 2.0%, which in principle was 2.1%. if it comes to a disappointing withdrawal of a country from the EU without a deal. Today, in terms of the economic calendar, we have a day off in the United States called "Memorial Day". Thus, trading volumes can be reduced. Further development Analyzing the current trading schedule, we see that the corrective move led us to the value of 1.1215, after which the upward driver began to decline. It is likely to assume that the quote is temporarily nailed to the value of 1.1180, where previously it felt pressure in the form of a mirror level. If the bearish background will gradually return and the quote will be fixed lower than 1.1175, then it makes sense to talk about the restoration of short positions and as a fact of the main move. Otherwise, you can see a temporary bump of 1.1180/1.1220 because of the confusion over Brexit. Based on the available information, it is possible to expand the number of variations, let's consider them: - The positions for the purchase were considered in case of price fixing higher than 1.1225. - Positions for sale are considered in the case of price fixing below 1.1175, with a primary perspective of 1.1135-1.11112. Indicator Analysis Analyzing a different sector of timeframes (TF), we can see that indicators in the short term show us a downward interest against the background of a recovery attempt. Intraday and mid-term perspectives are set for an upward interest against the background of a corrective move. Weekly volatility / Measurement of volatility: Month; Quarter; Year Measurement of volatility reflects the average daily fluctuation, based on monthly/quarterly/year. (May 27 was based on the time of publication of the article) The current time volatility is 25 points. It is likely that volatility can be reduced due to less trading volumes because of the holiday in the US. Key levels Zones of resistance: 1.1300 **; 1.1440; 1.1550; 1.1650 *; 1.1720 **; 1.1850 **; 1.2100 Support areas: 1.1180; 1.1112; 1.1080 *; 1.1000 ***; 1,0850 ** * Periodic level ** Range Level *** Psychological level The material has been provided by InstaForex Company - www.instaforex.com |
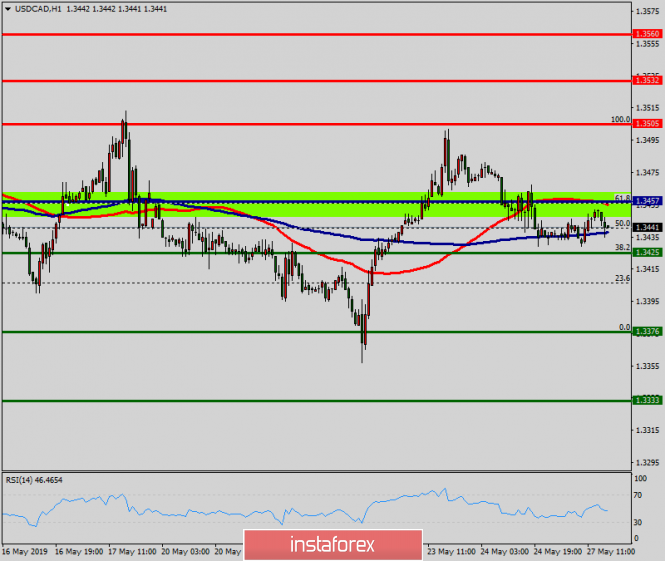
| Technical analysis of USD/CAD for May 27, 2019 Posted: 27 May 2019 07:05 AM PDT The USD/CAD pair continues to move upwards from the level of 1.3457. The pair rose from the level of 1.3457 (the level of 1.3457 coincides with a ratio of 61.8% Fibonacci retracement) to a top around 1.3505. But it rebounded from the top pf 1.3505 to 1.3477. Today, the first support level is seen at 1.3457 followed by 1.3425, while daily resistance 1 is seen at 1.3457. According to the previous events, the USD/CAD pair is still moving between the levels of 1.3505 and 1.3457; for that we expect a range of 48 pips (1.3505 - 1.3457). On the one-hour chart, immediate resistance is seen at 1.3505. Currently, the price is moving in a bullish channel. This is confirmed by the RSI indicator signaling that we are still in a bullish trending market. The price is still above the moving average (100), Therefore, if the trend is able to break out through the first resistance level of 1.3505, we should see the pair climbing towards the daily resistance at the levels of 1.3532 and 1.3560. It would also be wise to consider where to place stop loss; this should be set below the second support of 1.3425. The material has been provided by InstaForex Company - www.instaforex.com |
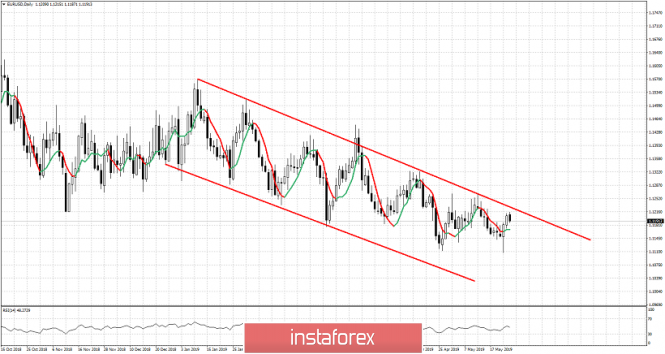
| Technical analysis of EURUSD for May 27, 2019 Posted: 27 May 2019 07:04 AM PDT EURUSD bounced towards 1.12 but now we see the usual rejection signs once price reaches the upper channel boundaries. Medium-term trend remains bearish as price continues to make lower lows and lower highs.
EURUSD has been inside this bearish channel since the start of the year. The recent bullish reversal candle that we noted in a previous posts has pushed price from 1.11 to a bit higher than 1.12. However the important resistance area of 1.1230-1.1260 has remained untouched and unchallenged. Trend remains bearish as long as price is below the upper channel boundary. Price is showing rejection signs once again however with the US markets closed, we should be a bit more patient until tomorrow to have a clearer view of the market. The material has been provided by InstaForex Company - www.instaforex.com |
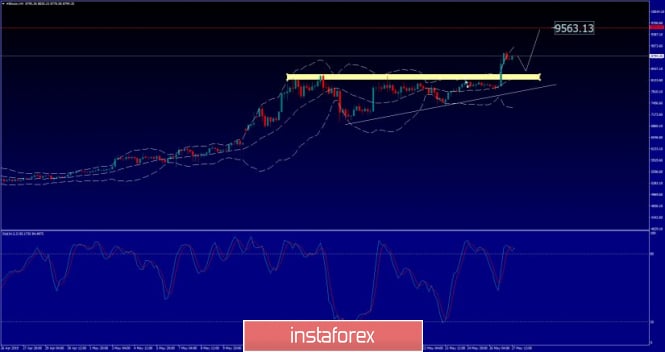
| Bitcoin analysis for May, 27.2019 Posted: 27 May 2019 07:02 AM PDT BTC has been trading strongly upside. There was the breakout of the ascending triangle, which is good sign for further upside movement.
White lines – Ascending triangle (broken) Yellow rectangle – Resistance level Red horizontal line– Projected target for the Ascending triangle The breakout of the Ascending triangle did confirm the strong bullish bias. You should watch for buying opportunities on the pullbacks. We might expect potential re-test of the broken resistance at $8.291 before new wave up. The projected target is set at the price of $9.563. The material has been provided by InstaForex Company - www.instaforex.com |
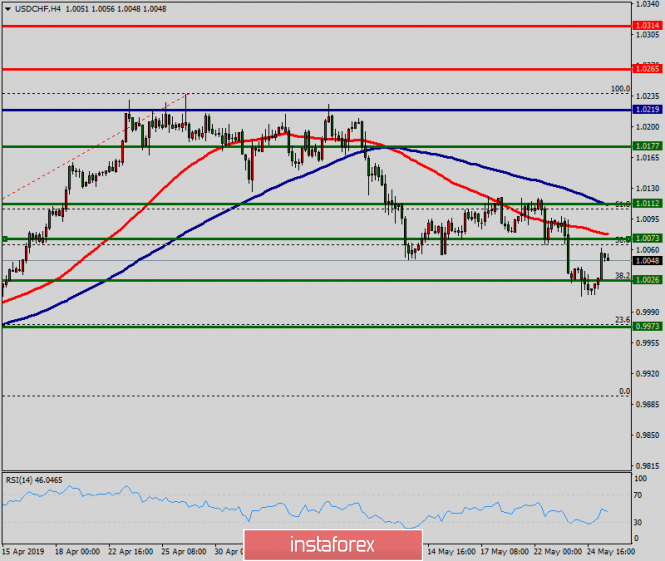
| Technical analysis of USD/CHF for May 27, 2019 Posted: 27 May 2019 06:59 AM PDT Overview: The USD/CHF pair continues moving in a bullish trend from the support levels of 1.0123 and 1.0177. Currently, the price is in an upward channel. This is confirmed by the RSI indicator signaling that the pair is still in a bullish trend. As the price is still above the moving average (100), immediate support is seen at 1.0177. Consequently, the first support is set at the level of 1.0177. So, the market is likely to show signs of a bullish trend around 1.0177. In other words, buy orders are recommended above the level of 1.0177 with the first target at the level of 1.0265. Furthermore, if the trend is able to breakout through the first resistance level of 1.0265, we should see the pair climbing towards the point of 1.0314. However, it would also be wise to consider where to place a stop loss; this should be set below the second support of 1.0123. The material has been provided by InstaForex Company - www.instaforex.com |
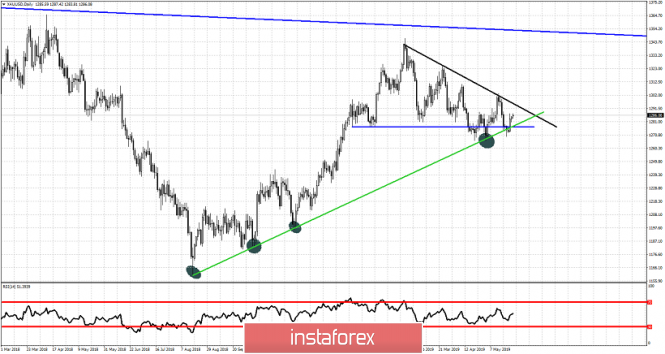
| Technical analysis of Gold for May 27, 2019 Posted: 27 May 2019 06:55 AM PDT Quiet day today as there is trading holiday in the US. Gold market is showing no clear direction today although price is a bit higher than Friday's trading session. Nothing is clear yet for the medium- or long-term trend for Gold.
Green line -long-term support trend line Blue neck line - horizontal support Black line - short-term resistance trend line Blue downward sloping line - long-term resistance trend line Gold price has bounced once again off the upward sloping green trend line support. Now we find key support at $1,270 as long as price is above this level bulls still hope for a bigger move higher. Bears on the other hand as long as they see price below $1,300 they have hopes for another sell off. Gold price has resistance at $1,290-92 area and if this level is broken then we would give many chances of a continued move higher. Failure to hold price above $1,270 will open the way for $1,250-30. The material has been provided by InstaForex Company - www.instaforex.com |
| GBP / USD plan for the American session on May 27. Enthusiasm of pound buyers is diminishing Posted: 27 May 2019 06:38 AM PDT To open long positions on the GBP / USD pair, you need: Buyers failed to keep the pair above the level of 1.2696, to which I paid attention in my morning forecast that they would maintain a downward impulse. In the afternoon, a return and consolidation above the resistance of 1.2969 are required, which will allow us to count on a quick return to a maximum of 1.2744, where I recommend taking profits. With a further decrease in the pound, you can open long positions today to rebound from a low of 1.2648. To open short positions on GBP / USD pair, you need: As long as trading is below the resistance of 1.2696, pressure on the pound will continue. The main task of the bears is to test the support of 1.2648, which may lead to an update of the minimum of 1.2607, where I recommend taking profits. When the growth scenario is above 1.2696 in the second half of the day, you can return to sales of the pound immediately to rebound from a maximum of 1.2744. Indicator signals: Moving averages Trade is conducted in the region of 30 and 50 moving averages, which indicates the lateral nature of the market. Bollinger bands In the case of pound growth, the upper limit of the indicator in the area of 1.2750 will act as resistance. Description of indicators MA (moving average) 50 days - yellow MA (moving average) 30 days - green MACD: fast EMA 12, slow EMA 26, SMA 9 Bollinger Bands 20 The material has been provided by InstaForex Company - www.instaforex.com |
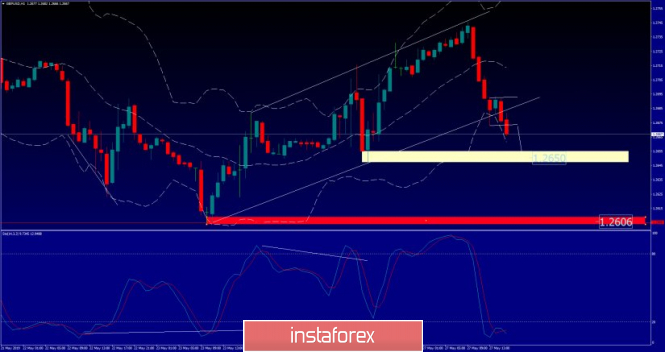
| GBP/USD analysis for May, 27.05.2019 Posted: 27 May 2019 06:33 AM PDT GBP has been trading downwards as we expected. The price tested the level of 1.2665. We are expecting more downside on GBP due to breakout of the upward channel.
White line – broken upward channel Yellow rectangle - Support 1 Red rectangle– Support 2 The breakout of the upward channel did set the tone for the day and potentially marked more downside. I also found the 3hour balance after the breakout, which was consolidation after the breakout. Support levels are seen at the price of 1.2650 and 1.2605. Stochastic made new momentum down, which is another confirmation of the underlying weakness on GBP. Key resistance is seen at the price of 1.2745. The material has been provided by InstaForex Company - www.instaforex.com |
| Posted: 27 May 2019 06:31 AM PDT To open long positions on EUR / USD pair, you need: The lack of important fundamental data led to a slight downward correction of the euro. However, buyers are trying to build the lower boundary of the rising channel in the support area of 1.1192. False breakdown at this level will be a signal to open long positions in the pair with a test of maximum at 1.1222, where I recommend today to take profits. With a further decrease in EUR/USD pair, you can immediately look at the rebound from the 1.1171 low. To open short positions on EUR / USD pair, you need: It is unlikely that the bears in the afternoon will actively try to break through the support of 1.1192 but for them, this is the primary task. Fixing below this level will lead to a further decline of EUR/USD in the area of minimum 1.1171 and 1.1149, where I recommend taking profits. When trying to grow the euro, short positions can return immediately to the rebound from a maximum of 1.1222. Indicator signals: Moving averages Trade is conducted in the region of 30 and 50 moving averages, which indicates the lateral nature of the market, which continues until tomorrow. Bollinger bands In case of euro growth, the upper limit of the indicator in the area of 1.1220 will act as resistance. Description of indicators MA (moving average) 50 days - yellow MA (moving average) 30 days - green MACD: fast EMA 12, slow EMA 26, SMA 9 Bollinger Bands 20 The material has been provided by InstaForex Company - www.instaforex.com |
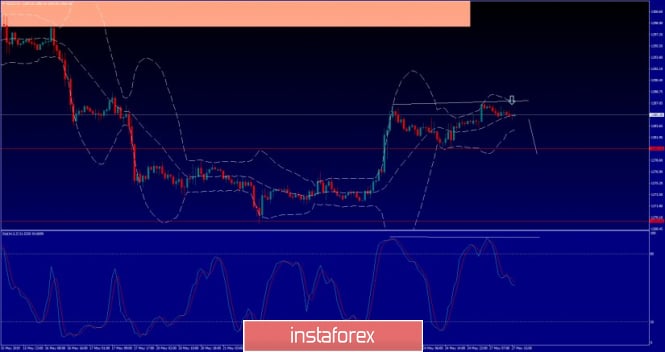
| Analysis of Gold for May, 27.2019 Posted: 27 May 2019 06:18 AM PDT Gold has been trading sideways at the price of $1.285.35. We found that Gold lost momentum on the last up swing, which is potential sign of the downward movement.
White line – bearish divergence Red horizontal line- Support 1 Red horizontal line– Support 2 We found bearish divergence on the Stochastic oscillator, which is sign of the losing momentum on the upside. We also found fial breakout of the Friday's high at $1.286, which is another sign of the wekaness. Support is seen at the price of $1.280 and $1.270. Resistance level is set at the price of $1.287. Watch for potential selling opportunities with the first target at $1.280. The material has been provided by InstaForex Company - www.instaforex.com |
| Posted: 27 May 2019 05:57 AM PDT EUR / USD pair On Friday, May 24, the EUR/USD pair trading ended with an increase of 25 basis points. Nevertheless, the current wave is counting despite the two-day growth of the Euro-currency. It suggests the construction of a downward set of waves, which remain in force. The only thing that should be noted is that the wave pattern takes a rather complicated form and the entire downward portion of the trend can turn out to be very long. Recent US releases have disappointed the market. The bears missed the opportunity to break through the minimum of April 26 and the instrument turned to the construction of the next correction wave. it became known on Friday that orders for durable goods declined in April. Moreover, the results of the elections to the European Parliament became known this morning, and according to which, the presence of European skeptics in the EU government is growing. It is impossible to state unequivocally that this is bad for the euro. This should simply be taken as a fact. A downward signal down from MACD will be a good reason for new sales of Eurocurrency. Sales targets: 1.1097 - 161.8% Fibonacci 1.1045 - 200.0% Fibonacci Purchase targets: 1.1324 - 0.0% Fibonacci General conclusions and trading recommendations: The euro/dollar is still in the process of building a downtrend trend. However, after the quotes move away from the lows reached, I recommend waiting for the signal down from the MACD and again selling the euro with targets at 1.1097 and 1.1045, which corresponds to 161.8% and 200.0% Fibonacci. I recommend placing a restrictive order above the Fibonacci level of 76.4%. GBP / USD pair On May 24, the GBP/USD pair gained 55 basis points. The political and economic situation remains difficult in the UK as the country waits for the election of a new prime minister. The conservatives have suffered a deafening defeat in the elections to the European Parliament, while the laborists also did not get the desired number of votes. Thus, Brexit remains unresolved. The sterling pound has been growing in the last few days but only because of weak statistics from America, which made experts speak again about recession in the United States. However, it does not matter much for the pounds/dollars pair because the situation in the UK is much worse. The country continues to lose a lot of money because of Brexit, but the exit as such has not even taken place. The investment attractiveness of the UK is very low and some companies want to leave the country due to incomprehensible future relations with the EU. Sales targets: 1.2554 - 200.0% Fibonacci 1.2360 - 261.8% Fibonacci Purchase targets: 1.3175 - 0.0% Fibonacci General conclusions and trading recommendations: The wave pattern of the pound/dollar instrument suggests a resumption of the instrument decline within the estimated wave c. Thus, I still recommend selling the pound now with targets located near the calculated levels of 1.2554 and 1.2360, which corresponds to 200.0% and 261.8% Fibonacci, but with one clarification. I recommend waiting for the signal down from MACD for new sales. The material has been provided by InstaForex Company - www.instaforex.com |
| Posted: 27 May 2019 05:30 AM PDT 4 hour timeframe Technical details: Senior linear regression channel: direction - down. The younger linear regression channel: direction - down. Moving average (20; smoothed) - sideways. CCI: 99.6865 Well, Theresa May resigns and 7 politicians, including Boris Johnson, are immediately marked in her place. Then, elections to the European Parliament are over. In general, Eurosceptics gained more than 100 places out of 751, and Nigel Faraj's Brexit won the game from the UK. As we already wrote in the review about the euro, there was no particular reaction of the market to the election results. Traders are not ready to make long-term plans and try to guess what this political situation will lead to. Also, market participants do not want to guess who will be the next prime minister and how Brexit will end. Thus, sales of the pound against the background of complete uncertainty for Brexit ended and the pound rebounded slightly against the background of weak US macroeconomic statistics in the past two days. From a technical point of view, euro sellers still hold the initiative in their hands until it was possible as the above movement of the pound/dollar pair to gain a foothold. Thus, bears can again go on the attack on the bulls at any time, which still have nothing to repel. On the first trading day of the week, there is not a single planned important publication. Thus, there is every reason to assume that volatility will be low today. However, given the resignation of Theresa May, new messages from the UK regarding the new prime minister and the prospects for Brexit may cause a surge in activity among traders with a low volatility today. Nearest support levels: S1 - 1.2695 S2 - 1.2634 S3 - 1.2573 Nearest resistance levels: R1 - 1.2756 R2 - 1.2817 R3 - 1.2878 Trading recommendations: The GBP/USD pair continues the upward correction. Thus, it is now recommended to wait for its completion and then resume sales of the pound sterling with targets of 1.2634 and 1.2573. Longs are recommended to be considered only after the pair fixed above the movement with targets at 1.2817 and 1.2878. However, the bulls remain fairly weak at the moment. In addition to the technical picture, traders should also take into account the fundamental data and the time of their release. Explanations for illustrations: The senior linear regression channel is the blue lines of unidirectional movement. The junior linear channel is the purple lines of unidirectional movement. CCI is the blue line in the indicator regression window. The moving average (20; smoothed) is the blue line on the price chart. Murray levels - multi-colored horizontal stripes. Heiken Ashi is an indicator that colors bars in blue or purple. The material has been provided by InstaForex Company - www.instaforex.com |
| Results of the elections to the European Parliament only slightly differed with the forecasts Posted: 27 May 2019 05:16 AM PDT Let me remind you that the elections to the European Parliament were held in 28 EU countries from Thursday to Sunday. As for the preliminary results, the European Democratic Bloc "European People's Party" received 23.8% or 179 votes. The party "Progressive Alliance of Socialists and Democrats" gained a little less than 20% and 150 parliamentary seats. However, these two friendly blocs of parties do not gain an absolute majority of votes in sum, which will force them to seek allies for the formation of the ruling coalition. Many were surprised by the rather high voter turnout of about 50.5%, whereas last year, less than 43% of the citizens came to the polls. As for the nationalist party Europe for Freedom and Direct Democracy, as well as the European skeptic party Europe of Nations and Freedoms, their support by the electorate has also increased significantly. According to the results of the games will take 56 and 58 places respectively. As expected, the majority received the pro-European forces. Yet, this does not simplify the task of resolving issues with the release of the UK from the EU as the decision-making processes in the block have become even more complicated. Of the representatives of the deputies, many are not focused on business support, as well as environmentalists. Returning to the fundamental data, we should note the report on the American economy. A pressure formed in the US dollar on Friday and as a result of which, it was possible to observe the strengthening of risky assets. According to the report, orders for durable goods in April 2019 declined slightly more than economists had predicted. Reduced orders are directly related to weak demand for civil aircraft due to problems with Boeing Co. According to a report by the US Department of Commerce, orders for durable goods in April decreased by 2.1% compared with the previous month amounting to $ 248.4 billion. Economists had expected orders to fall by 2% in April. Data for March were revised downwards. Initially, an increase of 2.6% was reported against an actual increase of 1.7%. In the first four months of 2019, orders for durable goods increased by 2% compared with the same period of the previous year. As for the technical picture of the EUR/USD pair, a further upward correction will be problematic without the formation of a new lower boundary of the ascending channel, which can be observed in the area of the minima at 1.1190 and 1.1170. The target buyers of risky assets will be highs in the area of 1.1230 and 1.1260. The material has been provided by InstaForex Company - www.instaforex.com |
| Posted: 27 May 2019 04:55 AM PDT 4-hour timeframe Technical details: Senior linear regression channel: direction - down. The younger linear regression channel: direction - down. Moving average (20; smoothed) - up. CCI: 150.4770 The last trading day of last week was the scenario of eurobucks. The only but very important macroeconomic report of the day showed that the number of orders for durable goods in the United States decreased by 2.1% y/y in April (excluding defense by 2.5% and defense and aviation by 0.9%). Thus, traders continued to reduce the dollar positions, which led to a slight strengthening of the euro. It was "slightly" because the total for the day the pair rose by only 30 points. Even taking into account the fact that the growth of the euro currency has been going on for two full days already, this is not enough to suggest the beginning of an uptrend. Although prices overcame a moving average line, which changed the current trend for the instrument to ascending. The foreign exchange market is now in serious thought, as there are no reasons for buying euros, except for the failed macroeconomic statistics from the USA. Thus, it is possible that euro sellers will become more active again in the near future. Meanwhile, elections to the European Parliament are over in Europe. There is a high voter turnout, more than 50%. Of Eurosceptics received more than 100 seats in parliament, which is not very good for the prospects of the European Union in the distant future. However, this does not affect the euro rate so far. Nearest support levels: S1 - 1.1200 S2 - 1.1169 S3 - 1.1139 Nearest resistance levels: R1 - 1.1230 R2 - 1.1261 R3 - 1.1292 Trading recommendations: The EUR/USD currency pair continues its slight upward movement. Thus, it is now recommended to consider buying orders with targets at 1.1230 and 1.1261, but in small lots since both linear regression channels are still downward. It is recommended to consider selling orders for the euro/dollar pair only after the price is fixed back below the moving with targets 1.1139 and 1.1108. In addition to the technical picture should also take into account the fundamental data and the time of their release. Explanations for illustrations: The senior linear regression channel is the blue lines of unidirectional movement. The younger linear regression channel is the violet lines of unidirectional movement. CCI - blue line in the indicator window. The moving average (20; smoothed) is the blue line on the price chart. Murray levels - multi-colored horizontal stripes. Heiken Ashi is an indicator that colors bars in blue or purple. The material has been provided by InstaForex Company - www.instaforex.com |
| Bitcoin: When will it reach 9,000? Posted: 27 May 2019 04:44 AM PDT Bitcoin has already reached the level of 8,900 and it is close to a breakthrough of 9,000 USD. The main growth is associated with an increase in trading volume by $10.3 billion this weekend, according to CoinMarketCap. Bitcoin (BTC) buy signal: Buyers reached the target of 8.900 USD. Now, the new challenge is to break through this range, which will lead to the area of new highs of 9.100 and 9.300, where I recommend taking profits. Those who still believe in Bitcoin correction and decline can wait for the renewal of 8.480 minimums or buy for a rebound from 8,120. Bitcoin Sales Signal (BTC) An unsuccessful breakthrough to the resistance of 8,900 with a repeated test, which may take place in the near future with confirmation of divergence on the MACD indicator, will be the first signal to open short positions. However, more acceptable levels for selling Bitcoin are seen in the region of 9,100 and a little higher in the region of 9,300. The purpose of the bears will be to return the cryptocurrency rate to the support area of 8,480. |
| Simplified wave analysis for GBP / USD and AUD / USD pairs and forecast on May 27 Posted: 27 May 2019 04:17 AM PDT GBP / USD pair The unfinished wave model of the British pound has a bearish sentiment on May 3. The first 2 parts are completely formed in the wave structure. While ascending since May 23, the plot of the schedule corrects the beginning of the final part (C). The price is within the wide potential reversal zone of the monthly timeframe of the chart. Forecast: Today, it is expected that the pair will continue its current ascending course up to its full completion. The nature of price fluctuations is likely to be flat. By the end of the day, the chance of a change in the rate and the price move down is increasing. With a reversal, a short-term price breakthrough of the upper resistance line is possible. The support zone will limit the range of the pair's daily movement. Recommendations: For trading on long-term parts of the chart, the best solution is to stay out of the market. Supporters of transactions within the sessions can make short-term sales. When the price approaches the support zone, it is wiser to complete the transaction due to the high probability of a pullback. Resistance zones: - 1.2740 / 1.2770 Support areas: - 1.2670 / 1.2640 AUD / USD pair The direction of short-term trends is given by the bear wave algorithm of April 17. As part of the last trend section of May 20, an upward pullback began at the end of last week. The price is located at the lower boundary of the settlement zone. Forecast: Today, a flat mood of movement is expected in the first half of the day with a general upward vector. The likelihood of a reversal and a change in the direction of the intersessional trend increases by the end of the day. Further breakthrough to the support zone in the next few days is unlikely to happen. Recommendations: The upcoming flat price of "Aussie" is better to miss. The style inside the session allows short-term purchases, followed by a reversal of the vector of transactions. Contracts for sale from the zone of resistance may be promising for the international trade style. Resistance zones: - 0.6940 / 0.6970 Support areas: - 0.6890 / 0.6860 The simplified wave analysis uses waves consisting of 3 parts (A – B – C). Each of these analyzes the last incomplete wave. Zones show calculated areas with the highest probability of reversal. The arrows indicate the wave marking by the method used by the author. The solid background shows the formed structure and the dotted exhibits the expected movement. Note: The wave algorithm doesn't take into account the duration of tool movements over time. The material has been provided by InstaForex Company - www.instaforex.com |


| You are subscribed to email updates from Forex analysis review. To stop receiving these emails, you may unsubscribe now. | Email delivery powered by Google |
| Google, 1600 Amphitheatre Parkway, Mountain View, CA 94043, United States | |
No comments:
Post a Comment