
Forex analysis review |
- The pound is at a loss, the resignation of Theresa may can only increase uncertainty on Brexit
- USD / CAD. Canadian awaiting Bank of Canada verdict and Friday data
- EUR / USD: only the end of trade wars will lead to the strengthening of the euro
- Technical analysis for EURUSD for May 28, 2019
- Technical analysis for Gold for May 28, 2019
- Bitcoin analysis for May, 28.2019
- Analysis of Gold for May, 28.2019
- GBP/USD analysis for May, 28.05.2019
- May 28, 2019 : EUR/USD Intraday technical analysis and trade recommendations.
- May 28, 2019 : GBP/USD Intraday technical analysis and trade recommendations.
- EUR/USD: A slight increase in the sentiment index of the eurozone economy is not enough for the upward impulse of the euro
- GBP / USD plan for the American session on May 28. Traders do not know what to do next with the pound
- EUR / USD plan for the US session on May 28. Consumer confidence in the eurozone remained at the past level
- EUR / USD and GBP / USD: Forecast and Simplified wave analysis for May 28
- EUR/USD and AUD/USD: Consumer confidence in Germany is falling while it is improving in Australia
- Technical analysis of EUR/USD for May 28, 2019
- Technical analysis of NZD/USD for May 28, 2019
- Excess raw materials and falling demand are the main enemies of the oil market
- Bitcoin: The real Bitcoin market is efficient and streamlined
- EUR / USD plan for the European session on May 28. Euro buyers still have a chance to resume growth
- Wave analysis for EUR / USD and GBP / USD pairs on May 28. The markets once again sell the euro and the pound amid "zero"
- Review for GBP/USD pair on May 28: The forecast for the
- China does not want to devalue the yuan: AUD and NZD get a chance for corrective growth
- Review EUR / USD. May 28th The forecast for the system "Regression Channels". We expect a resumption of the downward trend
- Trading plan for EUR / USD and GBP / USD for 05/28/2019
| The pound is at a loss, the resignation of Theresa may can only increase uncertainty on Brexit Posted: 28 May 2019 05:41 PM PDT From the highs of the current year, the pound sterling lost about 5%. According to a number of analysts, the further dynamics of the British currency will largely depend on who will be the successor of Prime Minister Theresa May and how determined he will be in matters of Brexit. The process of electing a new leader of the Conservative Party will start on June 10 and will take about one and a half months. It is assumed that the new Prime Minister of Britain will receive either directly before the summer parliamentary recess, which will begin in late July, or already after them in September. Meanwhile, the Brexit question is still open, and it is not quite clear what scenario will take place. Traders say that the chances of implementing the "hard" scenario have increased, since four out of eight contenders for the Tory presidency said that the United Kingdom must leave the EU on October 31, even if the "divorce" agreement will not be concluded. However, it is possible that T. May will retire for a reason, and will accept as a condition the acceptance of her version of the deal with Brussels, or the so-called "soft" exit from the EU. It should be recognized that this option is not very advantageous for the UK, but it is much better than the "hard" scenario, in which the country's GDP risks losing up to 10%. Prospects for the pound Until now, the British currency reacted sluggishly to the news on Brexit, as investors stopped waiting for any real action. If the situation continues to develop in the same way as before, everything will remain at the same levels. If a new referendum is held, it will lead to a weak negative reaction of the pound. However, if it comes to a "hard" exit, then it will certainly hit the sterling, since it is obvious that this is a very disadvantageous option for Britain. Experts assume that if the trend for the fall of the GBP/USD pair is maintained, the pound rate may reach parity with the dollar in a year or two. Thus, the inability of the United Kingdom to withdraw from the EU on favorable terms creates a threat to the country's economy, growing internal political contradictions also frighten investors, and public sentiment does not allow us to reverse the exit process from the alliance. According to the results of the recently held elections to the European Parliament, the Brexit Party received the largest number of votes, which generally confirms the desire of British citizens to leave the EU. However, as we have seen in recent months, the possibility of a country leaving the bloc without a deal is unequivocally rejected by the House of Commons. Therefore, with the arrival of the new prime minister, political uncertainty is unlikely to be resolved. The material has been provided by InstaForex Company - www.instaforex.com |
| USD / CAD. Canadian awaiting Bank of Canada verdict and Friday data Posted: 28 May 2019 05:22 PM PDT On the eve of the May meeting of the Bank of Canada, Loonie demonstrates the upward impulse again, returning to the borders of the 35th figure. However, the expectation of a meeting of members of the regulator has more likely background pressure on the Canadian currency - the pair USD/CAD is growing primarily due to the restoration of the greenback and the ongoing trade conflict between the US and China. The Central Bank of Canada can only strengthen this growth, although, by and large, no major changes are foreseen at the May meeting. Generally, the market fell into the trap of its own expectations after the release of the latest data on inflation. Let me remind you that the annual inflation rate in Canada rose in April by 2% compared with the March figure of 1.9% and 1.5% in February. Positive inflationary dynamics returned to traders the hope of toughening Stephen Poloz's rhetoric about monetary policy prospects. The Bank of Canada has raised interest rates five times since July of the year before, but has not taken any action over the past four meetings. In addition, at the April meeting, the regulator excluded from the text of its accompanying statement a phrase about the further need to tighten monetary policy. After that, even rumors about the likelihood of the reverse step began to spread on the market. But over time, these conversations subsided. In other words, these market fears were largely leveled, after which the Canadian was stuck in a flat waiting for the news impulses. An unexpected increase in April inflation "stirred up" market participants, and a pair of USD /CAD declined to the middle of the 33rd figure, updating the three-week minimum. But the euphoria did not last long - the next crisis in relations between Beijing and Washington had a significant pressure on the Canadian dollar. Escalation of the trade war put an end to tightening monetary policy in the leading countries of the world - and Canada is no exception. After raising tariffs and history with Huawei, China launched a rather unexpected counter-strike, hinting at restricting the export of rare metals. Rumors about this first appeared in the press, but today, the Chinese authorities have actually confirmed such intentions. Thus, one of the representatives of the Ministry of Trade said that Beijing would primarily focus on domestic demand, but China is ready to export rare items to other countries, but "within reasonable limits." It is worth recalling that these metals are actively used by Americans in radio electronics, instrument making, nuclear engineering, mechanical engineering, chemical industry and metallurgy, that is, almost everywhere, from the production of mobile phones to the production of airliners. To put it simply, the current degree of confrontation in US-China relations suggests that it is still too far from a trade truce - and this fact will have a corresponding impact on members of the Canadian Central Bank. Stephen Poloz has repeatedly expressed concern about world trade in the light of this conflict - and given the recent events, he is unlikely to change his rhetoric in this regard. With regard to macroeconomic statistics, there is also not everything is clear. As mentioned above, Canadian inflation shows a positive trend, but overall economic growth leaves much to be desired. In the fourth quarter of last year, the country's GDP grew by only 0.4% year-on-year, while final domestic demand was even weaker, falling by 1.5%. Release of more recent data - for the first quarter of this year - is expected only on Friday, May 31, that is, after the May meeting of the Bank of Canada. Therefore, members of the regulator will be able to assess the dynamics of only indirect economic indicators. In particular, employment growth in the first quarter was steady, but the retail sales indicator indicates a low level of consumer spending. Of course, the growth of the oil market can give a positive impetus to economic growth in Canada: according to the general opinion of experts, GDP growth in the first quarter will increase to 1.2% in annual terms, while according to the Canadian regulator's own forecasts. This figure should grow by only 0.3% . If this forecast comes true, then the Canadian dollar will receive significant support. But all this will be (if it is) already after the May meeting, at which the regulator is most likely to take a cautious - and possibly - "dovish" position, complaining about the uncertainty about the prospects for the global economy. Thus, the Canadian dollar is largely ready for the next meeting of the Central Bank: Stephen Poloz will either secure USD/CAD in the 35th figure, or return the pair in the range of 1.3390-1.3450. However, following a volatile reaction, a large-scale continuation is unlikely to follow - the general situation is too ambiguous for any global conclusions. In conclusion, Friday's data on the growth of the Canadian economy can cause a broader response, in contrast to the rhetoric of Poloz, which is largely predictable. The material has been provided by InstaForex Company - www.instaforex.com |
| EUR / USD: only the end of trade wars will lead to the strengthening of the euro Posted: 28 May 2019 05:09 PM PDT Against the background of increasing fears that the trade conflict between Washington and Beijing is serious and for a long time, investors are actively selling off the currencies of developing countries and increasing the share of protective assets in their portfolios. This pushes the USD index up and the EM currency down. Contrary to the prevailing view on the market that the worst in a trade war is still to come, Brandywine Global Investment Management experts believe that US President Donald Trump will be forced to soften the rhetoric and conclude a trade deal with China to protect the interests of American consumers. "Trump has an incentive to make a deal. In essence, the duties are US consumer tax, "said Brandywine representatives. According to them, the current position of the American leader may be part of a strategy aimed at gaining the support of conservative voters before the presidential election. Brandywine also believes that the USD rally is ending near. "All the traditional supports for the advanced dynamics of the greenback seems to be crumbling or have already collapsed. In such conditions, it makes sense to pay attention to the assets most affected by trade friction, including the Australian dollar, " the experts noted. It is assumed that due to the movement of investors from funding currencies to risky assets in the framework of resuscitation of the carry-trade strategy, the bulls of EUR/USD may also suffer. At the same time, it should be recognized that only the end of trade wars will lead to the strengthening of the euro. Without the recovery of German exports and European industrial production, bulls at EUR/USD will be difficult to break through to the level of 1.15. Meanwhile, the problems of the euro go far beyond the trade conflicts and EU's weak economy. As soon as the Old World withdrew from the elections to the European Parliament, fears of a potential escalation of the conflict between Rome and Brussels returned. According to Reuters, in early June, the European Commission may begin to consider disciplinary measures against Italy, which violates EU budget rules. In addition, despite the fact that the US president has decided to postpone the increase in duties on the import of cars to America from the Old World for the time being, he can still block oxygen to EU car suppliers. In such conditions, the growth potential of the EUR/USD pair seems limited. In this regard, the purchase will be interesting only at the breakthroughs of the resistance levels of 1.1265 and 1.132. The material has been provided by InstaForex Company - www.instaforex.com |
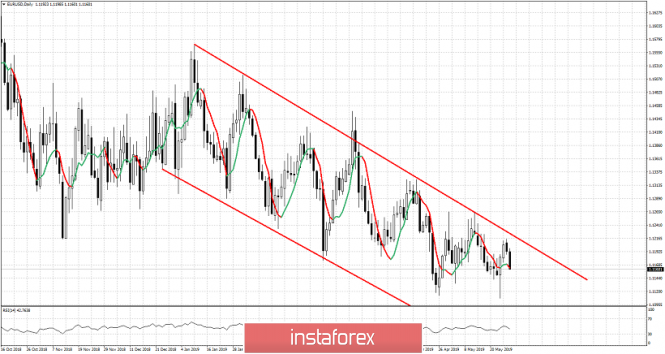
| Technical analysis for EURUSD for May 28, 2019 Posted: 28 May 2019 01:54 PM PDT EURUSD remains inside the longer-term bearish channel. Price got rejected at the resistance of 1.12-1.1230 area and is now challenging 1.1150. At 1.1150 we find important Fibonacci support level.
EURUSD is pulling back. At 1.1150 we find the 61.8% Fibonacci retracement level of the entire rise from 1.1107 and the huge 4 hour reversal candle we noted in previous posts. If this support level holds we could then see a comeback by bulls. Resistance is at 1.1230. Breaking above it will increase dramatically the chances of breaking above 1.1260 and canceling the bearish sequence of lower lows and lower highs since early January 2019. If support fails to hold we should expect price to move below 1.11. The material has been provided by InstaForex Company - www.instaforex.com |
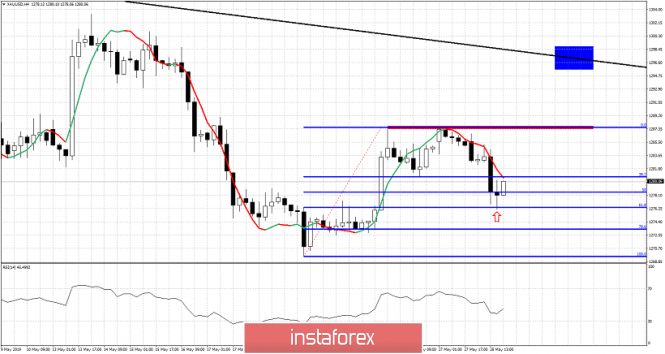
| Technical analysis for Gold for May 28, 2019 Posted: 28 May 2019 01:49 PM PDT Gold price has made an important low at $1,266 on May 21st and since then it shows that bulls could make a comeback. Price remains below the key resistance area of $1,295-$1,300 and as long as we trade below that level, bears will be expecting a move lower to $1,250-20 area. Breaking above this area opens the way for $1,350 and higher.
Red rectangle - important short-term resistance Blue rectangle - target if price breaks above short-term resistance Black line - major resistance trend line Gold price has pulled back from $1,288 to $1,270 and the 61.8% Fibonacci retracement level of the latest rise. Gold price has stopped the decline and shows bullish signs. Short-term resistance is at $1,288 and breaking above it will open the way for a move towards the major resistance trend line at $1,296-$1,300. Failure to hold above $1,270-66 would be a bearish sign and will open the way for a move towards $1,250-20. The material has been provided by InstaForex Company - www.instaforex.com |
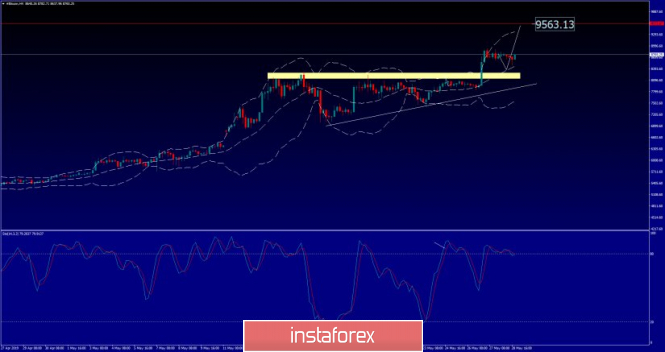
| Bitcoin analysis for May, 28.2019 Posted: 28 May 2019 10:48 AM PDT BTC has been trading sideways at the price of $8.760. The price tested the level of $8.473 as we planned and provided us a good buy opportunity.
White rectangle – horizonal support Red horizontal line – projected target Ascending triangle is active on the BTC and we expect more upside. Price did went to test the middle of the Bolinger band, which is is support for further upside. Additionally, there is the bullish flag intraday in creation, which is another sign of the strength. Support level is seen at the price of $8.310. Resistance is seen at the price of $9.563. Watch for buying opportunities. The material has been provided by InstaForex Company - www.instaforex.com |
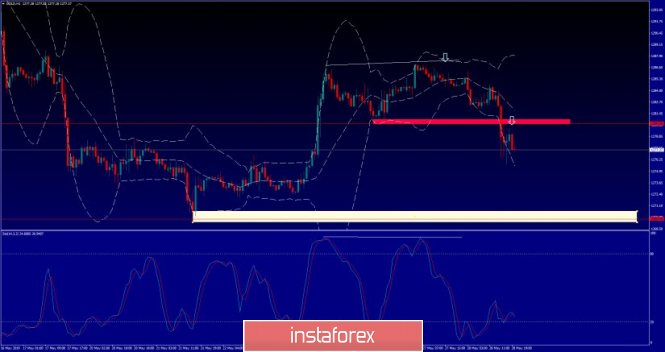
| Analysis of Gold for May, 28.2019 Posted: 28 May 2019 10:39 AM PDT Gold has been trading downwards as we expected. The price tested the level of $1.277. Double dop formation is confirmed and we should expect more downside.
Red rectangle – horizonal resistance White rectangle – horizontal support Gold did down break the support at $1.280, which is good sign for further downside. Gold did try to rally but with no good success, which is sign of the weakness. Our advice is to watch for selling opportunities. Support level is seen at the price of $1.270. Resistance is seen at the price of $1.280. Strong bearish divergence in the background as well. The material has been provided by InstaForex Company - www.instaforex.com |
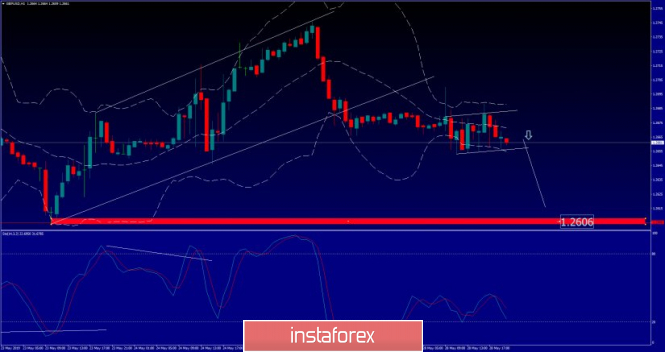
| GBP/USD analysis for May, 28.05.2019 Posted: 28 May 2019 10:28 AM PDT GBP/USD has been trading sideways at the price of 1.2661. Bearish flag is in creation and we expect more downside.
Red rectangle - horizontal support White lines – Channel borders GBP/USD did break of the upward channel in the background, which is sign of the underlying weakness on the GBP. We also saw the bearish flag in creation after the breakout of the channel, which is very positive sign of further wekaness on GBP. Key support is seen at the price of 1.2606. Resistance levels are seen at 1.2688 and 1.2700. Watch for selling opportunities on the break of the bearish flag. The material has been provided by InstaForex Company - www.instaforex.com |
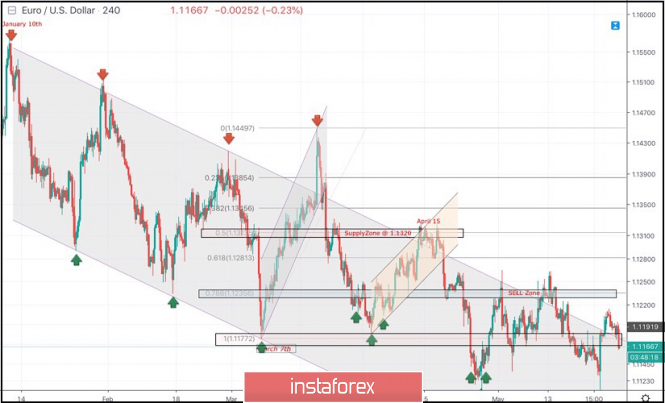
| May 28, 2019 : EUR/USD Intraday technical analysis and trade recommendations. Posted: 28 May 2019 10:23 AM PDT
Since January 10, the EURUSD pair has been moving within the depicted channel with slight bearish tendency. Few weeks ago, a bullish Head and Shoulders reversal pattern was demonstrated around 1.1200. This enhanced further bullish advancement towards 1.1300-1.1315 (supply zone) where significant bearish rejection was demonstrated on April 15. For Intraday traders, the price zone around 1.1235 (78.6% Fibonacci) stood as a temporary demand area which paused the ongoing bearish momentum for a while before bearish breakdown could be executed on April 23. Short-term outlook turned to become bearish towards 1.1175 (a previous weekly bottom which has been holding prices above for a while) On May 17-20, a bearish breakdown below 1.1175 was temporarily achieved. As expected, further bearish decline was expected towards 1.1115. This is where significant bullish recovery was demonstrated by the end of Thursday's consolidations bringing the EURUSD pair back above 1.1175. Currently, The EURUSD pair remains trapped between the depicted price zones (1.1150-1.1235) with some bullish outlook towards 1.1235 unless a definitive bearish breakout occurs below 1.1150. Trade recommendations : Intraday traders should look for another bullish breakout above 1.1175 as a valid BUY signal. T/P level to be located around 1.1240. Stop loss should be placed below 1.1150. The material has been provided by InstaForex Company - www.instaforex.com |
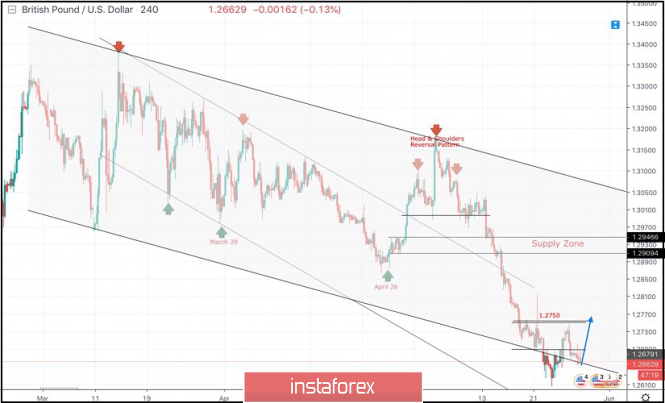
| May 28, 2019 : GBP/USD Intraday technical analysis and trade recommendations. Posted: 28 May 2019 09:25 AM PDT
On March 29, a visit towards the price levels of 1.2980 (the lower limit of the newly-established bearish movement channel) could bring the GBPUSD pair again towards the upper limit of the minor bearish channel around (1.3160-1.3180). Since then, Short-term outlook has turned into bearish with intermediate-term bearish targets projected towards 1.2900 and 1.2850. On April 26, another bullish pullback was initiated towards 1.3000 (the same bottom of March 29) which has been breached to the upside until May 13 when a bearish Head and Shoulders pattern was demonstrated on the H4 chart with neckline located around 1.2980-1.3020. Bearish persistence below 1.2980 enhanced further bearish decline. Initial bearish Targets were already reached around 1.2900-1.2870 (the backside of the broken channel) which failed to provide any bullish support for the pair. Further bearish decline was demonstrated towards the lower limit of the long-term channel around (1.2700-1.2650). The GBPUSD pair looks oversold around the current price levels (1.2650-1.2700). That's why, SELL signals shouldn't be considered at such low prices. On the other hand, bullish persistence above 1.2690 and 1.2750 is needed to enhance the bullish side of the market towards 1.2870 (Bottom of April 26). Otherwise, a bearish breakdown below 1.2640 will enable further bearish decline towards 1.2600 and 1.2540 probably. Trade Recommendations: Conservative traders should wait for another bullish pullback towards 1.2870-1.2905 (newly-established supply zone) to look for valid sell entries. S/L should be placed above 1.2950. Counter-trewnd traders can consider the recent bullish breakout above 1.2690-1.2700 as a signal to look for a valid BUY entry around the current price levels (1.2660). T/P level to be located around 1.2750 and 1.2820. S/L to be located below 1.2630. The material has been provided by InstaForex Company - www.instaforex.com |
| Posted: 28 May 2019 07:31 AM PDT According to the data, the confidence of eurozone companies grew in May due to the good growth of the economy at the beginning of this year. This helped to smooth out the situation with weak exports, which will still manifest itself in the 2nd quarter of this year. Growing consumer confidence will certainly support the eurozone economy, but activity will remain quite restrained. According to the European Commission, the sentiment index in the eurozone economy rose to 105.1 points in May from 103.9 points in April. Economists had expected the indicator to fall to 103.8. It is worth noting that due to the trade wars that have been waged by the White House administration for more than a year, the sentiment of eurozone producers gradually deteriorated because of the weakening external demand for goods from Europe. The situation will most likely get worse, since after the "solution of the problem with China", the United States will clearly return to a trade war with the EU. As for the consumer confidence index, it was -6.5 points in May against -6.5 points in April, which fully coincided with economists' forecasts. The index of confidence in the eurozone industry in May pulled closer to zero and was at the level of -2.9 points against -4.3 points in April. Although, it was predicted not to change. The index of confidence in the services sector of the eurozone in May continued to grow and amounted to 12.2 points against the forecast of 11.8 points. Data on lending in the euro area also turned out to be good news for traders and supported the euro in the current conditions of uncertainty. According to the report of the European Central Bank, household lending grew by 3.4% in April of this year after rising by 3.3% in March, which will certainly support retail sales and weaken economic growth in the 2nd quarter of this year. Lending to companies grew even more in April, amounting to 3.9% against 3.6% in March. As a result, the Eurozone M3 monetary aggregate increased by 4.7% in April with a growth forecast of 4.4%. Moreover, the Eurozone M3 monetary aggregate from February to April increased by 4.5%. However, reports alone are not enough to return the demand for the European currency. From a technical point of view, the correction is not yet complete, and a breakthrough in support of 1.1170 will only increase the pressure on the euro. More acceptable purchase levels can be traced at 1.1150 and 1.1110 lows. If the demand for the euro returns and a weak report on consumer confidence in the US may help the bulls in the afternoon, a break of the resistance at 1.1200 will lead to the formation of a new upward wave in risky assets and an update of large levels in the range of 1.1220 and 1.1250. The material has been provided by InstaForex Company - www.instaforex.com |
| Posted: 28 May 2019 07:24 AM PDT To open long positions on GBP / USD pair, you need: The technical picture has not changed. The British pound is on the verge of another major fall, but buyers still have a chance to continue the upward correction. In the second half of the day, buyers of the pound still need all of the same return and consolidation above the resistance of 1.2969. This will make it possible to count on a rapid growth to the maximum of 1.2744 and an update of the resistance of 1.2800, where I recommend taking profits. With a further decrease in the pound, you can open long positions on a false breakdown from the low of 1.2648 or on the rebound from the support of 1.2607. To open short positions on GBP / USD pair, you need: As long as trading will be below the resistance of 1.2696, pressure on the pound will continue. In support of this, a false breakdown was formed in the first half of the day at the level of 1.2696. However, the main task of the bears is the support of 1.2648 and a breakthrough of which can lead to an update of the minimum of 1.2607 and 1.2564, where I recommend taking profits. When the growth scenario is above 1.2696 in the second half of the day, you can return to sales of the pound immediately to rebound from a maximum of 1.2744. Indicator signals: Moving averages Trade is conducted in the region of 30 and 50 moving averages, which indicates the lateral nature of the market. Bollinger bands Volatility has decreased, which does not give signals for entering the market. Description of indicators MA (moving average) 50 days - yellow MA (moving average) 30 days - green MACD: fast EMA 12, slow EMA 26, SMA 9 Bollinger Bands 20 The material has been provided by InstaForex Company - www.instaforex.com |
| Posted: 28 May 2019 07:17 AM PDT To open long positions on EUR / USD pair, you need: The European currency only regained its morning position after the release of a report on consumer confidence in the eurozone, as well as lending, but the technical picture remained the same. To continue the upward impulse, it is necessary to get above the resistance of 1.1196, where the demand for the euro will increase. This will lead to an update of the highs of 1.1218 and 1.1243, where the upper limit of the current upward channel is located. In the event of a decline in the euro against the background of strong data on the American economy, support will be provided by the area of 1.1170 but it is best to open long positions from it, provided that a false breakdown is formed. I recommend to buy the EUR/USD pair for a rebound only after the testing of the minimum at 1.1143. To open short positions on EUR / USD pair, you need: False breakdown and decline under the resistance level of 1.1196 led to a slight decrease in the euro in the first half of the day. However, the main task of sellers is to return to the major support level of 1.1170, which will increase the pressure on the euro and lead to an update of the minimum of 1.1143, where I recommend taking profits. If the scenario is a weak report on consumer confidence in the US, it is best to return to short positions in EUR/USD pair after updating the maximum of 1.1218 or to rebound from a larger level of 1.1243. Indicator signals: Moving averages Trade is conducted in the region of 30 and 50 moving averages, which indicates the lateral nature of the market. Bollinger bands Volatility has decreased, which entered the market. Description of indicators MA (moving average) 50 days - yellow MA (moving average) 30 days - green MACD: fast EMA 12, slow EMA 26, SMA 9 Bollinger Bands 20 The material has been provided by InstaForex Company - www.instaforex.com |
| EUR / USD and GBP / USD: Forecast and Simplified wave analysis for May 28 Posted: 28 May 2019 07:06 AM PDT EUR / USD pair From the end of March, the direction of the euro price movement was set by a downward wave. We can state its ending given various factors such as the pronounced corrective nature of the wave, the completeness of its structure, the achievement of the target zone and the presence of a potential reversal model. In the bullish wave of May 23, a correction is being formed in the last days. Forecast: In the first half of the day today, a downward motion vector of the pair is expected, right up to its completion. By the end of the day, the likelihood of a change in the rate and a repeated price rise is increased. The daily range of travel is limited by oncoming settlement zones. Recommendations: Traders should be cautious in selling the European currency today since the short-term decline. In the area of support, it is recommended to start tracking reversal signals to search for entry into long positions. Resistance zones: - 1.1220 / 1.1250 Support areas: - 1.1170 / 1.1140 GBP / USD pair The latest wave of trading for intraday traders starts from May 3rd. The wave completes a larger downward formation. On May 21, the final section began, which in turn, the first parts (A+B) were already formed. Since yesterday, the price rolled upward. Forecast: Over the next trading sessions, the current flat mood of the pound movement is expected to complete. Next, it is expected to turn and the price move down major. A breakthrough beyond the lower boundary of the support zone is unlikely today. Recommendations: There are no conditions for buying pounds today. It is recommended to wait for the completion of the ascending movements and look for an opportunity to enter short positions in this instrument at their end. Resistance zones: - 1.2700 / 1.2730 Support areas: - 1.2630 / 1.2600 Explanations to the figures: The simplified wave analysis uses waves consisting of 3 parts (A – B – C). Each of these analyzes the last incomplete wave. Zones show calculated areas with the highest probability of reversal. The arrows indicate the wave marking by the method used by the author. The solid background shows the formed structure and the dotted exhibits the expected movement. Note: The wave algorithm does not take into account the duration of tool movements over time. The material has been provided by InstaForex Company - www.instaforex.com |
| EUR/USD and AUD/USD: Consumer confidence in Germany is falling while it is improving in Australia Posted: 28 May 2019 07:00 AM PDT The lack of important fundamental statistics forces many euro buyers to wait for more acceptable support levels to be updated. Report on consumer sentiment in Germany did not cause major changes in the market but will likely worsen in June of this year. The decline in sentiment is directly related to the weakening of economic expectations. According to the GfK research group, the leading consumer confidence index GfK fell to 10.1 points in June 2019 from 10.2 points in May. Data for May were revised downwards. Initially, it was reported that the index was 10.4 points. Economists had forecast that the indicator would be equal to 10.4 points in June. Initially, it was reported that the index was 10.4 points. Economists had forecast that the indicator would be equal to 10.4 points in June. According to Gfk, it is noted that the main fall of the index is directly dependent on the slowdown in the global economy, as well as incomprehensible scenarios Brexit. Key risk factors also include an escalating trade conflict with the United States. The index of economic expectations in May amounted to 1.7 points versus 3.0 points in April. Consumer expectations regarding revenues rose to 57.7 points from 56.8 points in April. Consumer confidence in France rose slightly. According to the report, the index increased to 99 points against 96 points in April of this year. Economists had forecast that consumer confidence in France would be at 97 points in May. As for the technical picture of the EUR/USD pair, further upward movement will directly depend on the resistance level of 1.1195. Only a break above this range will return the demand for risky assets and will lead to an update of yesterday's high near 1.1215 and then to the exit to the next large area of 1.1250. If the pressure on the euro continues and it can happen after the reports on the eurozone, the output of which is expected in the first half of the day. It is best to rely on long positions after updating a large support level in the area of 1.1150. The Australian dollar rose slightly after the report that Australian consumer confidence continued to improve last week and show growth against the background of talks about the coming reduction in interest rates of the Reserve Bank of Australia. According to the report, the indicator for assessing current financial conditions rose by 1.2%, while the index reflecting the assessment of current economic conditions added 3.0%. Australia's inflation expectations dropped in April. However, the statements of the American President Donald Trump returned to the market with a bearish sentiment. During the interview, Trump said that he had made significant progress in trade negotiations with Japan. Thus, duties on Chinese imports can be easily increased. As for the technical picture of the AUD/USD pair, the current alignment of forces remains on the buyers' side. However, this requires a breakthrough above the resistance of 0.6940, which will open a direct road to the area of the new and larger high 0.6980. While maintaining pressure on the Australian dollar, support will be the area of 0.6890. The material has been provided by InstaForex Company - www.instaforex.com |
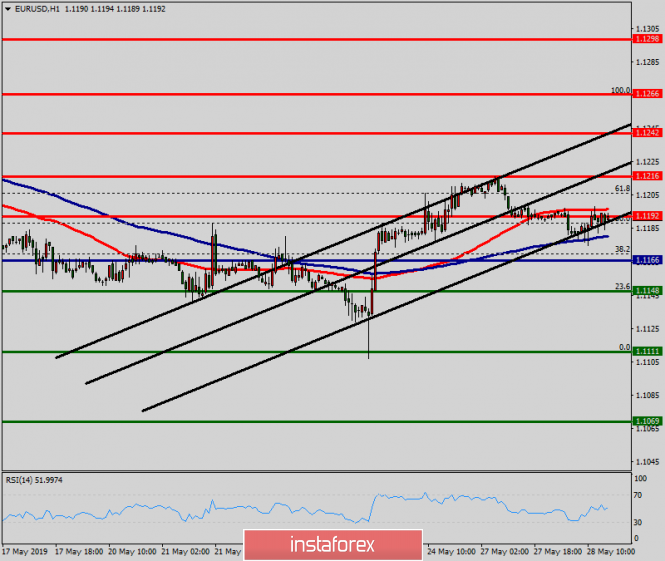
| Technical analysis of EUR/USD for May 28, 2019 Posted: 28 May 2019 06:22 AM PDT The EUR/USD pair continues to move downwards from the level of 1.1192. Last week, the pair dropped from the level of 1.1192 to the bottom around 1.1111. Today, the first resistance level is seen at 1.1192 followed by 1.1216, while daily support 1 is seen at 1.1111. According to the previous events, the EUR/USD pair is still moving between the levels of 1.1192 and 1.1111; for that we expect a range of 81 pips. If the EUR/USD pair fails to break through the resistance level of 1.1111, the market will decline further to 1.1069. This would suggest a bearish market because the RSI indicator is still in a positive area and does not show any trend-reversal signs. The pair is expected to drop lower towards at least 1.1069 with a view to test the second support. However, if a breakout takes place at the resistance level of 1.1192 (major resistance), then this scenario may become invalidated. The material has been provided by InstaForex Company - www.instaforex.com |
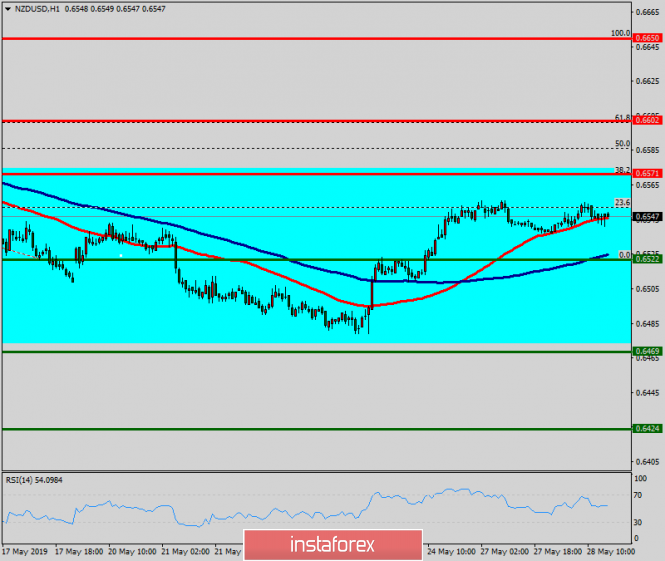
| Technical analysis of NZD/USD for May 28, 2019 Posted: 28 May 2019 06:07 AM PDT The NZD/USD pair is showing signs of weakness following a breakout of the lowest level of 0.6571. On the H1 chart, the level of 0.6571 coincides with 38.2% of Fibonacci, which is expected to act as minor resistance today. Since the trend is below the 38.2% Fibonacci level, the market is still in a downtrend. However, the resistance is seen at the level of 0.6571. Furthermore, the trend is still showing strength above the moving average (100). Thus, the market is indicating a bearish opportunity below the above-mentioned support levels, for that the bearish outlook remains the same as long as the 100 EMA is headed to the downside. Therefore, resistance will be found at the level of 0.6571 providing a clear signal to buy with a target seen at 0.6500. If the trend breaks the first supprt at 0.6500, the pair is likely to move downwards continuing the bearish trend development to the levels 0.6469 and 0.6424. The material has been provided by InstaForex Company - www.instaforex.com |
| Excess raw materials and falling demand are the main enemies of the oil market Posted: 28 May 2019 04:57 AM PDT According to experts, the past week was the worst for the oil market since the beginning of this year. The reasons for this is that experts believe the protracted trade conflict between the US and China, as well as the decline in global demand for black gold, and concerns about a possible surplus of raw materials. Prices for black gold collapsed primarily due to the escalation of the US-China trade war, analysts emphasized. Last Wednesday, May 22, the Energy Information Administration of the United States Department of Energy (EIA) announced an unexpected increase in oil and gasoline reserves amid growing production. Based on these data, the large investment bank Standard Chartered has calculated the bull-bear index, an indicator that determines the strength of the trend and the probability of its change in the oil market. In this week, this indicator has made 100 points, which shows the weakest data for the last six years. According to analysts, the decline in the black gold market was largely due to numerous interruptions in oil supplies and heightened tensions in the Middle East. Many experts believed that a sudden "bearish" turn in the oil market increases the chances of prolongation of OPEC+ production cuts for this year. Fears about the slowdown of the global economy also lead to a decrease in demand for oil, experts reminded. According to Bloomberg, small Chinese refineries reduce the processing of raw materials due to the growing oversupply of gasoline. The increase in stocks is a consequence of the weakening of demand and the negative impact of a trade war on the Chinese economy. The US economy is more stable as its performance is quite strong. In the first quarter of 2019, a significant increase in GDP was recorded and unemployment in the United States is at a historic low. If economic growth weakens, experts predicted a sharp drop in demand for crude oil. According to the International Energy Agency (IEA), global demand for black gold increased by in the first quarter of this year by 640 thousand barrels per day. This is much less than the previous estimate of growth at 1 million barrels per day. Lower than expected growth rates led to an oversupply of 0.7 million barrels of oil per day, analysts emphasized. IEA experts have reduced the demand forecast for this year in the expectation that it will grow in the second half of 2019. However, some experts believe that this is unlikely given the escalation of the trade war and the global sale of shares. The material has been provided by InstaForex Company - www.instaforex.com |
| Bitcoin: The real Bitcoin market is efficient and streamlined Posted: 28 May 2019 04:54 AM PDT Bitwise Asset Management came to this conclusion, stating that the market can be reduced by almost 95% if the reports eliminate the fabricated volumes and fictitious data from CoinMarketCap. However, the rest will be supported by a regulated market of significant derivatives and be very effective. Bitcoin (BTC) buy signal: The task of Bitcoin buyers is to break through the range of 8,900, which will lead to new highs of 9,100 and 9,300, where I recommend taking profits. Those who still believe in decline and correction of Bitcoin can wait for the renewal of 8,480 minimums or buy for a rebound from 8,120. Bitcoin Sales Signal (BTC) Yesterday, an unsuccessful breakthrough of the resistance of 8,900 has already taken place but a major sell-off did not happen. It is best to return to short positions in Bitcoin at the next unsuccessful breakdown of 8,900 with confirmation of divergence on the MACD indicator, which will be the first signal to open short positions. However, more acceptable levels for selling Bitcoin are seen in the region of 9,100 and a little higher in the region of 9,300. The purpose of the bears is to return the cryptocurrency rate to the support area of 8,480. |
| EUR / USD plan for the European session on May 28. Euro buyers still have a chance to resume growth Posted: 28 May 2019 03:28 AM PDT To open long positions on EUR / USD pair, you need: The upward momentum in the pair is slowing down, but there is still hope for its continuation. To do this, you need to get above the resistance of 1.1196, where the demand for the euro will increase. This will lead to an update of the highs of 1.1218 and 1.1243, where the upper limit of the current ascending channel is located. In the event of a decline in the euro against the background of weak data on lending and consumer confidence, support will be provided by the area of 1.1170. But to open long positions from it, it is best when the false breakdown is formed. I recommend buying EUR/USD for a rebound only after testing the minimum of 1.1143. To open short positions on EURUSD you need: False breakdown and a decline below the resistance level of 1.1196 will be a signal to open short positions in euros. The main task for the first half of the day will be to return to a major support level of 1.1170, which will increase the pressure on the pair and will lead to an update of the minimum of 1.1143, where I recommend fixing the profit. With a scenario of good fundamental data and an increase in consumer confidence in the Eurozone, it is best to return to short positions in EUR/USD pair after updating the maximum of 1.1218 or to rebound from a larger level of 1.1243. Indicator signals: Moving averages Trade is conducted just below 30 and 50 moving averages, which indicates a probable return to the market of euro sellers. Bollinger bands In case of euro growth in the first half of the day, the upward trend may be limited by the upper limit of the indicator in the region of 1.1200. Description of indicators MA (moving average) 50 days - yellow MA (moving average) 30 days - green MACD: fast EMA 12, slow EMA 26, SMA 9 Bollinger Bands 20 The material has been provided by InstaForex Company - www.instaforex.com |
| Posted: 28 May 2019 03:28 AM PDT EUR / USD pair Bidding on the EUR/USD pair on Monday, May 27, ended with a decline of 15 basis points. Thus, the pair shows a willingness to resume building a downward trend within the proposed wave 3 with a complication in wave 2, 3, 3. If this is true, the decline will continue with targets located near the Fibonacci level of 161.8%. News background is now completely neutral for the pair. At the end of last week, the euro received support from weak news from the US on business activity and orders for durable goods. But the effect of the publication of these news has already passed and the market is again moving to a more usual occupation for itself in recent months of sales of the euro and purchases of the dollar. Today, the news background is unlikely to help the euro finish the day without a loss. Sales targets: 1.1097 - 161.8% Fibonacci 1.1045 - 200.0% Fibonacci Purchase targets: 1.1324 - 0.0% Fibonacci General conclusions and trading recommendations: The euro/dollar pair remains at the stage of building a downtrend trend. The signal from the MACD was formed downward. Therefore, I recommend selling the euro with the targets of 1.1097 and 1.1045, which corresponds to 161.8% and 200.0% in Fibonacci. A restrictive order is recommended to be placed above the level of 76.4% Fibonacci with an unsuccessful attempt to break through which led to a new decrease in the instrument. GBP / USD pair On May 27, the GBP/USD pair lost 30 basis points. Since the situation in the UK is not yet resolved, the markets continue to be unprepared for buying the sterling pound. Even if you do not take into account the situation with Brexit and the resignation of Theresa May, the economic situation in the United Kingdom leaves much to be desired. The investment climate is zero, many well-known companies, whose production is located in Britain, want to move it out of the country. The pound has been falling for several years in a row but how the Brexit will it end is not clear. Additionally, the country is losing money because of Brexit now. In such circumstances, it is difficult to expect from the market zealous purchases of a pound. The wave pattern still assumes the construction of a downward trend and its wave. The MACD indicator has given a downward signal but the news background is now neutral. Sales targets: 1.2554 - 200.0% Fibonacci 1.2360 - 261.8% Fibonacci Purchase targets: 1.3175 - 0.0% Fibonacci General conclusions and trading recommendations: The wave pattern of the pound/dollar instrument suggests a resumption of the instrument decline within the estimated wave c. Thus, I still recommend selling the pound now with targets located near the calculated levels of 1.2554 and 1.2360, which corresponds to 200.0% and 261.8% Fibonacci. In small amounts at first and in the case of new headlines that will support the dollar, it will be possible to increase sales. The material has been provided by InstaForex Company - www.instaforex.com |
| Review for GBP/USD pair on May 28: The forecast for the Posted: 28 May 2019 02:35 AM PDT 4 hour timeframe Technical details: Senior linear regression channel: direction - down. The younger linear regression channel: direction - down. Moving average (20; smoothed) - down. CCI: -10.8979 In the case of the technical picture of the sterling pound, everything is much compared to the euro. The pound/dollar pair corrected to the moving average then rebounded from it. The Heiken Ashi indicator turned down and the downward movement resumed. However, from a fundamental point of view, everything remains extremely confusing. Half a year ago, everyone expected Brexit to take place on time (March 29) and this epic would be ended. Now, when two "extra" months have passed, it can be said that the country hasn't come close to getting out of the jurisdiction of Brussels one iota. Moreover, Theresa May will retire anyway. The current parliament showed only that it is not able to reach agreement on the most important issue for Great Britain in the past 10 years. Even the country's two main parties, Labor and Conservatives, could not agree at the time when this agreement was needed. First of all, by him, in order to maintain his credibility in the eyes of the electorate. The subsequent local and European Parliament elections showed perfectly what the disagreements between themselves and the inability to come to a common denominator cost both parties. Just yesterday, Labor leader Jeremy Corbin announced the need for a second referendum in order for the population to decide the fate of Brexit. Also, Corbin said that the situation can be saved by early parliamentary elections. Nearest support levels: S1 - 1.2634 S2 - 1.2573 Nearest resistance levels: R1 - 1.2695 R2 - 1.2756 R3 - 1.2817 Trading recommendations: The GBP/USD pair has completed an upward correction. Thus, it is now recommended to resume sales of the sterling pound with targets of 1.2634 and 1.2573. Long positions are recommended to be considered only after the pair has been fixed above the movement with targets of 1.2756 and 1.2817. However, the bulls remain fairly weak at the moment. In addition to the technical picture should also take into account the fundamental data and the time of their release. Explanations for illustrations: The senior linear regression channel is the blue lines of unidirectional movement. The junior linear channel is the purple lines of unidirectional movement. CCI is the blue line in the indicator regression window. The moving average (20; smoothed) is the blue line on the price chart. Murray levels - multi-colored horizontal stripes. Heiken Ashi is an indicator that colors bars in blue or purple. The material has been provided by InstaForex Company - www.instaforex.com |
| China does not want to devalue the yuan: AUD and NZD get a chance for corrective growth Posted: 28 May 2019 02:30 AM PDT The likelihood of a short-term trade agreement between China and the US has declined, as the Trump administration is considering banning the sale of US technology to a large number of Chinese companies. In turn, Beijing refuses to resume negotiations when such threats arise. The head of the Federal Reserve Bank of Dallas, Robert Kaplan, said that China could devalue its currency in order to smooth the impact of higher US trade duties. However, is it beneficial for China? Most likely, concerns about a significant devaluation of the RMB as one of the retaliatory measures are exaggerated. Of course, such a move can mitigate the effects of higher tariffs for exporters, but it can bring even more problems than benefits. The People's Bank of China (NBK) has already made certain changes to the yuan market value formula when the first tariff increase from 10% to 25% occurred and both deputy heads of the NBK Liu Guoqiang and Pan Gunshen recently spoke publicly, promising a stable yuan. There are other reasons not to assume a weakening of the yuan, particularly the likelihood of growing internal panic and capital outflows, which in the end could provoke a financial crisis and weaken the fundamental indicators of the Chinese economy. A weaker currency will undermine China's efforts to internationalize the yuan, which is clearly not in the plans of the country's leadership. Thus, China's response will most likely be selective, which will not be detrimental to exports. As a result, stable exports also mean stable imports, which gives some support to the main suppliers of raw materials to China, including Australia and New Zealand. AUD/USD pair Signals from the RBA indicate the regulator's willingness to cut the rate by a quarter percent at the next meeting in June. This forecast is generally supported by markets that focus on expanding the yield spread in favor of the USD, which makes it possible to predict a decrease in the AUD against the dollar over the coming weeks. At the same time, the main macroeconomic indicators are far from being considered negative. The growth rate of wages in Q1 of 2.3% y/y is quite sufficient to count on price increases, as well as trade balance and current account surplus. The PMI in the manufacturing sector is surely above 50p and GDP growth rates do not give rise to fears of a recession. The main factor that can lead to a decrease in the RBA rate is low inflation. Very low rates of construction and a weak housing market require lower mortgage rates. Moreover, if housing prices stabilize, then after some delay inflation may begin to stabilize. In turn, this will reduce the threat of a rate cut. Until the end of the week, data on new home sales in April, the number of new building permits and private sector lending will be published. Any improvement in performance relative to March is able to support the AUD in favor of retracement and technical factors. The AUD/USD pair has formed support at 0.6860/70 and has good chances to seize the moment and roll back a little higher. The immediate goal is 0.70 and the movement may develop to 0.7070/80 but the achievement of this level should be supported by new positive factors. NZD/USD pair The coming week will be devoted to issues of financial stability and budget prospects. Today, RBNZ will present a semi-annual report on financial stability. A little later, the business forecast from ANZ will be released. On Thursday, the Treasury report on the budget is scheduled, then on Friday, ANZ will provide new consumer confidence data. The RBNZ will provide private sector lending. The decrease in the RBNZ on May 8 was a response to a slowdown in GDP growth and low inflation, which in the first quarter was only 1.5% y/y. It is still too early to expect a recovery in the consumer sector after the rate cut. Expectations from the Treasury report are rather negative since tax revenues are expected to decline. Kiwi currently has no clear direction. The three-month decline period has been completed and the support level of 0.6427 was not reached. Its chance for corrective growth has increased. Kiwi will trade sideways and corrective growth may stop at 0.6575/80 zone while waiting for the Treasury report. The material has been provided by InstaForex Company - www.instaforex.com |
| Posted: 28 May 2019 01:46 AM PDT 4 hour timeframe Technical details: Senior linear regression channel: direction - down. Younger linear regression channel: direction - down. Moving average (20; smoothed) - sideways. SSY: 29.4535 Monday, May 27, ended logically enough - a downward correction to the moving average line. No important macroeconomic reports were published in the States or the European Union on this day, so the traders had nothing to respond to. But today will be extremely important, from our point of view, to determine the future trend for the euro/dollar pair. Since no macroeconomic statistics are also planned for today, traders will rely on their own trading forecasts for trading techniques when making trading decisions. And, accordingly, if the EUR / USD pair manages to overcome the moving today, this will mean that traders are still looking to the downside. Based on this, it will be possible to expect not only the resumption of the downward trend, which still persists in 2019 without any complaints, but also updates the latest prices lows. The price rebound from the MA can provoke a resumption of the upward movement, however, traders now do not clearly want to buy the pair, especially without fundamental support. On the other hand, bulls remain extremely weak, and the market is clearly not set up to purchase Eurocurrency in a longer term than intraday. Thus, there is no new information on the trade wars between the United States, EU and China. Nearest support levels: S1 - 1.1169 S2 - 1.1139 S3 - 1.1108 Nearest resistance levels: R1 - 1,1200 R2 - 1.1230 R3 - 1.1261 Trading recommendations: The EUR / USD currency pair has begun to be adjusted, and this correction may develop into a full-fledged movement downwards. Thus, buy orders with targets at 1.1230 and 1.1261, but in small lots, are still relevant, since both linear regression channels are still directed downward, and only in the case of a rebound, the price will move. It is recommended to consider selling orders for the euro / dollar pair only after fixing the price below the moving with targets 1.1139 and 1.1108. In addition to the technical picture, we should also take into account the fundamental data and the time of their release. Explanations for illustrations: The senior linear regression channel is the blue lines of unidirectional movement. The younger linear regression channel is the violet lines of unidirectional movement. CCI - blue line in the indicator window. The moving average (20; smoothed) is the blue line on the price chart. Murray levels - multi-colored horizontal stripes. Heiken Ashi is an indicator that colors bars in blue or purple. The material has been provided by InstaForex Company - www.instaforex.com |
| Trading plan for EUR / USD and GBP / USD for 05/28/2019 Posted: 28 May 2019 01:31 AM PDT Although the Memorial Day was celebrated in the United States yesterday, the dollar was able to unexpectedly strengthen its position in the absence of American traders. Everybody is shouting about the fact that the matter is in Austria and Italy, which have begun to stir up the water. Thus, in Austria, a political scandal continues, hyped by the German media due to the fact that the former Vice-Chancellor promised to support allegedly Russian entrepreneurs. It came to the point that the parliament passed a vote of no confidence in the government and the chancellor. Although the Chancellor himself even earlier announced the dissolution of the ruling coalition, which already implies going to early elections. Italy, on the other hand, continues to be afraid of exceeding the permissible level of budget deficit this time, in order to reduce the unemployment rate from 10.2% to 5.0%. If Italy goes to such a serious crime against the will of Germany, then penalties will be imposed on it, and it also threatens to worsen the situation with the servicing of public debt, which carries a threat to the entire euro area. And although these reasons look quite logical and pretty, they do not give an answer to the most interesting question - why did the pound weaken more than the single European currency? Apparently, we are witnessing a gradual realization that Brexit will be fun and festive, that is, without any deal, with unpredictable consequences. The fact that this is not good for the economy of the United Kingdom is obvious. But for the European Union, the outcome is quite difficult to predict. Yes, Jean-Claude Juncker beat his heel many times on his chest and swore on blood that Europe had already prepared for this parade of all the armed forces. Like, they took such a bunch of regulations that there would be no negative consequences. However, these are just words, and how it will be in practice, the question is quite interesting. So while in the UK, they are engaged in such a fascinating business as the selection of a new prime minister from among the eurosceptics, investors gradually come to understand that little will change from this, and everything goes according to the worst case scenario. Especially if the new prime minister will be Boris Johnson, who openly advocates Brexit without a divorce agreement. Although no one is resting today, the macroeconomic calendar is practically empty. Thus, we can pay attention to data on consumer lending in Europe. The growth rate of which should accelerate from 3.2% to 3.3%. On the other side of the Atlantic, S & P / Case-Shiller data on housing prices are published. The growth rates of which can slow down from 3.0% to 2.8%. But the data itself is not so important, and the maximum that they can do is to somewhat hold back the negative due to the risk of an uncontrolled Brexit. The euro / dollar currency pair shows a recovery after a sharp rise, where the quotation went down again to the level of 1.1180. It can be probably assume amplitude fluctuations within this value, with the amendment of 20-30 points. The currency pair pound/dollar after the corrective movement, went into the recovery phase, rolling back to the limit of 1.2680 which probably suggest a temporary stagnation in the range of 1.2660 / 1.2700. |


| You are subscribed to email updates from Forex analysis review. To stop receiving these emails, you may unsubscribe now. | Email delivery powered by Google |
| Google, 1600 Amphitheatre Parkway, Mountain View, CA 94043, United States | |
No comments:
Post a Comment