
Forex analysis review |
- Gold back inside indecision zone and important resistance
- Weekly fake break out for the Dollar index
- May 3, 2019 : EUR/USD Intraday technical analysis and trade recommendations.
- GBP/USD. May 3. Results of the day. Traders ignored the NonFarm Payrolls, but pay attention to the ISM index
- EUR/USD. May 3. Results of the day. Inflation in the eurozone is accelerating but still remains below 2.0%
- Bitcoin analysis for May 03, 2019
- Analysis of Gold for May 03, 2019
- EUR./USD analysis for May 03, 2019
- EUR / USD plan for the US session on May 3. Euro buyers ignore good eurozone inflation
- EUR and GBP: the euro and the pound remain under pressure, despite the positive data on inflation and services
- The Fed has set the euro in check
- GBP / USD plan for the US session on May 3. Pound declines amid weak PMI for UK services
- The Australian dollar can surprise traders – experts
- Technical analysis of NZD/USD for May 03, 2019
- EUR / JPY Daily. Prospects for the development of the movement in May 2019. Analysis of APLs & ZUP
- GBP / USD Daily. Prospects for the development of the movement in May 2019 Analysis of APLs & ZUP.
- Technical analysis of USD/CAD for May 03, 2019
- Euro weakens amid rising dollar value
- EUR / USD Daily. Prospects for the development of the movement in May 2019. Analysis of APLs & ZUP
- BITCOIN Analysis for May 3, 2019
- Wave analysis of GBP / USD for May 3. Bank of England has not given the markets food for thought
- EURUSD movement will depend on data on the US labor market
- Wave analysis of EUR / USD for May 3. Euro is ready to decline, will the news prevent this scenario?
- Fed showed teeth: selling EUR/USD and GBP/USD pairs
- GBP/USD: plan for the European session on May 3. The pound is ready to continue its decline
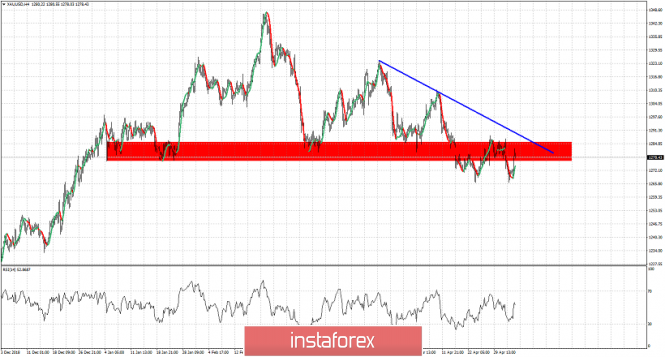
| Gold back inside indecision zone and important resistance Posted: 03 May 2019 01:26 PM PDT Gold price is challenging short-term important resistance. Medium-term trend remains bearish as long as price is below $1,300, but Gold in the short-term has formed a double bottom as we mentioned in previous posts and is challenging resistance.
Blue line - short-term trend line resistance Gold price is back inside the resistance area of $1,280-90. Price has formed a double bottom and has so far bounced closer to the important resistance level of $1,300. Support remains at $1,266 and if broken we will see a move towards $1,250-60 or lower. Breaking above $1,300 will open the way for a move towards $1,350-60 and higher. The material has been provided by InstaForex Company - www.instaforex.com |
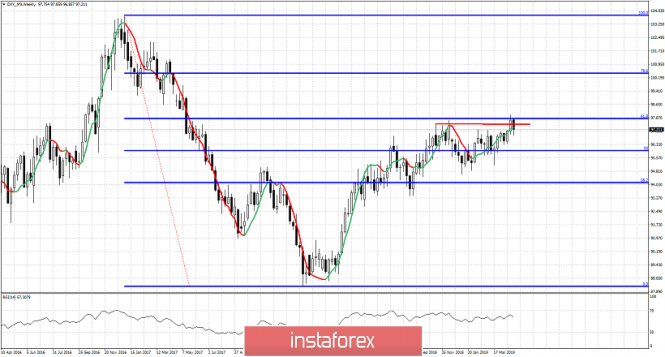
| Weekly fake break out for the Dollar index Posted: 03 May 2019 01:21 PM PDT The Dollar index managed to spread enthusiasm among Dollar bulls as last week we saw prices finally break out and above the December 2018 highs. This week however ended with an entire different sentiment.
The Dollar index closed this week below the broken red horizontal resistance canceling the break out we witnessed last week. However not all is lost yet for Dollar bulls. Yes the weekly close is not good for the bullish trend, but price continues to make higher highs and higher lows. The Dollar index continues to trade around the 61.8% Fibonacci retracement of the entire decline. A rejection and bearish reversal from current levels will be confirmed with a break below 95.15. This would have longer-term bearish implications for the index. Until then bulls still hope that the bullish trend will be revived next week and price we recapture the red horizontal resistance trend line. A weekly close above 97.75 will open the way for a move towards 100.45. The material has been provided by InstaForex Company - www.instaforex.com |
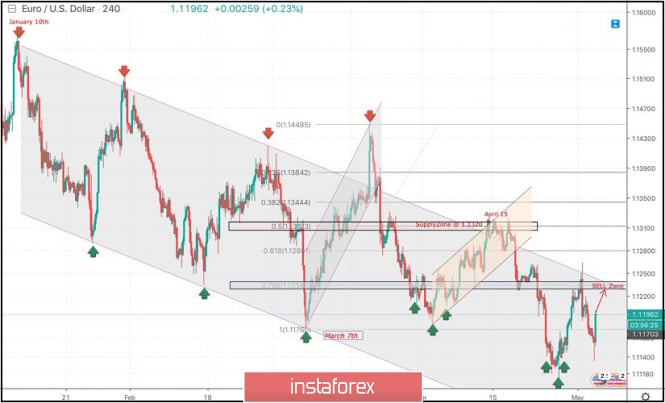
| May 3, 2019 : EUR/USD Intraday technical analysis and trade recommendations. Posted: 03 May 2019 10:14 AM PDT
Few weeks ago, a bullish Head and Shoulders reversal pattern was demonstrated around 1.1200. This enhanced further bullish advancement towards 1.1300-1.1315 (supply zone) where significant bearish rejection was demonstrated on April 15. Short-term outlook turned to become bearish towards 1.1280 (61.8% Fibonacci) then 1.1235 (78.6% Fibonacci). For Intraday traders, the price zone around 1.1235 (78.6% Fibonacci) stood as a temporary demand area which paused the ongoing bearish momentum for a while before bearish breakdown could be executed on April 23. Currently, the price zone around 1.1235-1.1250 has turned into supply-zone to be watched for bearish rejection. Two days ago, a recent bullish head and shoulders pattern was being demonstrated around 1.1140 on the H4 chart. That's why, conservative traders were suggested to wait for another bullish pullback towards 1.1230-1.1250 for a valid SELL entry. Today, bearish persistence below 1.1175 was needed to ensure further bearish decline. However, the market has failed to sustain bearish pressure below 1.1175. Hence, Further bullish advancement is expected to occur towards the depicted SELL zone around 1.1235 to generate sufficient bearish pressure for another bearish swing. Trade recommendations : Conservative traders should wait for another bullish pullback towards 1.1235 for a valid SELL entry. S/L should be placed around 1.1275 to narrow the risk. Target levels to be located around 1.1170 and 1.1130. The material has been provided by InstaForex Company - www.instaforex.com |
| Posted: 03 May 2019 07:25 AM PDT 4-hour timeframe The amplitude of the last 5 days (high-low): 42p - 125p - 123p - 73p - 64p. Average amplitude over the last 5 days: 85p (86p). The week ends for the GBP/USD pair with a very moderate decline and the development of the critical line. The decline is small, even despite an impressive block of macroeconomic data from the United States. Almost all reports were in favor of the US currency, but this was not the reason for traders to increase purchases of the US currency. It should also be noted that the business activity index in the UK services sector also did not attract any attention of traders, although it did not reach the forecast value, still exceeded the mark of 50.0. From a technical point of view, on the contrary, everything turns out perfectly. The pair worked out the Kijun-Sen line, failed to overcome it and therefore can resume the upward movement, which is very illogical from a fundamental point of view. It should also be noted the low correlation between the euro and the dollar in recent days. The euro falls with pleasure and without interference, the pound – with great difficulty. Just a few minutes ago, it became known that the business activity index in the US ISM services sector was significantly worse than the forecast (55.5 against 57.0), which caused purchases of the British pound and euro. Thus, the week still ends for the pound sterling favorably and is absolutely logical from a technical point of view. However, we continue to insist that there is still no significant fundamental background for the long-term strengthening of the pound. Trading recommendations: The GBP/USD currency pair rebounded from the critical line and, thus, completed the downward correction. Therefore, long positions remain relevant to the objectives at 1.3084 and 1.3108. Sell orders can only be considered after the price is fixed below the Kijun-Sen line with the first target at 1.2939. However, this option should be considered as early as next week. In addition to the technical picture should also take into account the fundamental data and the time of their release. Explanation of the illustration: Ichimoku indicator: Tenkan-sen - the red line. Kijun-sen - the blue line. Senkou Span A - light brown dotted line. Senkou Span B - light purple dotted line. Chinkou Span - green line. Bollinger Bands indicator: 3 yellow lines. MACD Indicator: A red line and a histogram with white bars in the indicator window. The material has been provided by InstaForex Company - www.instaforex.com |
| Posted: 03 May 2019 07:25 AM PDT 4-hour timeframe The amplitude of the last 5 days (high-low): 63p - 42p - 53p - 78p - 48p. Average amplitude over the last 5 days: 57p (56p). On the last trading day of the week, a sufficiently large amount of macroeconomic data was published. First, it is inflation in the EU, which accelerated from 1.4% to 1.7% y/y. Unfortunately for the euro, this report did not provide any support to it, most likely due to the fact that the inflation value still remains below the target level set by the ECB. Secondly, the number of new jobs created outside the agricultural sector was published in the States. This number seriously exceeded the predicted value (263,000 against 185,000). However, the US dollar, which, in principle, is becoming more expensive all day, cannot be said to have received significant support from traders. The unemployment rate also pleased investors, falling from 3.8% to 3.6%. Only the average wage showed a smaller increase than experts expected (+3.2% against the forecast of +3.3%). In general, we can say that all the news was in favor of the dollar. Thus, we expect that the pair will continue to decline, unless the latest reports of the day (indices of business activity in the US services sector) fail. On Monday morning, thus, you can also expect a downward movement, as today the European stock exchanges were deprived of the opportunity to work out all the information from the States. The trend for the instrument remains downward, the US economy still looks stronger compared to the European one. Therefore, the balance of power between currencies does not change at all. Only from time to time do individual reports support the euro, and only for a short time. Thus, we believe that the fall of the pair will continue in the medium term. Trading recommendations: The pair EUR/USD continues its downward movement. The nearest target for short positions is the level of 1.1100. The reversal of the MACD indicator to the top will signal an upward correction round. Long positions are recommended to be considered not earlier than fixing the pair above the critical line and the Senkou Span B line. In this case, the trend for the instrument will change to an upward one, but this is unlikely to happen today. In addition to the technical picture should also take into account the fundamental data and the time of their release. Explanation of the illustration: Ichimoku indicator: Tenkan-sen - the red line. Kijun-sen - the blue line. Senkou Span A - light brown dotted line. Senkou Span B - light purple dotted line. Chinkou Span - green line. Bollinger Bands indicator: 3 yellow lines. MACD Indicator: A red line and a histogram with white bars in the indicator window. The material has been provided by InstaForex Company - www.instaforex.com |
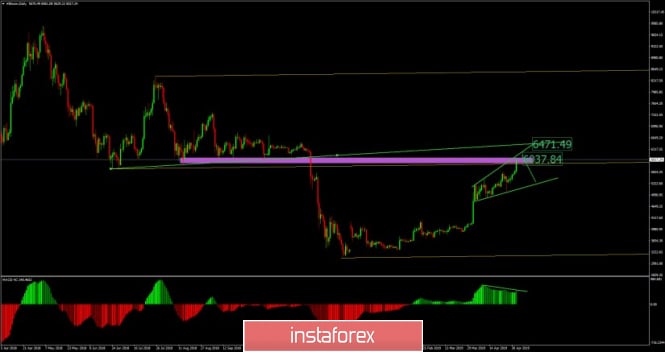
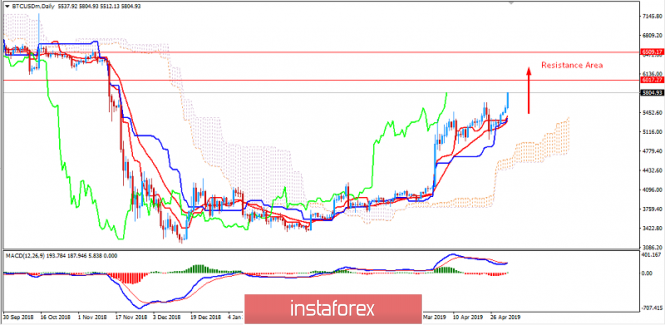
| Bitcoin analysis for May 03, 2019 Posted: 03 May 2019 07:18 AM PDT Strong bullish momentum on the Bitcoin. The price hit the level of $6.030. A new study reveals surging investments in cryptocurrencies by institutional investors, with almost half of them viewing crypto assets as having a place in their portfolios. "Institutional investors are overwhelmingly favorable about the appealing characteristics of digital assets," Fidelity Investments described. This is positive sign for BTC and it did bring more confidences to investors.
Technical picture: Purple horizontal rectangle – resistance cluster Orange median line – Pitchfork median line (mean)/resistance Upper rising green line – Diagonal resistance Strong bullish movement on the BTC today and price finally managed to test key resistance at $6.040. Our view is that buying looks extremely risky cause of multiply resistance levels around $6.031-$6.400. Anyway, the demand is still strong and you should watch for potential bearish divergence on lower frames to confirm potential downward correction. Down references are seen at $5.658 and $5.338. The material has been provided by InstaForex Company - www.instaforex.com |
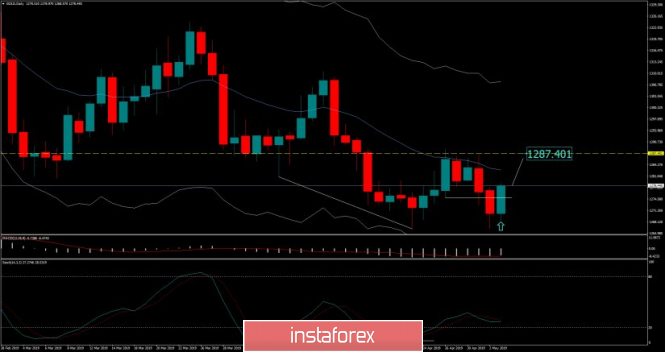
| Analysis of Gold for May 03, 2019 Posted: 03 May 2019 07:02 AM PDT Gold has been trading upwards today and the momentum is on the upside. We see potential more upside in the next period so buying opportunities are preferable.
Yellow horizontal line – resistance cluster Blue line – Median Keltner line 20 EMA (current resistance) White horizontal line – Broken resistance Strong bullish movement on the Gold today and baking into the 4-day trading range. The fact that Gold did back into the trading range is telling us that sellers didn't have power to sustain down break and that buyers reacted. The resistance at the price of $1.275 didn't hold and buyers are in control. Key short-term upward reference is seen at $1.287. Daily bullish divergence on the Stochastic oscillator is still in the background and that is another sign of potential strength on the Gold. The material has been provided by InstaForex Company - www.instaforex.com |
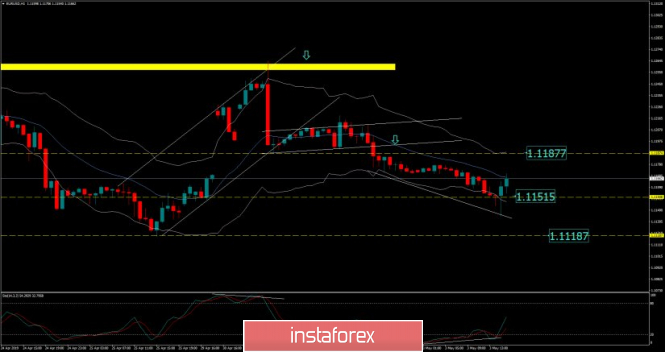
| EUR./USD analysis for May 03, 2019 Posted: 03 May 2019 06:53 AM PDT EUR/USD has been trading downwards as we expected and our main target is met at the price of 1.1151. Post Non-Farm Employment Change did bring us rejection from the support and there is chance for the upward correction.
Yellow horizontal line – strong support Blue line – Median Keltner line 20 EMA (current resistance) EUR/USD did amazing job with our downside view yesterday and the key target at 1.1151 has been met. Anyway, the rejection after the test happened and there is a chance for upward correction till end of the day. We found good resistance at the price of 1.1187 (previous swing low became resistance) and at the price of 1.1210. The trend is still downward but the strong rejection from support is not good sign of further downward continuation. Anyway, if you see the breakout of 1.1151, there is potential for the test of 1.1118. The material has been provided by InstaForex Company - www.instaforex.com |
| EUR / USD plan for the US session on May 3. Euro buyers ignore good eurozone inflation Posted: 03 May 2019 06:09 AM PDT To open long positions on EUR / USD pair, you need: Despite good data on inflation in the eurozone in April of this year, euro buyers are in no hurry to return to the market. Currently, a large support level of 1.1150 has been reached and the report on the American labor market will most likely determine the future direction, which is released in the second half of the day. In the case of a false breakdown at the level of 1.1150, you can count on a larger increase in EUR/USD pair in the area of resistance at 1.1188 and 1.1223, where I recommend taking profits. With a scenario of good data and a further reduction in the pair, you can take a closer look at the rebound from the 1.1115 low. To open short positions on EUR / USD pair, you need: The bears got to the support of 1.1150 and its breakdown together with good data on the labor market will lead to a new wave of sales of the European currency with the update of the main weekly target in the area of 1.1115, where I recommend taking profits. In the case of the EUR/USD growth scenario after the release of data, short positions can return on a false breakdown in the area of 1.1188 or on a rebound from a larger maximum of 1.1223. Indicator signals: Moving averages Trading is below 30 and 50 moving averages, which indicates the bearish nature of the market. Bollinger bands In the case of a euro company in the afternoon, the upper limit of the indicator in the area of 1.1188 will act as resistance. Description of indicators MA (moving average) 50 days - yellow MA (moving average) 30 days - green MACD: fast EMA 12, slow EMA 26, SMA 9 Bollinger Bands 20 The material has been provided by InstaForex Company - www.instaforex.com |
| Posted: 03 May 2019 06:06 AM PDT Despite a good increase in inflationary pressure, which was higher in the eurozone than economists' forecasts, the European currency continued to decline against the US dollar, under pressure after a series of weak fundamental statistics released during this week. A number of experts note that the lack of demand for the euro, after the release of inflation data, was due to the fact that traders took into account the current inflation in quotations even before the publication of the report. According to the data, annual inflation in the eurozone in April 2019 came even closer to the target level of 2%, which was set by the European Central Bank. The statistics agency report states that the eurozone's preliminary CPI in April rose 1.7% over the same period last year, after rising 1.4% in March. Economists had expected the index to grow by 1.5%. Core inflation, which does not take into account volatile categories of goods, in the eurozone in April amounted to 1.2% against 0.8% in March. Current data suggest that the European Central Bank is likely to refuse additional incentives during the June meeting. However, it is necessary to note that the general inflation growth, as before, was due to the acceleration of energy prices, which is a very volatile indicator. During his speech, President of the Central Bank of Germany Jens Weidmann said that the European Central Bank should not postpone returning to a more normal monetary policy. This must be done immediately when economic conditions permit. Weidmann is confident that the current slowdown in the German economy is temporary, focusing on some recovery in personal consumption. A supporter of a tougher policy — the president of Germany's central bank — reiterated that extraordinary monetary stimulus measures cannot be applied every time economic growth slows down, as all this can lead to an increase in unjustified risks and negative side effects. As for the technical picture of the EURUSD pair, the further downward movement will depend on the support level of 1.1150, the breakthrough of which will push risky assets further down to the area of 1.1110 and 1.1040. The British pound fell slightly after the data on the index of purchasing managers for the services sector in the UK, which rose in April but was worse than economists' forecasts. According to the data, despite the growth of activity in the UK services sector, the pace remains restrained. Thus, the index was 50.4 points in April against 48.9 points in March. Economists had expected the index to rise to 50.5 points. The company IHS Markit noted that companies continue to report an increase in labor costs and a weakening of sales, while employment data for the reporting period remained almost unchanged. The material has been provided by InstaForex Company - www.instaforex.com |
| The Fed has set the euro in check Posted: 03 May 2019 05:47 AM PDT On Forex, hopes are constantly replaced by disappointment and these give way to new hopes. You need to get used to it in order to survive. At the end of April, after the release of eurozone GDP statistics, the EUR/USD bulls believed that the downtrend was finally over. However, Jerome Powell dissuaded them in this. It would seem that the statement by the Fed chairman about the temporary nature of the slowdown in inflation should not have stirred up the markets. In fact, when they are almost 70% sure of the reduction in the federal funds rate in 2019, the Central Bank's lack of concern about the reduction in the growth rate of the PCE produces a bomb effect. Contrary to pessimistic forecasts from Markit with its declining business activity, the eurozone economy turned out to be much more resistant to external shocks than what could have been supposedly. In the first quarter, the GDP grew by 0.4% q/q and by 1.2 g/g, although purchasing managers' indices indicated a modest expansion of 0.2% q/q. When temporary negative factors disappear and the de-escalation of the trade conflict between Washington and Beijing gives hope for a V-shaped economic recovery of the Middle Kingdom and the growth of German exports, the EUR / USD bulls turned for a counterattack. Rumors began to circulate in the market that LTRO would not be as generous as it was previously expected that it was possible to draw a bottom under the euro in the $ 1.1-1.12 area, amid the growing likelihood of a reduction in the federal funds rate in 2019. Alas, yet, Jerome Powell and his company had a different opinion. Dynamics of European GDP If in March the Fed was seriously concerned about the slowdown in inflation. Then, why did the Central Bank's fears disappear at a time when the personal spending index really slowed down to 1.6% y/y? Does the Fed know what everyone else doesn't know? This is true, judging by optimistic forecasts for the April consumer price index (+ 2.1% after + 1.9% in March) and core inflation (+ 2.1% after 2%). The release of data on US CPI promises to be the key event of the week by May 10, while investors are trying to digest what Jerome Powell said. In my opinion, the markets paid too much attention to the word "temporary" and completely lost sight of the word "symmetrical". The Fed is changing approaches to inflation targeting. She is willing to tolerate PCE above the 2% target in periods of economic growth and below 2% in times of recession. The average indicator will be monitored, which means that the rate may not change for a very long time. US inflation dynamics From a fundamental point of view, this means that the fate of dollar pairs will not depend on the dollar. In order to weaken the EUR/USD pair, a softer position of the ECB is required than at the present, which looks questionable amid the recovery of the eurozone economy. Technically, the April minimum update will increase the risks of target implementation by 161.8% using the AB = CD pattern. It corresponds to a mark of 1.1. On the contrary, the return of euro quotes to the range of $ 1.12-1.15 with the subsequent assault on resistances at $1.127 and $1.132 will return the initiative to the bulls. EUR / USD daily chart |
| GBP / USD plan for the US session on May 3. Pound declines amid weak PMI for UK services Posted: 03 May 2019 05:38 AM PDT To open long positions on the GBP / USD pair, you need: Buyers missed another support level of 1.3018 after the release of a weak report on the PMI index for the services sector in the UK. At the moment, only the formation of a false breakdown in the minimum area of 1.2983 after the release of the report on the US labor market will be a signal to open long positions in GBP/USD pair with the main goal of returning and fixing above the resistance of 1.3018. Only after that can we expect the update of the morning resistance at 1.3060, where I recommend fixing the profit. In the case of a breakthrough of 1.2983, it is best to look at the pound's low of 1.2946. To open short positions on the GBP / USD pair, you need: Bears will count on an unsuccessful consolidation above the resistance of 1.3018, which will increase the pressure on the pound and lead to another wave of sales in the support area of 1.2983 and 1.2946, where I recommend taking profits. In case of an unsuccessful breakout of 1.2983 or growth above 1.3018 after the data on the US labor market, it is best to consider short positions for a rebound from the morning resistance level of 1.3060. Indicator signals: Moving averages Trading is below 30 and 50 moving averages, which indicates the bearish nature of the market. Bollinger bands In the case of a company in the second half of the day, the upper limit of the indicator in the area of 1.3050 will act as resistance. Description of indicators MA (moving average) 50 days - yellow MA (moving average) 30 days - green MACD: fast EMA 12, slow EMA 26, SMA 9 Bollinger Bands 20 The material has been provided by InstaForex Company - www.instaforex.com |
| The Australian dollar can surprise traders – experts Posted: 03 May 2019 04:49 AM PDT
According to the expert of the largest European company Tempus, whose forecasts are considered the most reliable, the Australian dollar may pleasantly surprise market participants. The expert believes the huge potential of the currency of the Green continent, as well as impressive opportunities for economic growth throughout the Pacific region. According to analysts, the Australian currency has an advantage against the backdrop of a protracted trade conflict between the United States and China. In the course of easing tensions between States and its termination, the Australian currency may give odds to other world currencies. According to a leading strategist from Tempus, the currency of the Green continent is oversold and will increase by 5% to 0.7400 against the US dollar by the end of this year. Last month, experts from Bank of America also recommended buying Australian currency. According to financial institution strategists, by the end of 2019, the AUD/USD rate will rise to 0.7800. However, some analysts have a different opinion. Shane Oliver, head of the investment strategy at AMP Capital, believes that the national currency of Australia will fall in price to 0.6000 by the end of this year. "Bears" on the Australian dollar expect a potential reduction in interest rates of the Reserve Bank of Australia. Recall that last week was not too successful for the currency of the Green Continent. The AUD/USD rate fell to its lowest level since the beginning of 2016, reaching 0.6988. However, analysts do not lose hope, predicting the rise of the Australian dollar by the end of this year. |
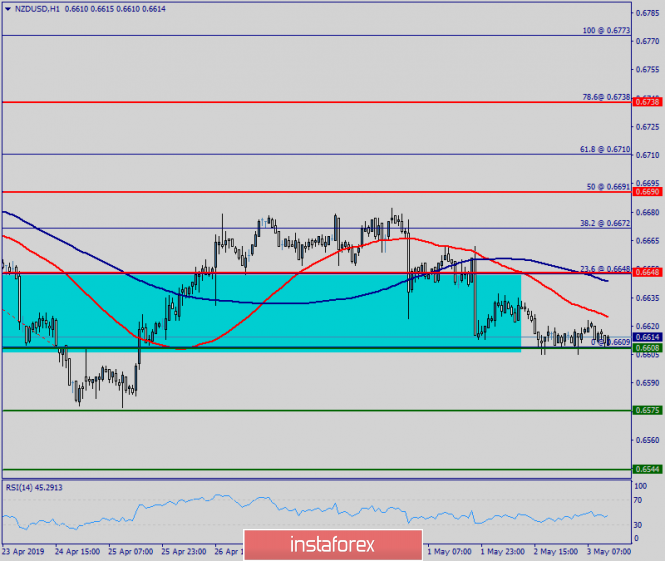
| Technical analysis of NZD/USD for May 03, 2019 Posted: 03 May 2019 03:48 AM PDT Overview: The NZD/USD pair is showing signs of weakness following a breakout of the lowest level of 0.6648. On the H1 chart, the level of 0.6648 coincides with 23.6% of Fibonacci, which is expected to act as minor support today. Since the trend is below the 23.6% Fibonacci level, the market is still in a downtrend. However, the major resistance is seen at the level of 0.6690. Furthermore, the trend is still showing strength above the moving average (100). Thus, the market is indicating a bearish opportunity below the above-mentioned support levels, for that the bearish outlook remains the same as long as the 100 EMA is headed to the downside. Therefore, strong resistance will be found at the level of 0.6690 providing a clear signal to buy with a target seen at 0.6575. If the trend breaks the minor resistance at 0.6575, the pair is likely to move downwards continuing the bearish trend development to the level 0.6544. The material has been provided by InstaForex Company - www.instaforex.com |
| Posted: 03 May 2019 03:34 AM PDT Minor (Daily) Euro vs Japanese Yen Previous review from 04/26/2019 19:57 UTC + 3. ____________________ The development of movement of cross-tool EUR / JPY in May 2019 will be determined by the direction of the breakdown range: -> the level of resistance of 125.20 (initial line SSL Fork operational scale Minute); -> support level 124.75 (the upper limit of the channel 1/2 the Median Line forked operational scale Minor). ____________________ The outlook for the development of the downward movement (sell) The breakdown of the support level 124.75 -> the development of the cross-instrument will continue in channel 1/2 Median Line (124.75 <->123.45 <-> 122.50) of the forked operating scale Minor. Details look at the animated graphics . ____________________ Prospects for the development of the upward movement (buy) Breakdown of the resistance level 125.20 (starting line the SSL Minute) -> the option of continuing the development of the upward movement of EUR / JPY to the borders 1/2 channel Median Line ( 125.75 <-> 126.25 <-> 126.75 ) and an equilibrium zone (127.40 <-> 128.10 <-> 128.70) of the forked operating scale Minute. Details are shown in animated graphics . ____________________ The review was compiled without taking into account the news background, the opening of trading sessions in the main financial centers. This is not a guide to action (placing orders "sell" or "buy"). |
| Posted: 03 May 2019 03:34 AM PDT Minor (Daily) Great Britain Pound vs US Dollar Previous review from 04/26/2019 19:59 UTC + 3. ____________________ The development of the movement of Her Majesty 's currency in GBP / USD in May 2019 will be due to the testing and direction of the breakdown of the 1/2 Median Line channel borders (1.3000 <-> 1.3050 <-> 1.3100) of the forked operating scale Minute. The layout of the movement options inside the 1 / 2ML Minute channel is presented in an animated graphic. ____________________ buy) Break resistance level 1.3100 (upper border of channel 1/2 Median Line Minute) -> continued development of the upward movement of GBP / USD to the equilibrium zone (1.3250 <-> 1.3370 <-> 1.3450 ) of the forks of the Minute and 1/2 Median Line channel ( 1.3370 <-> 1.3640 <-> 1.3870 ) of the forked operating scale Minore. Details are shown in animated graphics . ____________________ Development Outlook for a Downward Movement (sell ) Breakdown of the support level of 1.3000 (the lower border of the channel member 1/2 the Median Line of the operational scale Minute) -> resumption of the downward movement of GBP / USD to the targets -> initial line SSL Minute ( 1.2900 ) <-> local minimum 1.2864 <-> initial line SSL (1.2840) for the operational line Minor scale <-> control line LTL Minor (1.2580). Details look at the animated graphics . ____________________ The review was compiled without taking into account the news background, the opening of trading sessions in the main financial centers. This is not a guide to action (placing orders "sell" or "buy"). |
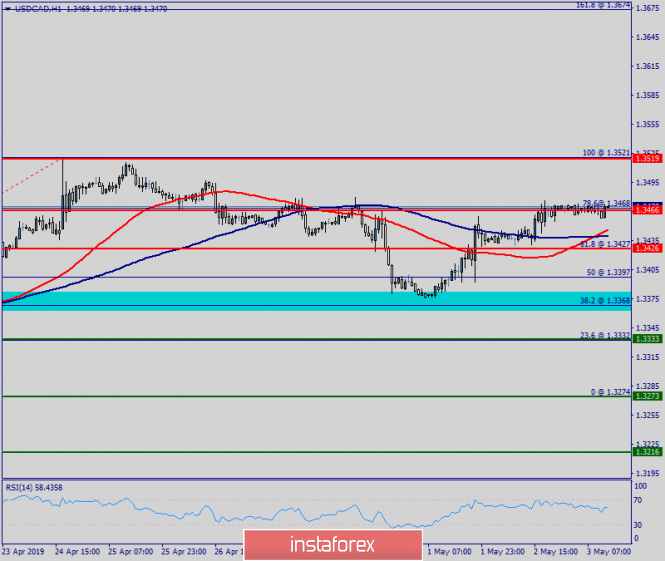
| Technical analysis of USD/CAD for May 03, 2019 Posted: 03 May 2019 03:12 AM PDT Overview: The USD/CAD pair continues to move upwards from the level of 1.3368. The pair rose from the level of 1.3368 (the level of 1.3228 coincides with a ratio of 38.2% Fibonacci retracement) to a top around 1.3519. But it rebounded from the top pf 1.3519 to 1.3370. Today, the first support level is seen at 1.3370 followed by 1.3332, while daily resistance 1 is seen at 1.3426. According to the previous events, the USD/CAD pair is still moving between the levels of 1.3370 and 1.3426; for that we expect a range of 56 pips (1.3426 - 1.3370). On the one-hour chart, immediate resistance is seen at 1.3370. Currently, the price is moving in a bullish channel. This is confirmed by the RSI indicator signaling that we are still in a bullish trending market. The price is still above the moving average (100), Therefore, if the trend is able to break out through the first resistance level of 1.3370, we should see the pair climbing towards the daily resistance at the levels of 1.3466 and 1.3519. It would also be wise to consider where to place stop loss; this should be set below the second support of 1.3332. The material has been provided by InstaForex Company - www.instaforex.com |
| Euro weakens amid rising dollar value Posted: 03 May 2019 03:09 AM PDT The continuing political uncertainty and the threat of an economic downturn in Europe led to a decline in the single European currency against the dollar. At the same time, even signs of a recovery in business activity in Europe did not help the euro to break out of the range of 1.11-1.10 dollars, in which it has been stuck since February. Surveys published by the industry showed a further decline in economic growth in April. In addition, the threat of higher rates for European cars in the United States and the upcoming European elections is also putting pressure on the currency. Against this background, the dollar looks attractive. The American continues to grow, aided by the economic data and the position of the Fed, voiced by Jerome Powell. The head of the regulator smoothed out fears caused by the recent slowdown in inflation. He said that he did not see any reason for lowering interest rates. The dollar will most likely continue to grow, especially if data on employment in the United States will be better than expected and the dollar is currently strong. Emerging markets are showing weak momentum, perhaps, you should think about selling. In general, it was a quiet week for major currencies. The volatility indicator was at multi-year lows and liquidity was limited to holiday weekends in Japan and China. The British pound added 1.3 percent in anticipation of a breakthrough in the Brexit negotiations. Australian and New Zealand dollars weakened on the news that next week regulators in both countries will lower interest rates. The Reserve Bank of Australia officials will meet on May 7 and the Reserve Bank of New Zealand the next day. Anyone can lower rates after reporting low inflation. Currently, markets are estimated by the likelihood that the Fed will cut rates this year at 49 percent, compared with more than 61 percent before Powell's speech. |
| Posted: 03 May 2019 02:15 AM PDT Minor (Daily) Euro vs US dollar Previous review from 04/26/2019 20:00 UTC + 3. ____________________ The European currency will be in the equilibrium zone (1.0930 <-> 1.1210 <-> 1.1490). direction of the range breakdown: -> resistance level 1.1310 (control line UTL forks for operating scale Minute); -> support level 1.1210 (Median Line Minor mid-line). The marking of movement options within the balance zone of a forked Minor is shown in the animated graphic. ____________________ The breakdown of the resistance level 1.1310 ( control line UTL of the operational scale fork of the Minute) -> development of the EUR / USD movement towards the targets -> upper limit of the ISL38.2 (1.1490) equilibrium zone of the fork of the operational scale of the Minor <-> finite Shiff Line Minor (1.1570) <-> local maximum 1.1815. The Details are Shown in animated graphics . ____________________ The breakdown of the support level of 1.1210 (Median Line Minor median line) -> the development of the movement of the single European currency will be directed to the targets -> 1/2 Median Line channel (1.1110 <-> 1.1050 <-> 1.0990) operational scale Minute <-> lower bound ISL61.8 (1.0930) equilibrium zone of the fork of the operational scale Minor <-> initial line SSL Minute (1.0890) <-> final Shiff Line Minute (1.0780). Details look at the animated graphics. ____________________ The review was compiled without taking into account the news background. The opening of trading sessions in the main financial centers and is not a guide to action (placing orders "sell" or "buy"). |
| BITCOIN Analysis for May 3, 2019 Posted: 03 May 2019 02:03 AM PDT Bitcoin is currently heading towards $6000 resistance area. It is expected to reach the price area in a short time by following the upward momentum in the process. Presently, prices are climbing up. So, analysts assume that BTC's next wave hits itsTechnically, candlestick arrangements are supportive but fundamental developments are crucial. The US Presidential election ma The dynamic levels including 20 EMA, Tenkan and Kijun line has been quite successful holding the price higher. Support and a strong momentum towards $6000 is more likely to occur. After reaching $6000 area, certain correction and volatility may be observed. However, without strong bearish counter it is quite rush to conclude that all the bullish gains above $5000. As the price remains above $5000 area with a daily close, further upward pressure is expected in the coming days. SUPPORT: 5000, 5250, 5500 RESISTANCE: 5850, 6000, 6500 BIAS: BULLISH MOMENTUM: NON-VOLATILE and IMPULSIVE
|
| Wave analysis of GBP / USD for May 3. Bank of England has not given the markets food for thought Posted: 03 May 2019 01:18 AM PDT Wave counting analysis: On May 2, the GBP / USD pair lost 20 basis points only. Thus, there are grounds for assuming the completion of the upward correctional wave. However, for the time being, the deviation of quotes from the reached maximums is too small for an unequivocal conclusion. Moreover, the current wave structure still suggests a decline in the pair and the construction of a downward wave. Today, the execution of this option can help the news background. But only if reports from America do not become a disappointment for the market. In general, the news background is not on the side of the pound sterling, and this is a good help for the further decline of the instrument. Purchase goals: 1.3118 - 61.8% Fibonacci 1.3168 - 50.0% Fibonacci Sales targets: 1.2954 - 100.0% Fibonacci 1.2838 - 127.2% Fibonacci General conclusions and trading recommendations: The wave pattern still involves the construction of a downward trend. Now, I recommend selling the pair with targets located near the estimated marks of 1.2839 and 1.2693, which corresponds to 127.2% and 161.8% Fibonacci. On the other hand, the signal from the MACD indicated that the pair is prepared to build a descending wave, but doubts still remain. Sales, therefore, recommend cautious. Today, news from America will help determine the market with a trading strategy. The material has been provided by InstaForex Company - www.instaforex.com |
| EURUSD movement will depend on data on the US labor market Posted: 03 May 2019 01:11 AM PDT The US dollar continued to strengthen on Thursday against risky assets and especially rose in pair with the European currency. Good data on labor productivity and production orders helped the US dollar to regain its position by the end of the week. According to the report by the US Department of Labor, due to the labor efficiency of American workers, non-agricultural labor productivity in the first quarter of this year increased by 3.6% compared with the previous quarter. Compared to the same period of the previous year, productivity increased by 2.4%. However, there are some minor problems regarding the growth of unit labor costs. The report indicates that in the 1st quarter, expenses decreased by 0.9% compared with the previous quarter. Compared with the same period of the previous year, unit costs increased by 0.1%. Orders for manufacturing goods in the US also rose in March and were much better than economists' forecasts. According to the US Department of Commerce, orders for manufactured goods rose by 1.9% to $508.19 billion. Economists had expected orders to grow in March by 1.5%. Excluding transportation, production orders rose by 0.8% and factory orders excluding defense increased from 1.7%. Weekly data on the labor market did not cause a special market reaction. According to a report by the US Department of Labor, the number of initial claims for unemployment benefits for the week from April 21 to April 27 was 230,000, while economists had expected the number of new claims to be 215,000. The data is similar to last week, indicating a stable state of the labor market. The average moving applications for four weeks rose to 212,500. The number of secondary applications for the week from April 14 to April 20 increased by 17,000 and amounted to 1,671,000. Today, all attention will be focused on the US Department of Labor report on the number of people employed in the non-agricultural sector, which could lead to a serious surge in volatility if the data seriously diverge from the expectations of economists. It is predicted that the number of people employed in April of this year will increase by 181,000 after rising by 196,000 in March. The overall unemployment rate should remain around 3.8%. As for the technical picture of the EURUSD pair, the downward potential will be limited by the support level of 1.1150, the breakthrough of which will return the trading instrument to the lows of April 25, which will completely eliminate the upward correction in risky assets and return to the market large buyers of the US dollar that can easily push the support of 1.1110. The material has been provided by InstaForex Company - www.instaforex.com |
| Wave analysis of EUR / USD for May 3. Euro is ready to decline, will the news prevent this scenario? Posted: 03 May 2019 01:01 AM PDT Wave counting analysis: On Thursday, May 2, the trading ended for the EUR / USD with another decline of 25 b.p. Thus, the conclusion suggests that the pair has moved to the construction of a downward wave 3, which is according to a signal from the MACD indicator. If this is true, then from the current position, the lowering of the instrument will continue with the targets located under the 11th figure. On the other hand, there will be news on unemployment, wages and jobs created outside the agricultural sectors in America today. Meanwhile, in the European Union - inflation. All these data can lead to an increase in the activity of the market and turnaround, since they will not necessarily be in favor of the US dollar. Accordingly, it is necessary to be prepared for an increase in the euro currency, although wave marking implies a further decline. However, the news background will be of overwhelming importance today. Sales targets: 1.1097 - 161.8% Fibonacci 1.1045 - 200.0% Fibonacci Purchase goals: 1.1324 - 0.0% Fibonacci General conclusions and trading recommendations: The pair continues to build the downward section of the trend. The correctional wave is presumably completed. The current wave counting implies a continuation of the decline of the pair with the closest targets 1.1097 and 1.1045, which equates to 161.8% and 200.0% Fibonacci. Meanwhile, MACD has turned down, and thus, I recommend selling a pair with defined goals. After lunch, I recommend using orders that limit potential losses, since sharp price reversals are possible. The material has been provided by InstaForex Company - www.instaforex.com |
| Fed showed teeth: selling EUR/USD and GBP/USD pairs Posted: 03 May 2019 12:53 AM PDT Although the final decision of the Fed to leave the key interest rate unchanged was expected, the resolution of the bank, as well as, the speech of the head, Jerome Powell, somewhat differed from the general views of market participants. We have previously indicated that investors were determined that the bank could lower interest rates in the second half of this year, after a sharp turnaround in the monetary policy of the American regulator at the beginning of this year, when the Fed and Jerome Powell signaled a pause in raising interest rates. At the March meeting, a statement by Mr. Governor and some Fed members sounded a note of such a probability. In any case, the market interpreted their words in this way, therefore, they expected more specifics from the May meeting. In our opinion, Powell clearly shed light on the likely actions of the Central Bank in this regard. And in his commentary, he not only made it clear that the rates could be lowered, but he noted with complete clarity and frankness that he was waiting for renewed growth of inflationary pressure, believing that a decrease in inflation in the first quarter was a temporary phenomenon. He also positively described the situation on the labor market, saying that he still remains strong and that he does not see his overheating. In general, he also spoke positively about the general economic situation in the country. His statement was a cold shower for those market players who have already felt that the Fed has surrendered and gone completely in the wake of not only the market but the start of a new quantitative easing program as President Donald Trump, who wants not only lower interest rates. In fact, we can say that the winter retreat of the regulator was a tactical maneuver and nothing more. It can even be assumed that the bank will probably continue the process of reducing its balance sheet but at the same time, liquidity in the banking system will be supported by repos. This topic is now under discussion, Powell said. Not only did the foreign exchange market, as well as the American stock market, fully respond to the somewhat unexpected statement of the head of the Federal Reserve by the growth of the dollar and the weakening of stock indices, but the market of the American state dollar also showed an increase in yield of treasuries. Assessing this state of affairs, we believe that if the data of the business activity index in the non-manufacturing sector of the United States published today and the data on employment in the States do not disappoint, this will support the dollar exchange rate in the foreign exchange markets. Forecast of the day: The EUR/USD pair is likely to continue to decline on strong economic statistics from the United States. We consider it possible to sell it after crossing the level of 1.1160 with a probable local target of 1.1100. The GBP/USD pair is turning down. We consider it possible to sell it after crossing the level of 1.3000 with a probable local target of 1.2925 against the background of positive American data. |
| GBP/USD: plan for the European session on May 3. The pound is ready to continue its decline Posted: 03 May 2019 12:50 AM PDT To open long positions on GBP/USD you need: Yesterday's statements by the Bank of England on a possible earlier increase in interest rates did not inspire buyers of the pound. In the first half of the day, the bulls are required to stay above the support level of 1.3018, and the formation of a false breakdown on this range will be the first signal to open long positions in order to update a high of 1.3060 and return to 1.3097, where I recommend to lock in the profit. In case the pound further decreases, you can buy GBP/USD at a rebound from the low of 1.2983. To open short positions on GBP/USD you need: As long as trading is below the 1.3060 range, the pressure on the pound will continue. The main task of bears in the first half of the day will be a breakthrough of the support level of 1.3018, which will increase the pressure on the pair and lead to a larger movement down to the area of a low of 1.2983, where I recommend taking profits. With the growth scenario above 1.3060, it is best to look closely at a rebound from the high of this week around 1.3097. An unsuccessful consolidation at 1.3060 will be another signal to sell the pound, which will make it possible to form the upper limit of the new downward channel. Indicator signals: Moving averages Trade is conducted in the region of 30 and 50 moving averages, which indicates market uncertainty with a bearish advantage. Bollinger bands Indicator volatility has decreased, which does not provide signals for entering the market. Description of indicators
|


| You are subscribed to email updates from Forex analysis review. To stop receiving these emails, you may unsubscribe now. | Email delivery powered by Google |
| Google, 1600 Amphitheatre Parkway, Mountain View, CA 94043, United States | |
No comments:
Post a Comment