
Forex analysis review |
- USD/CHF approaching support, potential big bounce!
- AUD/NZD approaching key resistance where we could see a reversal occur!
- USD/JPY reversed off key resistance, potential to drop!
- The euro may surprise investors
- It's time to buy the yen and euro
- The Fed is working to solve the problems of the world economy in conditions of low inflation
- Aussie messed up the policy
- Trump's warlike tweet: bluff or a real threat?
- EURUSD continues to trade within specific downward range
- Short-term technical analysis of Gold for May 6, 2019
- May 6, 2019 : GBP/USD Intraday technical analysis and trade recommendations.
- May 6, 2019 : EUR/USD Intraday technical analysis and trade recommendations.
- Bitcoin analysis for May 06, 2019
- EURUSD: Weak retail sales will affect the final eurozone GDP for the first quarter of 2019
- GBP/USD. May 6. Results of the day. The second referendum in the UK may become a reality
- EUR/USD. May 6. Results of the day. Traders ignore macroeconomic reports from the eurozone
- EUR./USD analysis for May 06, 2019
- Analysis of Gold for May 06, 2019
- Technical analysis of USD/CHF for May 06, 2019
- Technical analysis of EUR/USD for May 06, 2019
- GBP/USD: plan for the US session on May 6. The pound declines after Friday's speculative growth
- EUR/USD: plan for the US session on May 6. Eurozone retail sales remain unchanged
- GOLD Analysis for May 6, 2019
- Trump shook the global markets, resisted only the dollar
- Simplified wave analysis and forecast for EUR/USD, GBP/USD and USD/JPY on May 6
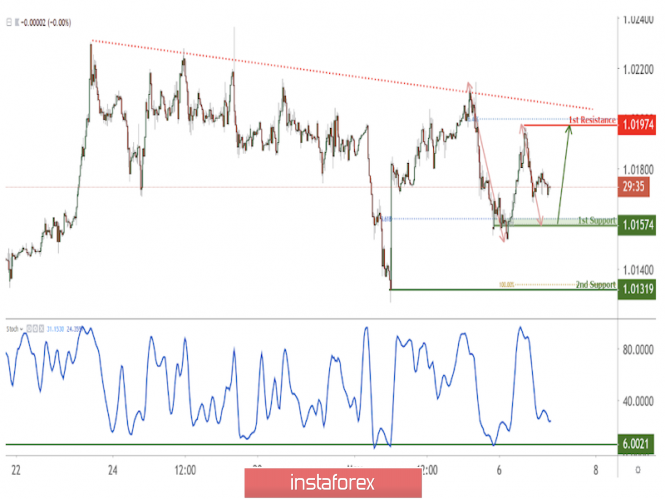
| USD/CHF approaching support, potential big bounce! Posted: 06 May 2019 07:01 PM PDT `
Price is approaching our first support where we might see a corresponding bounce in price. Entry : 1.0157 Why it's good : horizontal swing low support, 61.8% Fibonacci extension, 61.8% Fibonacci retracement Stop Loss : 1.0131 Why it's good : 100% Fibonacci extension, horizontal swing low support Take Profit : 1.0197 Why it's good : horizontal swing high resistance, 76.4% Fibonacci retracement, descending resistance line
|
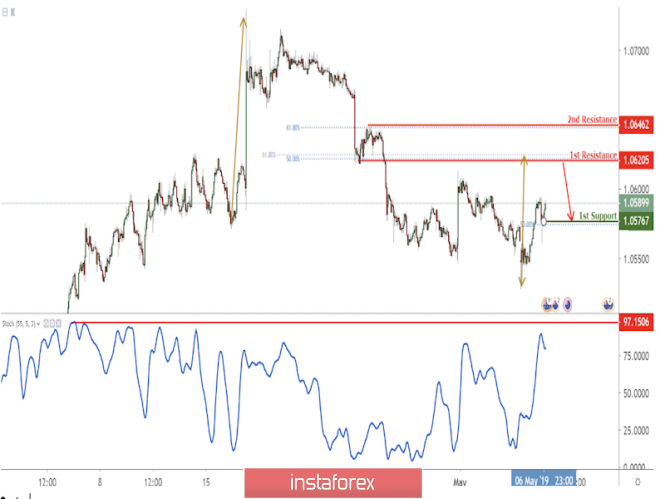
| AUD/NZD approaching key resistance where we could see a reversal occur! Posted: 06 May 2019 06:55 PM PDT
Price is approaching a key resistance at 1.0620 where it could potentially reverse to its support at 1.0576. Entry : 1.0620 Why it's good : horizontal pullback support, 61.8% fibonacci extension, 50% Fibonacci retracement Stop Loss : 1.0646 Why it's good : 61.8% fibonacci retracement, horizontal swing high resistance Take Profit : 1.0576 Why it's good : 50% Fibonacci retracement, horizontal swing low support
|
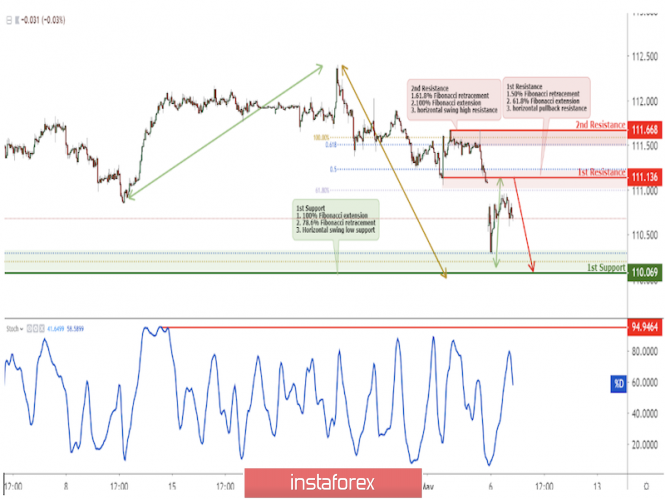
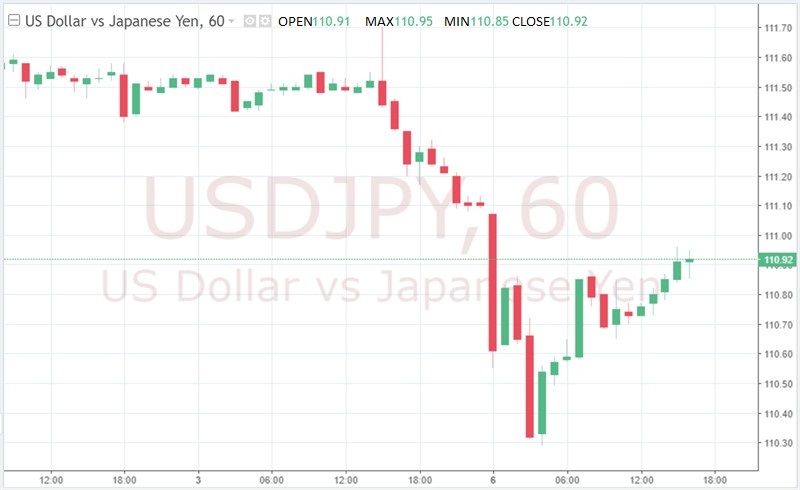
| USD/JPY reversed off key resistance, potential to drop! Posted: 06 May 2019 06:52 PM PDT
Price reversed off key resistance at 111.14 where it could potentially drop further. Entry : 111.14 Why it's good :50% Fibonacci retracement, 61.8% Fibonacci extension, horizontal pullback resistance Stop Loss : 111.63 Why it's good : horizontal swing high resistance,61.8% fibonacci retracement, 100% Fibonacci extension Take Profit : 110.07 Why it's good horizontal swing low support,78.6% fibonacci retracement.100% Fibonacci extension
|
| The euro may surprise investors Posted: 06 May 2019 04:53 PM PDT Last Friday, the USD index fell, ignoring a strong report on the labor market. This made investors think about whether the US currency hit local highs, followed by a weakening of the greenback and the strengthening of the euro, pound sterling and other currencies. From a fundamental point of view, the "greenback" retains its attractiveness, since the United States is ahead of the rest of the country in terms of economic growth, while the Fed has a more aggressive policy than other central banks. From a technical point of view, the euro and the Australian dollar plunged to multi-year lows, which means closing short positions in these currencies and their growth in the future. However, financial markets received an unexpected blow during the weekend. On the eve of the next round of US-Chinese trade, Donald Trump, the head of the White House, announced an increase in duties on goods from China this Friday, arguing that the negotiation process is progressing too slowly and Beijing is trying to revise the agreements already reached. The foreign exchange market reacted to this by lowering commodity currencies and strengthening the position of the yen, which is traditionally used as a "safe haven". At one point, the USD/JPY pair fell to 110.3. "Trump provoked a panic in the markets, threatening China with a new increase in duties. Of course, this factor has become the main engine of instinctive transfer of funds to the most reliable assets by traders," said analysts at Mizuho Bank. In the meantime, the EUR/USD pair has rather discreetly reacted to concerns about the escalation of trade tensions between the United States and China. On the one hand, the escalation of the trade conflict between Washington and Beijing may slow down the recovery of the Chinese and European economies and will also contribute to the continuation of the EUR/USD peak. On the other hand, this will remove, albeit temporarily, from the agenda the possibility of such an exacerbation of the US-EU line, since it is unlikely for the United States to risk putting pressure on all trading partners at once. According to experts, the oversold and overbought dollar also speaks in favor of the euro's stability. According to the Commodity Futures Trading Commission (CFTC), long positions on the greenback have reached highest values over the past few years. According to TD Securities, the dollar is now overvalued by about 3.5% against the currencies of other developed countries. Despite the obvious technical strength of the dollar, as well as the fundamental factors in favor of its growth, analysts advise caution to those investors who remain in the "shorts" for EUR/USD. An extreme overselling of the euro will be felt short-squeezed at the first significant positive news, which may be, in particular, the progress in the trade negotiations between Washington and Beijing. It is assumed that if, in the near future, the US administration, frightened by the correction of the S&P 500 index, starts to calm the markets, then the bulls on EUR/USD will be able to gain a foothold in the trading range of 1.12-1.15. |
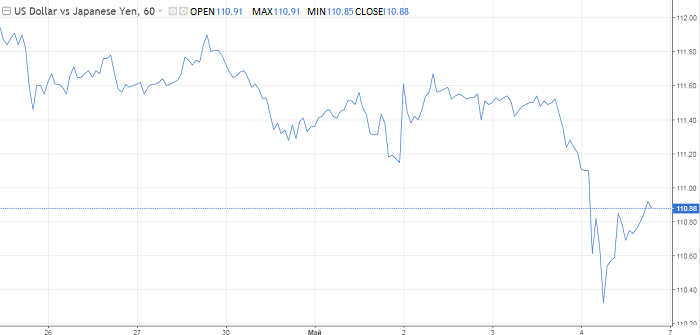
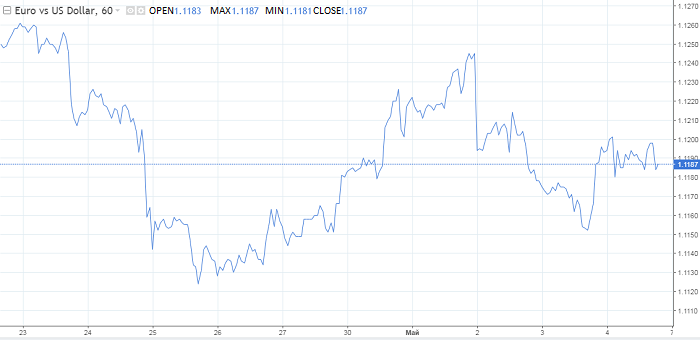
| It's time to buy the yen and euro Posted: 06 May 2019 04:49 PM PDT Donald Trump robbed the markets of hopes for a deal between the two of the world's largest economies - the United States and China. On Monday, trading began with a sharp demand for defensive assets, whereas earlier the markets laid the final signing of a trade deal this week in quotes. Preferences from what is happening has been received, including the Japanese yen. At the opening of the week, the USD/JPY pair lost more than 70 points. The lowest record in Asian trading amounted to 110.27. Friday's release on US wages data, which disappointed traders, added to the pair's negative. At the moment, the USD/JPY pair has enough fundamental grounds for a further decline to the support of 110. This mark may well become the first target before even more serious dollar losses. Two reasons to buy the euro The EUR/USD pair opened a new week with a gap down due to flight from risk. However, in the European session, the single currency was able to return to the level of $1.12. Note that in a broader perspective, trade conflicts and a slowdown in the global as well as the Chinese economy often form a downward trend in EUR/USD. As for the very near future, the euro at the start of the new week can demonstrate the growth of quotations primarily due to the acceleration of inflation in the region. The indicator reached 1.7%, which is the highest level in the last six months. This is great news for the euro, now the rumors on the topic of the new QE by the ECB will go to the background. The restraining factor for the strengthening of the euro since March 8 was precisely the talk about the need to buy back bonds. On that day, Mario Draghi announced plans for a new round of LTRO in the fall, and also announced the implementation of the QE program if necessary. Now inflation in Europe is growing, which means there is no urgent need for this program. The second reason is the publication of ambiguous data on labor in the United States, which made it clear that inflation in the country has not yet accelerated. The average earnings in the United States in April amounted to 3.2%, which is below market expectations. Thus, the dollar received a moderately negative signal. What's with the pound? There is a mixed background on the sterling. On Friday, it went sharply rose against the dollar than any other major currencies. Now the pound looks noticeably overbought. It should also be noted that in the evening hours of Friday, it came very close to the powerful weekly resistance zone. Therefore, from a technical point of view, it is now easier for it to move down than up. Moreover, the position of the Bank of England leaves no hope for tightening policies, not only in the coming months, but also in the long term. Naturally, it plays against the pound. On Tuesday, a new round of talks on Brexit will begin, which is bound to disturb the national currency of Great Britain, which is now falling in price. On Sunday, representatives of the opposition expressed doubts that they would be able to find a compromise with Teresa May. According to them, it is difficult and meaningless to negotiate with the prime minister, who can leave her post at any time, and her successor will break all agreements. The material has been provided by InstaForex Company - www.instaforex.com |
| The Fed is working to solve the problems of the world economy in conditions of low inflation Posted: 06 May 2019 04:33 PM PDT The Fed fears that it is poorly prepared to deal with the next recession as part of its current approach to targeting inflation. In addition, efforts are being made this year to test new interest rate management strategies around the world with low inflation and borrowing costs. But US central banks and monetary policy experts face a more difficult task: not only to create a solid foundation before the next recession, but also to convince the public that this actually works. When central banks around the world turned to unconventional instruments, such as bond purchases and forward management, to deal with the financial crisis of 2007–2009, they thought they were faced with unique conditions. But a decade after the end of the Great Recession, it is clear that the Fed is dealing with a new economic norm. It is expected that neither inflation nor interest rates will rise significantly, even if unemployment in the United States reaches an almost 50-year low. This leaves the US central bank with much less opportunity to lower interest rates in order to stimulate the economy. Thus, this year, when the US economy is stable, interest rate policies are paused, the Fed believes they have a breather to figure out how to make policies more effective when the next recession occurs. Among the ideas: to commit to compensating for periods of low inflation with periods of inflation above the target; look at the final economic result, rather than inflation; use negative interest rates to force enterprises to invest and banks to lend during a recession. All of these measures will act as shock absorbers to alleviate economic weakness and reduce recession. Weighted average inflation targeting is the base case, which still receives the most support. The idea, as explained by the President of the Federal Reserve Bank of New York John Williams, is to focus on the average inflation for a certain period, for example, for a year and a half. The material has been provided by InstaForex Company - www.instaforex.com |
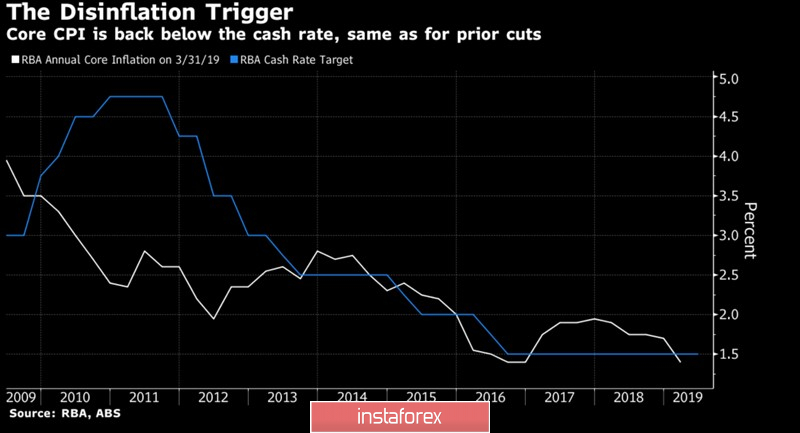
| Posted: 06 May 2019 04:00 PM PDT Following Donald Trump, other representatives of the US administration called on the Fed to lower the Federal funds rate. Vice President Michael Pence and chief economic adviser to the head of state Larry Kudlow believe that the economy works very well and the time has come to further disperse it by easing monetary policy. However, the US central bank has not yet followed the White House. Moreover, his colleagues from Australia have the best chance of monetary expansion. According to estimates of the derivatives market, the likelihood that the RBA will reduce the cash rate to a record low of 1.25% at the May meeting, is at 50: 50. It is interesting that even here it can not do without pressure from politicians. Australia will have Parliamentary elections on May 18, and regardless of who comes to power (for now, according to opinion polls, Labor is in the lead), the new government will focus on stimulating monetary and fiscal policies. A significant slowdown in GDP growth in the second half of 2018, cooling of retail sales and a fall in real estate prices require increasing consumer activity. It is possible that the Reserve Bank will become a hostage of the current ruling party. 17 out of 42 experts polled by Reuters expect that at a meeting on May 7 it will reduce the cash rate by 25 bp. Most experts believe that by the end of the year the rate may fall to 1% against the background of a significant slowdown in inflation. Australian Inflation Dynamics and RBA Rates It should be noted that in recent months, the RBA's outlook has changed significantly. If in December Philip Lowe said that monetary policy could be tightened for the first time since 2010, in February he focused on keeping the rate at 1.5%, by April he began to hint at monetary expansion. If it does happen, the RBA will be the first central bank of a developed country to decide to reduce borrowing costs. According to AMP Capital, the beginning of the monetary easing cycle will lead to the peak of AUD/USD to 0.6. While the "bears" on the aussie rely on the weakness of the Australian economy, "bulls", on the contrary, adopt external factors. BofA Merrill Lynch sees the analyzed pair at 0.78 by the end of the year, Goldman Sachs recommends buying it as the Chinese economy recovers. Even the best forecaster of Bloomberg, during the end of the first quarter Tempus Inc expects the growth of AUD/USD to 0.74 by the end of 2019. Donald Trump, who announced an increase in tariffs for imports from China, could spoil the karma for aussie fans. The market was confident that Beijing and Washington were about to sign the deal, but such threats undermined this belief, contributing to the deterioration of the global risk appetite. Technically, the implementation of the "Expanding wedge" and AB=CD patterns reinforces the risks of continuing the Australian dollar's downward hike to the target by 161.8% according to the latest model. It corresponds to $0.687. The material has been provided by InstaForex Company - www.instaforex.com |
| Trump's warlike tweet: bluff or a real threat? Posted: 06 May 2019 03:42 PM PDT The euro-dollar pair is on the verge of falling into a tailspin to the support level of 1.1120, followed by a test of the 10th figure. But, despite the pressure of sellers, the pair remains at the borders of the 12th figure, demonstrating a certain resistance. The financial world is frozen in anticipation of the key event of this week – the next round of talks between Beijing and the United States. However, this meeting is under a big question: after Trump's announced intentions to increase duties this Friday, the entire negotiation process was under threat. Therefore, the main intrigue of the next few days is whether the Chinese will come to the United States or ignore the invitation of the American side. The latter option will indicate the breakdown of negotiations and the beginning of the next round of the trade war. The belligerent attitude of the White House has changed the fundamental picture of the foreign exchange market. The growth of anti-risk sentiment was reflected in almost all currency pairs - to some extent. However, traders are clearly not in a hurry to give in to panic. Even the commodity currencies that are most sensitive to the permanent aggravations of the US-China relations, have suspended their decline. The euro-dollar pair is also staying near the opening level, demonstrating a fairly calm (although descending) flat. This "stress resistance" of the market is due to several factors. Firstly, the market does not really trust Trump, who has already demonstrated "unusual" behavior on the eve of key/crucial trade negotiations. For example, in the process of discussing the new North American Free Trade Agreement (NAFTA, and after its "rebranding" - (USMCA), the US president changed the previously agreed terms several times and at the last moment refused to sign preliminary agreement documents, citing insufficient benefits. As a result, Canada was forced to make significant concessions (especially in the dairy industry), putting an end to the multi-month negotiating saga. Donald Trump is an accomplished businessman, and often uses the experience of entrepreneurship in political relations. In November 2018, just a week before the key talks with Beijing, Trump prudently "raised rates", threatening to introduce new duties on products worth 237 billion dollars – from 1 January. Thus, it expanded the range of the forthcoming negotiations, while the duties that were not yet imposed became an element of "bargaining" with XI Jinping. This tactic really worked: following the December talks, Washington did not introduce additional tariffs, thereby "allowing" the working group to continue negotiations. In my opinion, today Trump continues to raise rates, bargaining for more favorable terms of the future deal. It is significant that Beijing's calm reaction to this attack by the US President serves as an indirect confirmation of this assumption. According to the American press, China deliberately downplays the importance of Trump's voiced threats in order not to aggravate the situation in the markets. The Chinese did not "slam the door", canceling the planned visit. However, at the moment there is no reliable information about whether the next round of talks will take place on May 8. According to some sources, some representatives of the Chinese delegation, who were supposed to leave for Washington today, remained in Beijing - "until certain instructions". According to other information, Deputy Prime Minister Liu He still intends to visit the capital of the United States, but somewhat later, after the Chinese side clarified Trump's intentions through diplomatic channels. According to the American press, the US president announced a planned increase in duties after a report by US Trade Representative Robert Lighthizer, who, in particular, announced that the PRC refused to comply with some previous agreements. It should be recalled here that at the beginning of this year, a real backstage struggle unfolded in the presidential administration between Finance Minister Stephen Mnuchin and US Trade Representative Robert Lighthizer. The first takes a softer position regarding the resolution of the Chinese question, the second is a typical "hawk". So, according to Mnuchin, the abolition of duties (partial or full) will push Beijing to more serious concessions in the context of a future trade agreement. However, Lighthizer thinks otherwise - in his opinion, the Chinese will regard this step as a manifestation of weakness and indecision. Apparently, today, Trump took the side of Lighthizer, tightening his rhetoric. Given the background of the US-China talks, it cannot be excluded that Trump will soon replace the "wrath for mercy" again, giving the green light to further negotiations. In this case, the risk appetite in the market will increase significantly, putting pressure on the dollar. Otherwise, the likelihood of a resumption of trade war will increase again, with all the ensuing consequences. Tomorrow it will become clear in what direction will further events develop: whether the Chinese will back down or decide to continue the trade war. The material has been provided by InstaForex Company - www.instaforex.com |
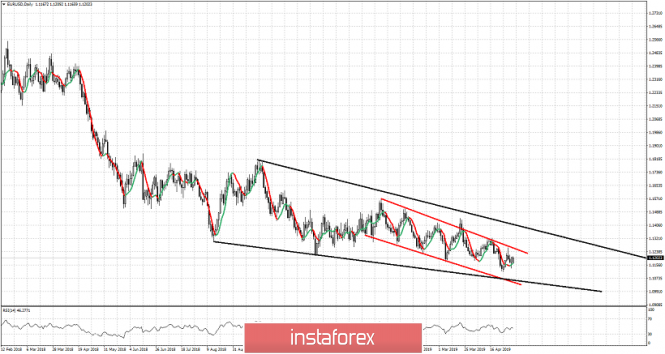
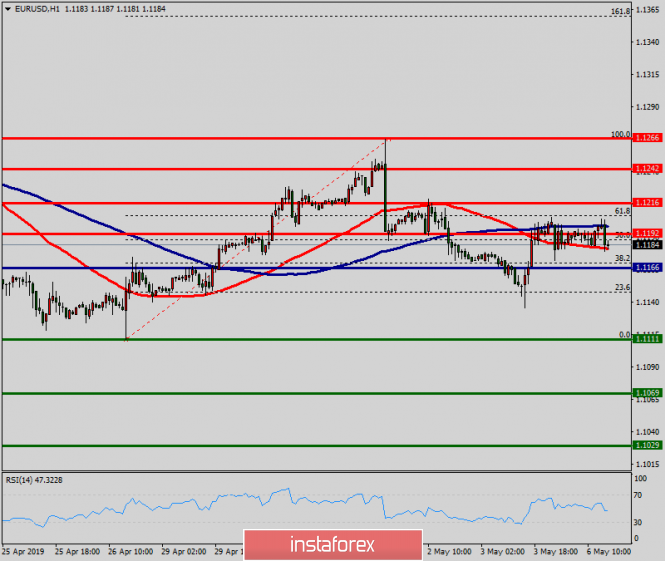
| EURUSD continues to trade within specific downward range Posted: 06 May 2019 12:49 PM PDT EURUSD bounced of the 1.1150 support towards 1.12 but a zoomed out view of the Daily chart shows that the trend remains bearish as price continues to make lower lows and lower highs inside a downward sloping channel and inside a downward sloping wedge pattern.
Black lines - downward sloping wedge pattern EURUSD has Daily resistance at 1.1260 and as long as price is below that level I expect another run lower towards 1.11 or 1.1070. Medium-term trend remains bearish as long as price is below 1.1350-1.1390 area. The RSI continues to diverge but this is only a warning and not a reversal signal. Short-term resistance at 1.1260 if broken will push price towards next resistance at 1.13-1.1350. The material has been provided by InstaForex Company - www.instaforex.com |
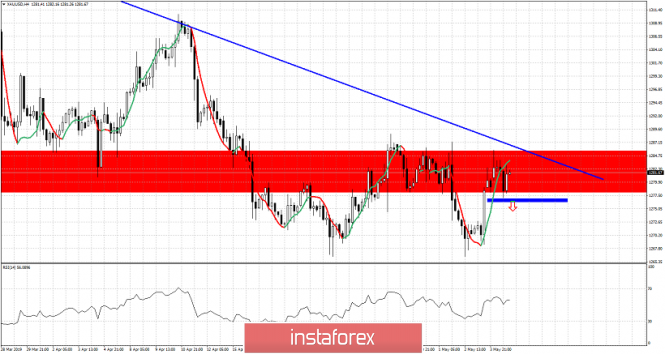
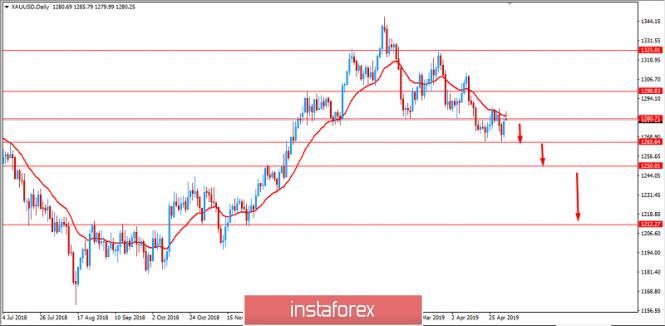
| Short-term technical analysis of Gold for May 6, 2019 Posted: 06 May 2019 12:43 PM PDT Gold price bounced towards short-term resistance at $1,290 but still did not manage to break above it. Price remains below important resistance trend line and a break below $1,276 short-term support is very possible over the coming hours.
Blue line -major resistance Blue rectangle - short-term support Gold's inability to break above the blue downward sloping trend line is a bearish sign. There are high chances of breaking below the blue short-term support and starting a new sell off that will eventually bring price towards $1,250-60 at least. Gold price is back testing the broken support zone and so far it remains below important short-term ($1,288) and medium-term ($1,300) resistance. Failure to hold above $1,276 will open the way for a test of the double bottom at $1,266. The material has been provided by InstaForex Company - www.instaforex.com |
| May 6, 2019 : GBP/USD Intraday technical analysis and trade recommendations. Posted: 06 May 2019 09:22 AM PDT
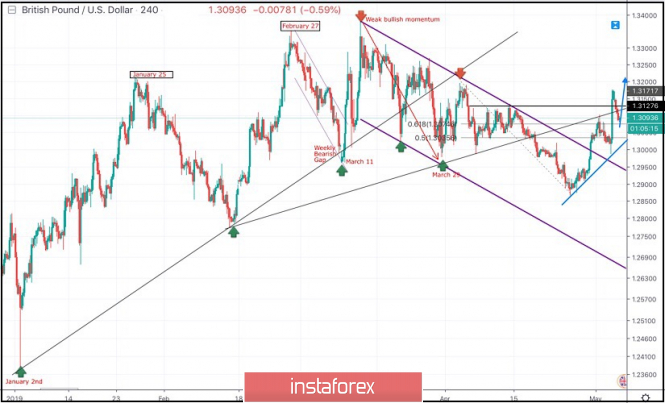
On March 29, the price levels of 1.2980 (the lower limit of the newly-established bearish movement channel) demonstrated significant bullish rejection. This brought the GBPUSD pair again towards the price zone of (1.3160-1.3180) where the upper limit of the depicted bearish channel as well as the backside of the depicted broken uptrend line demonstrated significant bearish rejection. Since then, Short-term outlook has turned into bearish with intermediate-term bearish targets projected towards 1.2900 and 1.2850. Last week, a bullish pullback was executed towards the price levels around 1.3035 (50% Fibonacci) where temporary bearish rejection was demonstrated. However, by the end of Friday's consolidations, significant bullish momentum was initiated around 1.3000 failing to maintain bearish persistence below 1.3030-1.3000. Short-term outlook turns to become bullish provided that the price levels around 1.3075 remains defended by the bulls. Currently, The price zone of 1.3030-1.3075 constitutes a prominent demand-zone to be watched for bullish entries. Trade Recommendations: Conservative traders should be waiting for bearish retracement towards the mentioned demand-zone. T/p levels to be located around 1.3170 and 1.3250. Any bearish breakdown below 1.3030 invalidates this bullish scenario. The material has been provided by InstaForex Company - www.instaforex.com |
| May 6, 2019 : EUR/USD Intraday technical analysis and trade recommendations. Posted: 06 May 2019 09:10 AM PDT
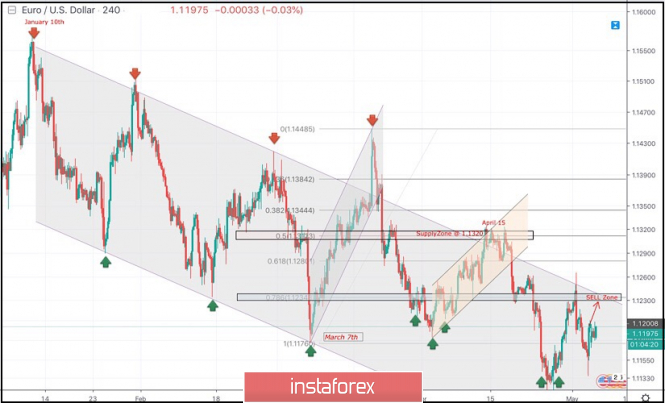
Few weeks ago, a bullish Head and Shoulders reversal pattern was demonstrated around 1.1200. This enhanced further bullish advancement towards 1.1300-1.1315 (supply zone) where significant bearish rejection was demonstrated on April 15. Short-term outlook turned to become bearish towards 1.1280 (61.8% Fibonacci) then 1.1235 (78.6% Fibonacci). For Intraday traders, the price zone around 1.1235 (78.6% Fibonacci) stood as a temporary demand area which paused the ongoing bearish momentum for a while before bearish breakdown could be executed on April 23. Currently, the price zone around 1.1235-1.1250 has turned into supply-zone to be watched for bearish rejection. Few days ago, another recent bullish head and shoulders pattern was being demonstrated around 1.1140 on the H4 chart. That's why, conservative traders were suggested to wait for another bullish pullback towards 1.1230-1.1250 for a valid SELL entry. On Friday, bearish persistence below 1.1175 was needed to ensure further bearish decline. However, the market has failed to sustain bearish pressure below 1.1175. Hence, Further bullish advancement is expected to occur towards the depicted SELL zone around 1.1235. Trade recommendations : Conservative traders should wait for another bullish pullback towards 1.1235 for a valid SELL entry. S/L should be placed around 1.1275 to narrow the risk while Target levels should be located around 1.1170 and 1.1130. The material has been provided by InstaForex Company - www.instaforex.com |
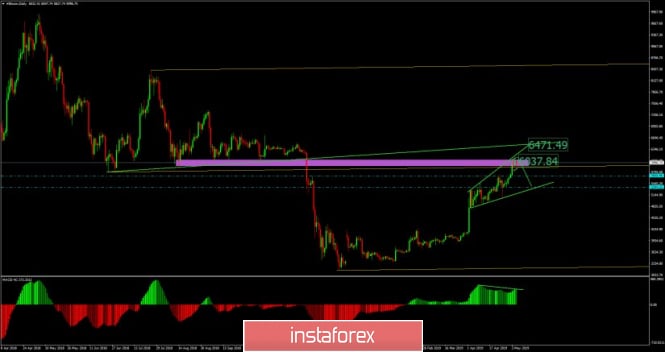
| Bitcoin analysis for May 06, 2019 Posted: 06 May 2019 07:35 AM PDT BTC lost the upside momentum from last week and it started to form balance area, which is sign for the potential downward correction. Technical picture:
Purple horizontal rectangle – resistance cluster Orange median line – Pitchfork median line (mean)/resistance Upper rising green line – Diagonal resistance The market started to balance at level of $6.100 and on the critical resistance, which may be indication of the potential downward correction in the next period. Support levels are seen at the price of $5.645 and $5.344. Strong median Pitchfork line is acting like resistance plus we got strong resistance cluster from the previous price action in the background. The MACD oscillator is suggesting the bearish divergence, which is another sign of the potential weakness on BTC. Watch for selling opportunities with the target at $5.645. The material has been provided by InstaForex Company - www.instaforex.com |
| EURUSD: Weak retail sales will affect the final eurozone GDP for the first quarter of 2019 Posted: 06 May 2019 07:24 AM PDT The European currency continued to trade in the side channel in pair with the US dollar, completely ignoring the weak data that came out today in the eurozone. The report on retail sales also disappointed investors. According to Markit, the Purchasing Managers Index (PMI) for Italy in April of this year dropped immediately to 50.4 points, close to the mark of 50 points, below which activity will decline sharply. Back in March, the index was 53.1 points. Economists had forecast it at the level of 51.9 points. In France, the same PMI index for the service sector in April returned to the level of 50 points and amounted to 50.5 points against 49.1 points in March. The data completely coincided with the forecasts of economists. Germany continues to hold the overall index of the eurozone and maintains growth in the service sector. According to Markit, the Purchasing Managers Index (PMI) in Germany rose to 55.7 points in April against 55.4 points in March. The data almost coincided with the forecasts of economists, who expected the index at the level of 55.6 points. As for the general index for the eurozone, there is a reason for concern. The Purchasing Managers Index (PMI) for the eurozone services sector fell to 52.8 points in April, while in March it was 53.3 points. The index was forecasted at the level of 52.5 points. The eurozone composite PMI fell to 51.5 points in April against 51.6 in March and the forecast of 51.3 points. Despite a wide range of indices, all the attention of traders was still focused on the report on retail sales in the eurozone. Sales were forecasted to fall by 0.1%, and if the March figure was worse than expected, the pressure on the euro would have increased. However, the report indicated that retail sales in March of this year remained unchanged compared with February and increased by 1.9% compared with March 2018. Weak retail sales will certainly contribute to the final estimate of eurozone GDP for the first quarter of this year, which will hit the euro in the future. Given that no important fundamental statistics are planned for the afternoon, much will depend on the further development of the trade conflict between the US and China. Let me remind you that quite recently, the President of the United States, Donald Trump, once again threatened to raise duties on Chinese goods. If trade negotiations suddenly break down for any reason, this is unlikely to have a positive effect on the US economy, which will force the Fed to resort to lowering interest rates, which have recently been spoken by quite a lot of committee representatives. As for the technical picture of the EURUSD pair, further prospects for the movement of the trading instrument seem vague. Bears can prove themselves after returning and updating the resistance level of 1.1220, while the bulls will be clearly set to hold large support of 1.1160, from which an attempt will be made to build the lower limit of the new upward channel. The goal will be to update last week's highs in the area of 1.1290. The material has been provided by InstaForex Company - www.instaforex.com |
| GBP/USD. May 6. Results of the day. The second referendum in the UK may become a reality Posted: 06 May 2019 07:24 AM PDT 4-hour timeframe The amplitude of the last 5 days (high-low): 125p - 123p - 73p - 64p - 188p. Average amplitude over the last 5 days: 115p (85p). In the morning, we wrote that Friday's growth of the pair is very difficult to call logical, given the nature of macroeconomic reports from America. Later, it was reported that the political crisis in Britain was gaining momentum, Laborites accused Theresa May of disclosing confidential information about the negotiations on the "deal", and the Conservative Party was defeated in the local elections in Great Britain. As you can see, there is no reason to buy the British pound. Nevertheless, on Friday, and last week as a whole, the pair has seriously strengthened, but this growth looks like an accident - either a technical correction or the results of the actions of major players who entered the market, not for the purpose of making a profit on the exchange rate difference. Thus, we expect the resumption of the downward trend. From a purely technical point of view, in the next few hours, the pair will seek to overcome the Kijun-Sen line, and if it succeeds, the probability of further downward movement will increase many times. In the meantime, there was a piece of new information that Theresa May had held a secret meeting regarding the possible holding of a second referendum. It is noted that a repeated referendum will be possible if required by the House of Commons. The House of Commons can demand it if the Conservative Party and the Labor Party failed to agree to support Theresa May's agreement on the fourth ballot in Parliament. Thus, the people of Great Britain can be offered to once again decide the fate of the country. It is also reported that there will be three voting options in the ballots: Brexit under the terms of Theresa May, "hard" Brexit and refusal to leave the EU. Trading recommendations: The GBP/USD currency pair is correcting against the upward trend. Formally, buy orders with a target at 1.3202 remain relevant if the pair bounces off the Kijun-Sen line. Short positions can be considered in small lots only after the price is fixed below the Kijun-Sen line with the first target at 1.2991. In addition to the technical picture should also take into account the fundamental data and the time of their release. Explanation of the illustration: Ichimoku indicator: Tenkan-Sen – the red line. Kijun-Sen – the blue line. Senkou Span A – light brown dotted line. Senkou Span B – light purple dotted line. Chinkou Span – green line. Bollinger Bands indicator: 3 yellow lines. MACD Indicator: A red line and a histogram with white bars in the indicator window. The material has been provided by InstaForex Company - www.instaforex.com |
| EUR/USD. May 6. Results of the day. Traders ignore macroeconomic reports from the eurozone Posted: 06 May 2019 07:24 AM PDT 4-hour timeframe The amplitude of the last 5 days (high-low): 42p - 53p - 78p - 48p - 70p. Average amplitude over the last 5 days: 58p (57p). The first trading day of the week takes place in low-volatility trading with a small advantage of the US currency. At the same time, the EUR/USD currency pair is being traded inside the Ichimoku cloud, so there is no clear trend as such. As part of the upward movement on Friday, the pair also failed to overcome the critical line Kijun-Sen, so the resumption of the downward movement this week looks more preferable. Also, we draw the attention of traders that the fundamental events are now either ignored by market participants, or the reaction to them should not be entirely logical. This once again leads us to the assumption that macroeconomic data now do not have significant value for traders. For example, several macroeconomic reports were published in the eurozone today, not the most important ones, but the reaction to them was completely absent. The business activity, composite and services indices of the European Union exceeded their forecast values, as well as the retail sales index for March. However, again, there was no logical, but at least a slight strengthening of the euro. Just like on Friday, there was no strengthening of the US dollar on strong news from America. The MACD indicator may turn down in the coming hours, which will return the pair to a downward trend and signal the completion of the correction. On the 24-hour chart, the downward trend is even more clearly visible, a rebound from the critical line, which also increases the chances of resuming the downward movement. Trading recommendations: The EUR/USD pair has adjusted to the critical line and may now resume a downward movement. The immediate target for short positions is the support level of 1.1136. A downward turn of the MACD indicator will signal the completion of the correction. Long positions are recommended to be considered no earlier than fixing the pair above the Ichimoku cloud. In this case, the trend in the instrument will change to an upward one, but this is unlikely to happen today. In addition to the technical picture should also take into account the fundamental data and the time of their release. Explanation of the illustration: Ichimoku indicator: Tenkan-sen – red line. Kijun-sen – blue line. Senkou Span A – light brown dotted line. Senkou Span B – light purple dotted line. Chinkou Span – green line. Bollinger Bands indicator: 3 yellow lines. MACD Indicator: A red line and a histogram with white bars in the indicator window. The material has been provided by InstaForex Company - www.instaforex.com |
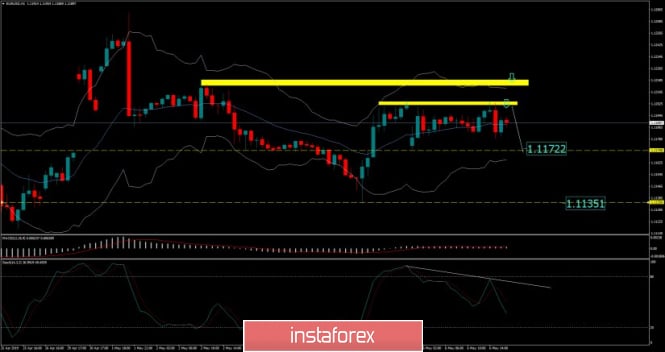
| EUR./USD analysis for May 06, 2019 Posted: 06 May 2019 07:19 AM PDT
EUR/USD has been trading sideways at the price of 1.1190. Price is trading inside of defined trading range. Our advice is to watch for potential down break. Yellow rectangle – Resistance 1 Yellow rectangle – Resistance 2 Yellow horizontal line – Support 1 Yellow horizontal line – Support 2 According to the H1 time-frame, we found that there is the bearish divergence on the Stochastic oscillator in the background, which is sign of the weak buyers. Also, the resistance at 1.1202 is being confirmed and we do expect further lower price on EUR. Support levels are seen at 1.1172 and 1.1135. For any buying, we would like to see the breakout of key resistance 1.1202 and 1.1218. Watch for selling opportuntiies. The material has been provided by InstaForex Company - www.instaforex.com |
| Analysis of Gold for May 06, 2019 Posted: 06 May 2019 06:58 AM PDT Gold has been trading downwards in past 15 hours, which is potential sign of the selling pressure. The 12h balance was broken on downside and the momentum is bearish. We are expecting downside.
Double white horizontal lines – broken trading range Blue line – Median Keltner line 20 EMA (current resistance) Yellow horizontal line – Support According to the M30 time-frame, we found that there is the bearish divergence on the Stochastic oscillator in the background, which is sign of the weak buyers. Also, there is the fake breakout of the Friday's high at $1.282.56, which is another sign for the potential downward movement. Intraday resistance is seen at the price of $1.280 (Median Keltner EMA and previous low) and at the price of $1.285.70. My advice is to watch for potential selling opportunities on the rallies. The downward objective is set at the price of $1.268.65. The material has been provided by InstaForex Company - www.instaforex.com |
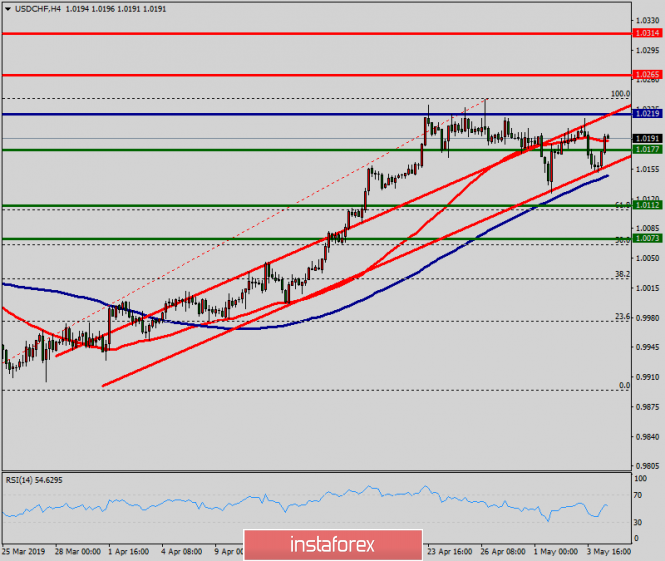
| Technical analysis of USD/CHF for May 06, 2019 Posted: 06 May 2019 06:38 AM PDT The USD/CHF pair continues moving in a bullish trend from the support levels of 1.0123 and 1.0177. Currently, the price is in an upward channel. This is confirmed by the RSI indicator signaling that the pair is still in a bullish trend. As the price is still above the moving average (100), immediate support is seen at 1.0177. Consequently, the first support is set at the level of 1.0177. So, the market is likely to show signs of a bullish trend around 1.0177. In other words, buy orders are recommended above the level of 1.0177 with the first target at the level of 1.0265. Furthermore, if the trend is able to breakout through the first resistance level of 1.0265, we should see the pair climbing towards the point of 1.0314. It would also be wise to consider where to place a stop loss; this should be set below the second support of 1.0123. The material has been provided by InstaForex Company - www.instaforex.com |
| Technical analysis of EUR/USD for May 06, 2019 Posted: 06 May 2019 06:27 AM PDT |
| GBP/USD: plan for the US session on May 6. The pound declines after Friday's speculative growth Posted: 06 May 2019 05:36 AM PDT To open long positions on GBP/USD, you need: The expected demand for the pound in the support area of 1.3098 is missing, so in the second half of the day, it is best to consider long positions after updating the minimum of 1.3078, provided that the volume rises at this level or after a test of larger support at 1.3039. Bulls also have a new task. By the end of the day, they need to return to the support level of 1.3130, which will keep the upward trend and lead to a maximum test of 1.3176, where I recommend fixing the profits. To open short positions on GBP/USD, you need: Bears will pull the pair down to the support level of 1.3078, and if buyers do not resist there, then it is best to open long positions on the rebound from the low of 1.3039. In the case of an upward correction in the second half of the day, it is best to return to short positions on a false breakdown from the level of 1.3130 or on a rebound from 1.3176. However, we should not forget that tomorrow, Teresa May can present her next plan for leaving the EU, which will provide substantial support to the pound in the event of its approval. Indicator signals: Moving Averages The downward correction in the pound led to the test of 30 and 50 moving averages, which can return new buyers to the market. Bollinger Bands In the case of a pound company in the second half of the day, the average border around 1.3130 and the upper border of the indicator around 1.3176 will act as resistance. Description of indicators
|
| EUR/USD: plan for the US session on May 6. Eurozone retail sales remain unchanged Posted: 06 May 2019 05:36 AM PDT To open long positions on EURUSD, you need: Data on retail sales, which were expected to form pressure on the euro, did not cause movement in the market, as the growth was zero. It is best to return to long positions in the second half of the day after the correction down to the support area of 1.1164, provided that there is a false breakdown, or a rebound from a larger area of 1.1138. The main task of buyers is to break and consolidate above the resistance of 1.1217, which will lead EUR/USD to the maximum area of last week to 1.1260, where I recommend fixing the profit. To open short positions on EURUSD, you need: Bears will manifest themselves only after an unsuccessful attempt to consolidate at the level of 1.1217, which will be a signal to open short positions in the euro in order to reduce and consolidate below the support level of 1.1164, the breakdown of which will push EUR/USD to the minimum area of 1.1138, where I recommend fixing the profits. With the growth of the euro above the resistance of 1.1217 in the second half of the day, which may occur after the statements of the representatives of the Fed, it is best to open short positions to rebound from a maximum of 1.1260. Indicator signals: Moving Averages Trading is conducted in the area of 30 and 50 moving averages, which continues to indicate the lateral nature of the market. Bollinger Bands The volatility of the indicator has decreased, which does not give signals on entering the market. Description of indicators
|
| Posted: 06 May 2019 05:21 AM PDT Gold was trading with a clear-cut bearish trend. Now it is consolidating in the area between $1,265 and the $1,280 support, from where it is expected to continue with the bearish momentum being subdued by the dynamic resistance level. Gold prices rose recently as investors were flocking to safe haven assets selling tumbling equities. The reason is that US President Donald Trump threatened to raise tariffs on Chinese imports this week as he is disappointed by too slow progress in the trade talks. On Friday, the US non-farm payrolls surpassed expectations. An unemployment rate seemingly edged down in April as labor force participation shrank. Besides, average hourly eanrings eased growth undershooting the consensus. However, Fed's Chair Jeromy Powell may confirm the central bank's dubious stance on easing which might be reinforced by the nearest CPI data though it is expected to be unchanged at 0.4%. As USD is gaining momentum, gold is losing ground in response. Worries about a downshift in the business cycle might revive risk aversion and USD will have relatively little to keep it from capitalizing on haven flows if the Fed is going to taper stimulus. Amid broad-based strength of USD, Gold is expected to extend weakness. From the technical viewpoint, a daily close below $1,280-$1,265 support area will indicate further downward pressure which may push the price towards $1,250 and later towards $1,225 support area in the coming days. SUPPORT: $1,250, $1,265, $1,280 RESISTANCE: $1,300, $1,325 BIAS: BEARISH MOMENTUM: VOLATILE
|
| Trump shook the global markets, resisted only the dollar Posted: 06 May 2019 03:27 AM PDT The Chinese yuan was marked by the largest fall in 10 months after US President Donald Trump threatened to raise tariffs on Chinese goods, while refuge currencies, such as the yen, are rising in price against the background of a widespread risky assets. Trump unexpectedly announced that this week, he will raise tariffs for Chinese goods by $ 200 billion and is ready to expand this list in the near future. This statement marked a major shift in the negotiation process. Considering that earlier, Trump positively assessed the progress in trade negotiations and highly appreciated his relations with Chinese President Xi Jinping. This statement took the markets by surprise. In a period of low market volatility for many assets and recent economic data indicating weak but steady growth in the global economy, this decision by the American president has shaken up the markets. This also began active sales of risky assets. Chinese currency fell by one percent, almost to its lowest level this year, about 6.80 yuan per dollar. The Mexican peso and Turkish lira lost more than a half percent. Currencies of countries that are closely related to the Chinese economy, such as the Australian and New Zealand dollars, were decreased by 0.3–0.5 percent. Rising tariffs bring bad news for risky assets. Trump has put at risk on the prospects for recovery in global growth. However, the dollar at the same time, feels more than confident and generally remained stable against a basket of major currencies. Investors weighed the prospect of a likely inflationary acceleration in the US economy, if Trump insists on raising tariffs on imported goods, which coincides with rising US interest rate expectations at the end of the year. The material has been provided by InstaForex Company - www.instaforex.com |
| Simplified wave analysis and forecast for EUR/USD, GBP/USD and USD/JPY on May 6 Posted: 06 May 2019 03:14 AM PDT EUR/USD In the dominant bearish wave on the euro chart from March 20, several wave zigzags of different scale are formed. In the main structure of April 12, the final part (C) develops, within the framework of which the correctional part (B) completed the formation last week. And already on the final part of the graph of May 1, the A-B sequence was formed. Forecast: The next sessions are expected to complete the upward rollback and the formation of a reversal. The upper limit of the preliminary target zone of the entire current bearish wave is the support zone. Recommendations: Short-term purchases can justify themselves only on the smallest TF. It is recommended to wait until the end of the upward pullback is completed and look for entry points to the pair's sales, while taking into account the small settlement potential of the entire decline. Resistance zones: - 1.1210 / 1.1240 Support zones: - 1.1090 / 1.1060 GBP/USD As part of the main downward wave of March 13, which sets the main vector of movement for the pound in recent months, the correction part (B) is nearing completion. Bullish wave has a complex structure of the wrong kind. The final section started on April 25. The price reached the lower limit of a wide potential reversal zone of a large scale. There are no signals of a change of course yet. Forecast: The current upward movement is expected to be completed in the next sessions. Short-term break of the upper limit of the resistance zone is not excluded. Recommendations: Buying a pair within the intraday is possible, but it is more reasonable to reduce the lot. At the first signs of a reversal, it is recommended to exit trading transactions and start tracking the instrument's sell signals. Resistance zones: - 1.3190 / 1.3220 Support zones: - 1.3060 / 1.3030 USD/JPY Since D1, ascending waves of different scale are formed on the yen charts from the beginning of the year. The last short-term wave counts down from March 25th. On April 12, within its framework, the correctional part (B) has been formed. By now, its structure looks complete and the calculated goal of the reduction has been achieved, but there are no signals of a change of course on the chart yet. Forecast: During the current day, the formation of an upward reversal structure is expected on the small yen charts, with the flat nature of price fluctuations. The beginning of price growth is likely at the end of the day or tomorrow. Recommendations: When trading a pair, you should take into account the small potential of sales. When the price reaches the support zone, it is recommended to start tracking the signals of a change of course, with the prospect of opening long positions. Resistance zones: - 111.40 / 111.70 Support zones: - 110.50 / 110.20 Explanations to the figures: Waves in the simplified wave analysis consist of 3 parts (A – B – C). The last unfinished wave is analyzed. Zones show areas with the highest probability of reversal. The arrows indicate the wave marking according to the method used by the author, the solid background is the formed structure, the dotted ones are the expected movements. Note: The wave algorithm does not take into account the duration of tool movements over time. The material has been provided by InstaForex Company - www.instaforex.com |


 E
E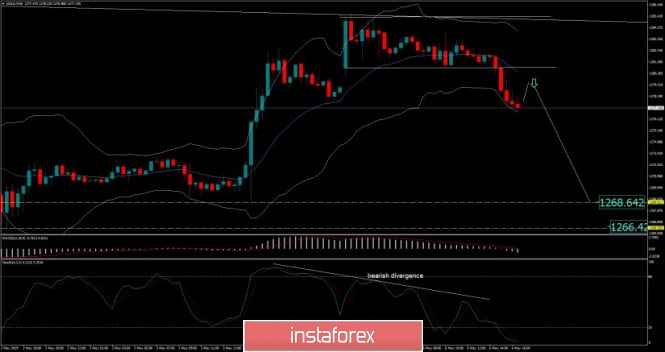


| You are subscribed to email updates from Forex analysis review. To stop receiving these emails, you may unsubscribe now. | Email delivery powered by Google |
| Google, 1600 Amphitheatre Parkway, Mountain View, CA 94043, United States | |
No comments:
Post a Comment