Forex analysis review |
- EUR/JPY reversed off key resistance, a drop is possible!
- Fractal analysis of major currency pairs for June 3
- Another failed attempt of the Dollar index capture the 98 price level.
- Weekly analysis on Gold
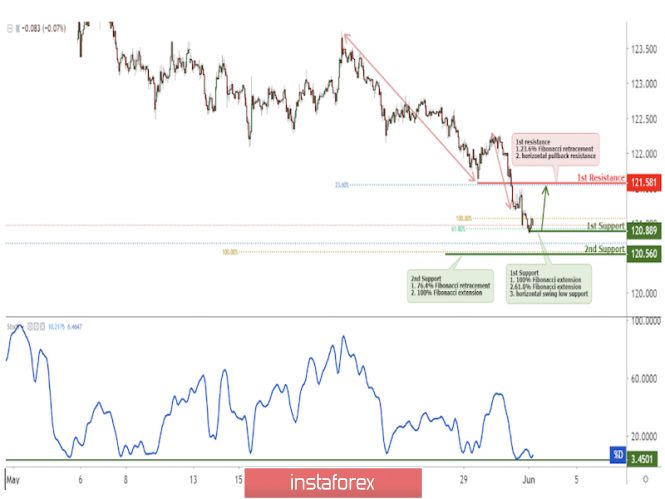
| EUR/JPY reversed off key resistance, a drop is possible! Posted: 02 Jun 2019 07:29 PM PDT
EURJPY reversed off key resistance, a drop to first support is possible Entry: 120.89 Why it's good : 61.8% Fibonacci extension, 61.8% Fibonacci retracement, horizontal swing low resistance Stop Loss : 120.56 Why it's good :100% Fibonacci extension,76.4% Fibonacci retracement Take Profit : 121.58 Why it's good: 23.6% Fibonacci retracement, horizontal pullback resistance
|
| Fractal analysis of major currency pairs for June 3 Posted: 02 Jun 2019 05:51 PM PDT Forecast for June 3: Analytical review of H1-scale currency pairs: For the euro / dollar pair, the key levels on the H1 scale are: 1.1227, 1.1218, 1.1194, 1.1181, 1.1157, 1.1146, 1.1129, 1.1115, 1.1099, 1.1080 and 1.1067. Here, the price has issued the potential for upward movement of May 30 in the correction zone of the downward structure. Short-term movement to the top is expected in the range of 1.1181 - 1.1194. The breakdown of the last value will begin the development of the upward trend. In this case, the potential target is 1.1227. Upon reaching this level, we expect a consolidation in the range of 1.1227 - 1.1218. Corrective downward movement is possible in the range of 1.1157 - 1.1146. The breakdown of the latter value will lead to in-depth correction. Here, the goal is 1.1129. The breakdown of which will continue the development of the main downward trend of May 27. In this case, the first target is the level of 1.1115. The breakdown of the level of 1.1115 will lead to a movement to the level - 1.1099, wherein near this level is a price consolidation. The breakdown of the level of 1.1099 will lead to the movement to the level of 1.1080. For the potential value for the bottom, we consider the level of 1.1067. After reaching which, we expect a consolidation in the range of 1.1080 - 1.1067. The main trend is the downward structure of May 27, the stage of deep correction. Trading recommendations: Buy 1.1181 Take profit: 1.1192 Buy 1.1196 Take profit: 1.1216 Sell: 1.1156 Take profit: 1.1147 Sell: 1.1144 Take profit: 1.1130 For the pound / dollar pair, the key levels on the H1 scale are: 1.2715, 1.2667, 1.2637, 1.2553, 1.2478 and 1.2428. Here, the price is still in the correction zone from the downward structure on May 21. Continuation of the movement to the bottom is expected after the breakdown of the level of 1.2553. In this case, the target is 1.2478. We consider the level of 1.2428 to be a potential value for the bottom. After reaching which, we expect consolidation in the range of 1.2478 - 1.2428, as well as a departure to a correction. Short-term upward trend is possible in the range of 1.2637 - 1.2667. The breakdown of the latter value will lead to a prolonged correction. Here, the goal is 1.2715. This level is a key support for the downward structure. Its price passage will have to form the initial conditions for the upward cycle. The main trend is the downward structure of May 21, the stage of correction. Trading recommendations: Buy: 1.2637 Take profit: 1.2666 Buy: 1.2668 Take profit: 1.2715 Sell: 1.2550 Take profit: 1.2480 Sell: 1.2476 Take profit: 1.2428 For the dollar / franc pair, the key levels on the H1 scale are: 1.0037, 1.0021, 1.0009, 0.9982, 0.9971 and 0.9949. Here, we are following the development of the downward structure of May 30. Short-term downward movement is expected in the range of 0.9982 - 0.9971. The breakdown of the last value will lead to the movement to the potential target - 0.9949. From this level, we expect a rollback to the top. Short-term upward movement is possible in the range of 1.0009 - 1.0021. The breakdown of the latter value will lead to a prolonged correction. Here, the goal is 1.0037. This level is a key support for the downward structure of May 30. The main trend is the downward cycle of May 30. Trading recommendations: Buy : 1.0010 Take profit: 1.0020 Buy : 1.0023 Take profit: 1.0036 Sell: 0.9982 Take profit: 0.9972 Sell: 0.9969 Take profit: 0.9950 For the dollar / yen pair, the key levels on the scale are : 109.00, 108.63, 108.43, 108.18, 107.76, 107.44 and 106.99. Here, the next targets for the downward movement is determined from the local structure on May 30th. Continuation of the movement to the bottom is expected after the breakdown of the level of 108.18. In this case, the goal is 107.76. Meanwhile, in the range of 107.76 - 107.44, there is a short-term downward movement, as well as consolidation. We consider the level of 106.99 as a potential value for the bottom. After reaching this level, we expect a rollback to the top. Short-term upward movement is possible in the range of 108.43 - 108.63. The breakdown of the latter value will lead to in-depth correction. Here, the goal is 109.00. This level is a key support for the downward cycle. The main trend: the local structure for the bottom of May 30. Trading recommendations: Buy: 108.43 Take profit: 108.63 Buy: 108.66 Take profit: 109.00 Sell: 108.15 Take profit: 107.76 Sell: 107.74 Take profit: 107.46 For the Canadian dollar / US dollar pair, the key levels on the H1 scale are: 1.3651, 1.3611, 1.3556, 1.3491, 1.3464 and 1.3428. Here, we continue to follow the development of the ascending structure of May 22. Short-term upward movement is expected in the range of 1.3534 - 1.3556. The breakdown of the last value should be accompanied by a pronounced upward movement. In this case, the target is 1.3611. For the potential value for the top, we consider the level of 1.3651. After reaching which, we expect a departure to the correction. Short-term downward movement is possible in the range of 1.3491 - 1.3464. The breakdown of the latter value will lead to a prolonged correction. Here, the target is 1.3428. This level is a key support for the top. The main trend is the upward cycle of May 22. Trading recommendations: Buy: 1.3534 Take profit: 1.3555 Buy : 1.3558 Take profit: 1.3610 Sell: 1.3490 Take profit: 1.3466 Sell: 1.3462 Take profit: 1.3433
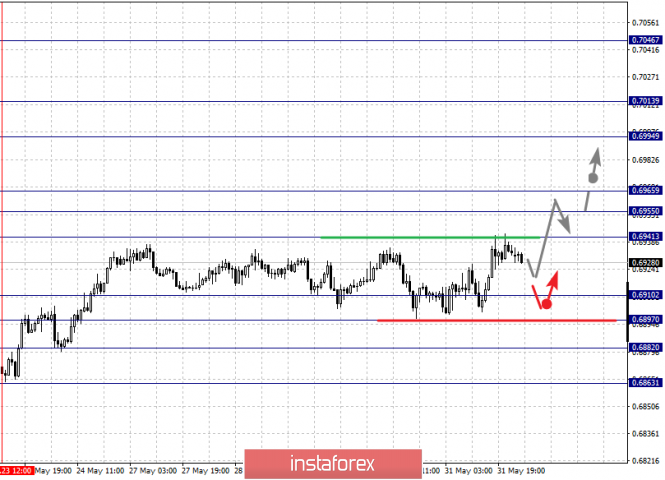
For the Australian dollar / US dollar pair, the key levels on the H1 scale are : 0.7013, 0.6994, 0.6965, 0.6955, 0.6941, 0.6910, 0.6897, 0.6882 and 0.6863. Here, we are following the ascending structure of May 23. Continuation of the movement to the top is expected after the breakdown of the level of 0.6941. Here, the first goal is 0.6955, wherein near this level is a price consolidation. The price passage of the noise range of 0.6955 - 0.6965 should be accompanied by a pronounced upward movement. In this case, the target is 0.6994. For the potential value for the top, we consider the level of 0.7013. After reaching which, we expect a rollback to the bottom. Short-term downward movement is possible in the range of 0.6910 - 0.6897. The breakdown of the latter value will lead to a prolonged movement. Here, the target is 0.6882. This level is a key support for the upward structure. The main trend is the formation of initial conditions for the top of May 23 Trading recommendations: Buy: 0.6941 Take profit: 0.6955 Buy: 0.6967 Take profit: 0.6992 Sell : 0.6910 Take profit : 0.6898 Sell: 0.6895 Take profit: 0.6884 For the euro / yen pair, the key levels on the H1 scale are: 121.76, 121.54, 121.20, 120.78, 120.56 and 119.98. Here, we are following the development of the mid-term downward structure of May 21. Short-term downward movement is expected in the range of 120.78 - 120.56. The breakdown of the last value should be accompanied by a pronounced downward movement to the potential target - 119.98. Upon reaching this level, we expect a rollback to the top. The breakdown of 121.20 will lead to the development of a corrective upward movement. In this case, the target is 121.54. Meanwhile, the noise range of 121.54 - 121.76 is expected to form the top of the initial conditions for the ascending cycle. The main trend is a mid-term downward structure of May 21. Trading recommendations: Buy: 121.20 Take profit: 121.50 Buy: 121.50 Take profit: 121.74 Sell: 120.78 Take profit: 120.60 Sell: 120.50 Take profit: 120.00
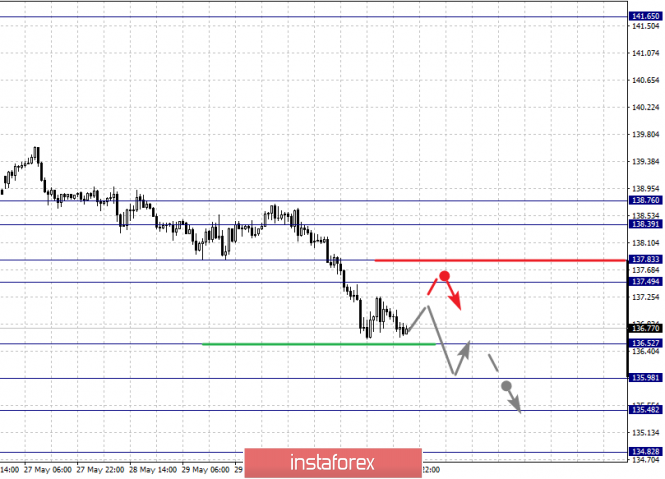
For the pound / yen pair, the key levels on the H1 scale are : 138.39, 137.83, 137.49, 136.52, 135.98, 135.48 and 134.82. Here, we continue the development of the downward trend of May 21, after the breakdown of the level of 136.52. In this case, the target is 135.98. The breakdown of which, in turn, will allow us to expect a movement to the level of 135.48, wherein consolidation is near this value, and hence, the probability of a reversal in correction. For the potential value for the bottom, we consider the level of 134.82. Short-term upward movement is expected in the range of 137.49 - 137.83. The breakdown of the last value will lead to a prolonged correction. Here, the target is 138.39 while the noise range is 138.39 - 138.76. The main trend is a local downward structure of May 21. Trading recommendations: Buy: 136.50 Take profit: 136.00 Buy: 135.94 Take profit: 135.50 Sell: 137.46 Take profit: 136.90 Sell: 135.44 Take profit: 134.84 The material has been provided by InstaForex Company - www.instaforex.com |
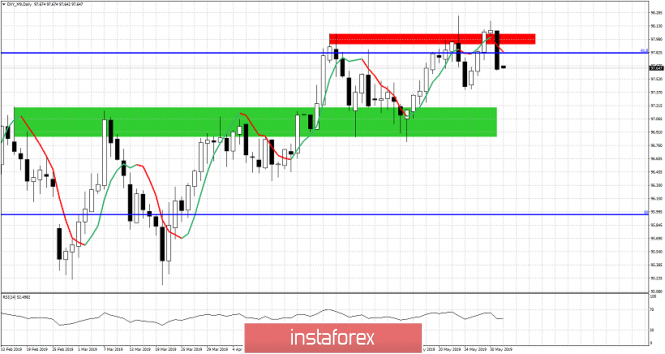
| Another failed attempt of the Dollar index capture the 98 price level. Posted: 02 Jun 2019 03:35 PM PDT The Dollar index ended last week on a mixed to bearish note as price recaptured the critical resistance at the 98 price level only to lose it with a big decline on the last trading day of the week.
Red rectangle - major resistance Green rectangle - major support The Dollar index made new highs on May 23rd but price reversed and did not close above 98. On May 29th and 30th we saw new higher highs but on a closing basis above the major resistance area depicted with a red rectangle. However on the last trading day we saw another reversal. The inability to break above 98 and stay above it, is a worrying sign for bulls. However as long as price is trading above the green rectangle, bulls remain in control of the trend. The many failed attempts point to a bigger reversal in trend, taking into consideration how much time has the index around 98 which is the 61.8% Fibonacci retracement of the entire decline from 103.75 to 88. The material has been provided by InstaForex Company - www.instaforex.com |
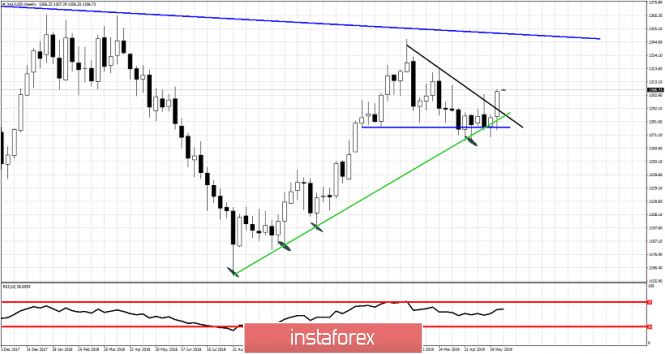
| Posted: 02 Jun 2019 03:27 PM PDT Gold price has given us bullish signals the last couple of trading days of the past week. First short-term resistance at $1,288 was broken and now we have price back above $1,300 breaking important trend lines resistance. Holding above $1,300 and specially $1,290 is key for the bullish scenario.
Blue horizontal line -neckline support Black line - important resistance trend line Blue downward sloping line - major resistance trend line Gold price although initially broke below the Green support trend line, it did not close below it. This was the first bullish sign implying bulls continue to support Gold at $1,270-80 area. Bears were not strong enough to break through. Resistance at $1,290-$1,300 was tested several times and last week we saw Gold price close above $1,300. It is important for bulls to continue to see price above $1,300. This will lead to a move to $1,350. Another failure to hold $1,300-$1,290 would be a bearish sign. The material has been provided by InstaForex Company - www.instaforex.com |
| You are subscribed to email updates from Forex analysis review. To stop receiving these emails, you may unsubscribe now. | Email delivery powered by Google |
| Google, 1600 Amphitheatre Parkway, Mountain View, CA 94043, United States | |


No comments:
Post a Comment