
Forex analysis review |
- GBP/USD to test resistance, a drop is possible!
- NZD/USD approaching support, potential bounce!
- USD/JPY to test resistance, a drop is possible!
- Technical analysis of EURUSD for June 12, 2019
- Technical analysis of Gold for June 12, 2019
- June 11, 2019 : EUR/USD Intraday technical analysis and trade recommendations.
- June 11, 2019 : GBP/USD Intraday technical analysis and trade recommendations.
- Bitcoin analysis for June, 11.2019
- BITCOIN trapped between $7,500 to $8,000 again, June 11, 2019
- Analysis of Gold for June 11,.2019
- GBP/USD analysis for June 11,.2019
- GBPUSD: Buyers of the pound returned to the market amid a good report on wage growth. Euro took a break
- GBP/USD: plan for the US session on June 11. Labor market data provided little support for the pound
- EUR/USD: plan for the US session on June 11. No news is good news too.
- Technical analysis of USD/CHF for May 11, 2019
- Technical analysis of NZD/USD for May 11, 2019
- Technical analysis of NZD/USD for May 11, 2019
- Wave analysis of EUR/USD and GBP/USD on June 11. The Fed may reduce the rate in September
- Simplified wave analysis and forecast for EUR/USD, AUD/USD, and GBP/JPY on June 11
- EUR / USD: Trump once again reminded China about the yuan and criticized the Fed policy
- Brent: Bears overshot
- GOLD to push higher again? June 11, 2019
- EURUSD: EUR strengthens against USD. June 11, 2019
- Markets are waiting for new economic statistics from America (A local growth of EUR/USD and AUD/USD is possible)
- USD/JPY: USD to gain momentum over JPY? June 11, 2019
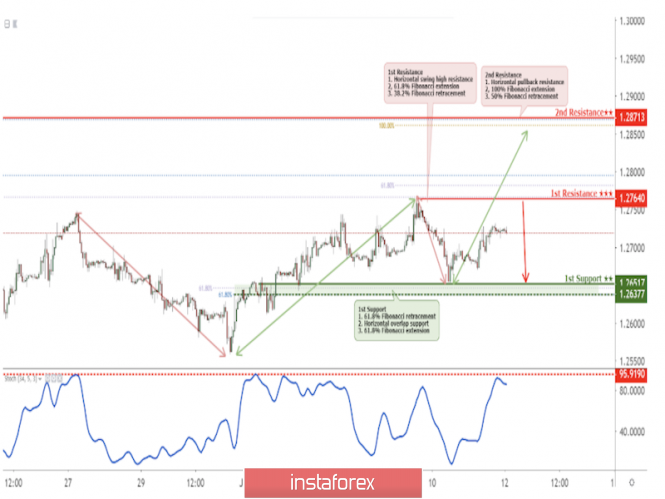
| GBP/USD to test resistance, a drop is possible! Posted: 11 Jun 2019 07:16 PM PDT
GBPUSD to test key resistance, a drop to 1st support is possible Entry: 1.2764 Why it's good : 61.8% Fibonacci extension, 38.2% Fibonacci retracement, horizontal swing high resistance Stop Loss : 1.2871 Why it's good :50% Fibonacci retracement,100% Fibonacci extension, horizontal pullback resistance Take Profit : 1.2652 Why it's good: 61.8% Fibonacci retracement, 61.8% Fibonacci extension, horizontal overlap support
|
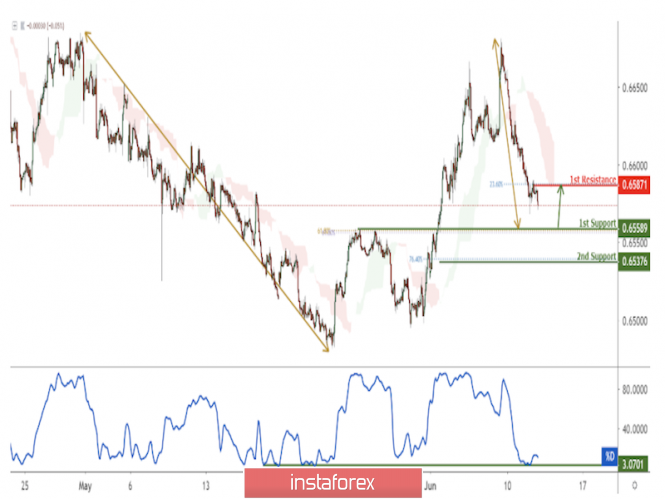
| NZD/USD approaching support, potential bounce! Posted: 11 Jun 2019 07:11 PM PDT
Price is approaching its support where we expect to see a bounce up to its resistance. Entry : 0.6558 Why it's good : 61.8% Fibonacci retracement, 61.8% Fibonacci extension, horizontal pullback support Stop Loss : 0.6537 Why it's good : 76.4% Fibonacci retracement Take Profit : 0.6587 Why it's good : Horizontal swing high resistance, 23.6% Fibonacci retracement
|
| USD/JPY to test resistance, a drop is possible! Posted: 11 Jun 2019 07:07 PM PDT |
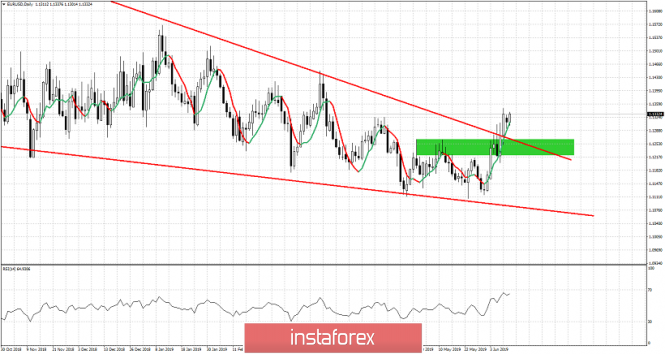
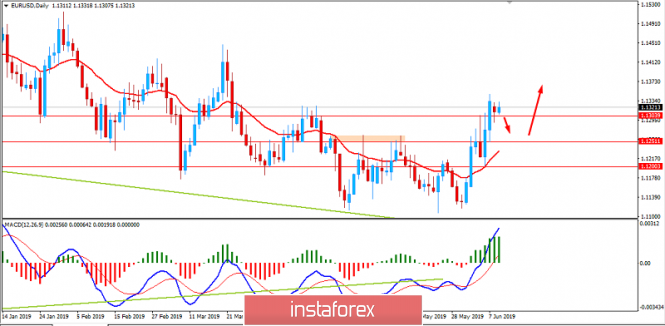
| Technical analysis of EURUSD for June 12, 2019 Posted: 11 Jun 2019 12:23 PM PDT EURUSD has held above support at 1.1230-1.1250. This is a bullish sign. The longer price stays above this area of support, the higher the chances of seeing a new push higher towards 1.14.
Green rectangle - support EURUSD is challenging last week's highs. Breaking above them would be a bullish sign. Price pulled back towards the green rectangle support area and now it bounces off of it. Respecting this support is important for the bullish case we have been calling for the last few posts. The break outside of the wedge pattern has a minimum target of 1.1750. Our breakout and trend reversal was given with the break above 1.1260. Bulls could raise their stops at breakeven. The material has been provided by InstaForex Company - www.instaforex.com |
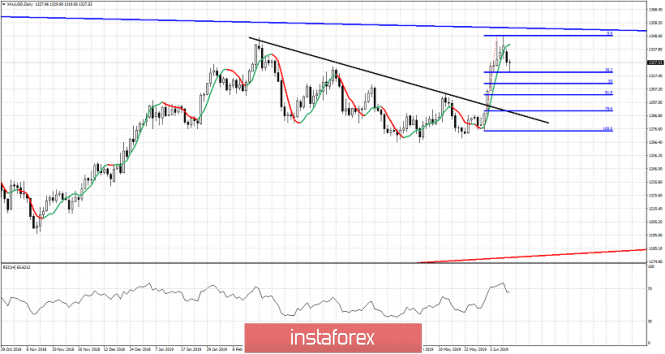
| Technical analysis of Gold for June 12, 2019 Posted: 11 Jun 2019 12:15 PM PDT Gold price pulled back towards the 38% Fibonacci retracement which was the first important short-term support level. Price is bouncing off this level and this is a bullish sign. We should be waiting for a new higher high in Gold.
Red line - major support trend line Black line -short-term resistance (broken) Gold price could make a new higher high this week above $1,349. Trend remains bullish as long as price is above $1,300. Gold price held the support at the 38% Fibonacci retracement. The RSI does not show any bearish divergence sign. Next support is found at $1,302 where we find the 61.8% Fibonacci level and an intermediate high made back on May 14th. The resistance at $1,350 is very strong and very important. Breaking above it or getting rejected at it could be critical for the price of Gold for the next 4-6 months. The material has been provided by InstaForex Company - www.instaforex.com |
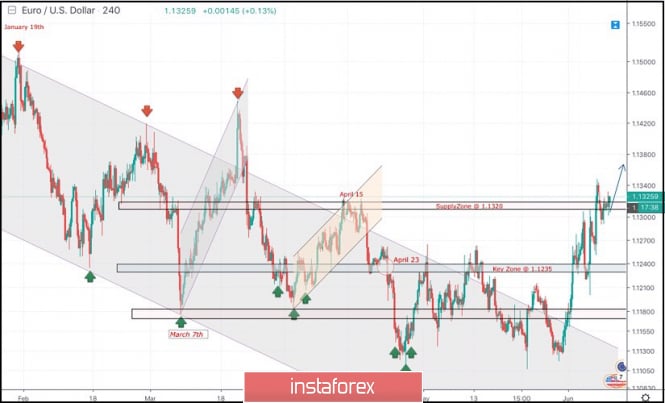
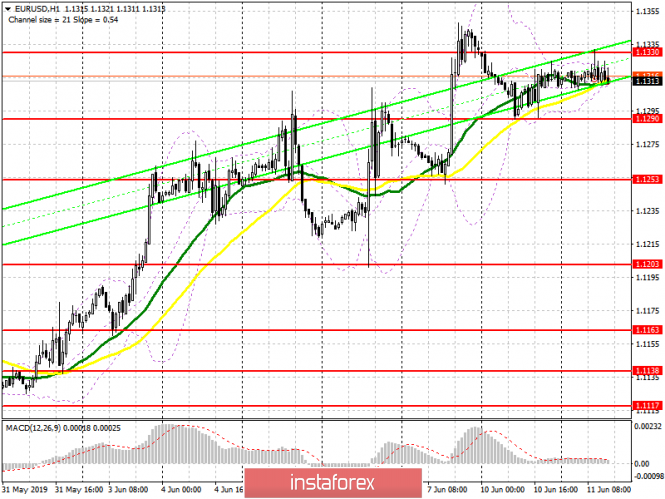
| June 11, 2019 : EUR/USD Intraday technical analysis and trade recommendations. Posted: 11 Jun 2019 09:45 AM PDT
Since January 19th, the EURUSD pair has been moving within the depicted channel with slight bearish tendency. For Intraday traders, the price zone around 1.1235 stood as a temporary demand area which paused the ongoing bearish momentum for a while before bearish breakdown could be executed on April 23. Short-term outlook turned to become bearish towards 1.1175 (a previous weekly bottom which has been holding prices above for a while) On the period between May 17th and 20th, a bearish breakdown below 1.1175 was temporarily achieved. As expected, further bearish decline was expected towards 1.1115 where significant bullish recovery was demonstrated bringing the EURUSD pair back above 1.1175. Recently, The EURUSD pair has maintained bullish persistence above the highlighted price levels (1.1175) and (1.1235). That's why, further bullish advancement was expected towards 1.1320 which failed to apply instant bearish pressure on the EURUSD pair on the previous Friday. Recent Bullish breakout above 1.1320 renders it a newly-established demand level to be watched for BUY entries when bearish pullback occurs. Please also note that Bullish persistence above 1.1320 enhances quick bullish advancement towards 1.1420 - 1.1450. On the other hand, re-closure below 1.1320-1.1300 would probably allow another bearish pullback to occur towards 1.1235 where recent price action should be considered. Trade recommendations : A valid BUY entry was suggested around the price levels of (1.1220-1.1235). It's already running in profits. Remaining Target levels to be located around 1.1380. Stop loss should be advanced to 1.1280 to secure some profits. The material has been provided by InstaForex Company - www.instaforex.com |
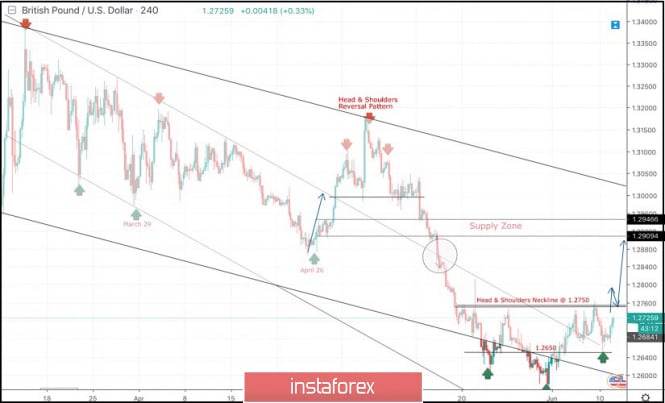
| June 11, 2019 : GBP/USD Intraday technical analysis and trade recommendations. Posted: 11 Jun 2019 09:27 AM PDT
On March 29, a visit towards the price levels of 1.2980 (the lower limit of the newly-established bearish movement channel) could bring the GBPUSD pair again towards the upper limit of the minor bearish channel around (1.3160-1.3180). Since then, Short-term outlook has turned into bearish with intermediate-term bearish targets projected towards 1.2900 and 1.2850. On April 26, another bullish pullback was initiated towards the price zone of 1.3130-1.3170 where the depicted bearish Head and Shoulders reversal pattern was demonstrated on the H4 chart with neckline located around 1.2980-1.3020. Hence, Bearish breakdown below 1.2980 allowed the recent significant bearish movement to occur. Initial bearish Targets were already reached around 1.2900-1.2870 (the backside of the broken channel) which failed to provide any bullish support for the GBPUSD pair. Further bearish decline was demonstrated towards the lower limit of the long-term channel around (1.2700-1.2650) where the GBPUSD pair looked oversold obviously. That's why conservative traders were suggested NOT to consider any SELL signals around those low price levels. As anticipated, bullish breakout above 1.2650 has already been achieved. This enhanced the bullish side of the market towards 1.2750 which prevented further bullish advancement Temporarily. For the bulls to remain dominant, another bullish breakout above 1.2750 is needed to extend potential bullish targets towards 1.2800, 1.2890 and 1.2940 if sufficient bullish momentum is demonstrated. On the other hand, the price level of 1.2650 stood as a prominent demand level offering a valid BUY entry earlier Yesterday(demonstrating a bullish Head & Shoulders reversal pattern). However, any bearish breakout below 1.2650 invalidates the mentioned bullish scenario. Trade Recommendations: For Intraday traders, A valid BUY entry can be offered upon bullish breakout above 1.2750. T/P level to be located around 1.2820, 1.2900 and 1.2940. S/L should be placed below 1.2690. Conservative traders should wait for an extensive bullish movement towards 1.2870-1.2905 (newly-established supply zone) to look for valid long-term SELL entries. S/L should be placed above 1.2950. The material has been provided by InstaForex Company - www.instaforex.com |
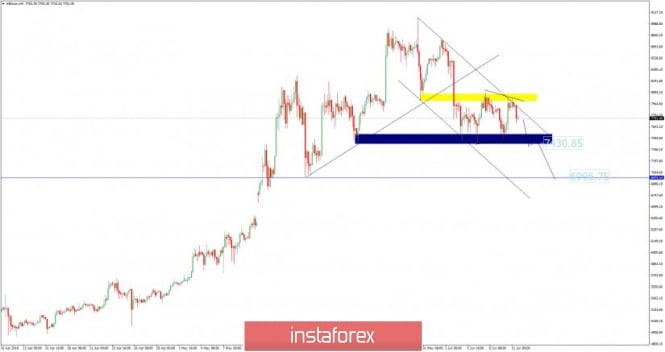
| Bitcoin analysis for June, 11.2019 Posted: 11 Jun 2019 08:37 AM PDT BTC is trading inside of the downward channel. We didn't see any sign of the reversal yet so you should focus on the selling opportunties. Key resistance is set at the price of $8.095.
Yellow rectangle - resistance Blue rectangle - support Black lines – downward channel Blue horizontal line – support 2 Broken upward trendline in the background and downward channel in the place. We got series of the lower lows and lower highs, which is sign of the downward trend.Resistance level is set at the price of $8.053 and the key support at the price of $7.430. Our advice is to watch for selling opportunities. Downward targets are set at the price of $7.430 and $6.996. Only if you see the breakout of the resistance at $8.095, watch for potential buying. The material has been provided by InstaForex Company - www.instaforex.com |
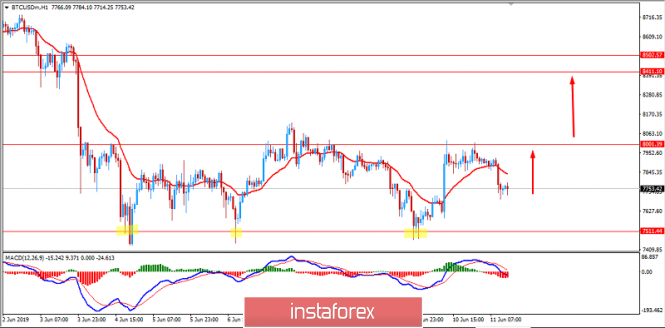
| BITCOIN trapped between $7,500 to $8,000 again, June 11, 2019 Posted: 11 Jun 2019 08:06 AM PDT Bitcoin has been recently ranging between $7,500 to $8,000 after it was rejected off the $9,000 resistance area earlier with a daily close. The bearish momentum was quite impulsive. BTC was trading sideways for a few days without any clear direction that indicates the continuation of the preceding bullish trend. Due to the strength of this sudden move which came after days of relative weakness and non-action, optimists believe that BTC is ready to resume a rally. Since hitting $9,000, Bitcoin hasn't been able to develop the bullish trend. Moreover, the Moving Average Convergence Divergence (MACD) is about to flip red and cross below equilibrium. While there are more short to medium-term bears than bulls, many analysts advise traders to wait on the sidelines due to the lack of clear signals. Meanwhile, the price has already managed to bounce off the $7,500 area for 3 times, including a false break as well. Though the MACD line is residing below the zero line, being above $7,500 with smaller bearish histograms in MACD, the price is still expected to have potential to push higher towards $8,000 and later towards $9,000 again. Alternatively, if BTC closes below $7,500 on a daily basis, the bearish pressure will gain further impulsiveness and may push the price towards $6,000 again. SUPPORT: 7,000, 7,500 RESISTANCE: 8,000, 8,400, 8,500, 9,000 BIAS: BULLISH MOMENTUM: VOLATILE
|
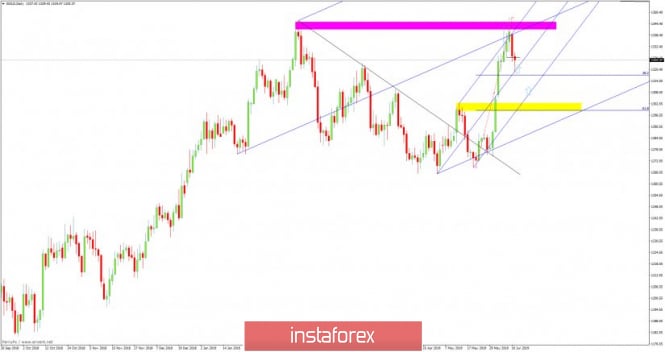
| Analysis of Gold for June 11,.2019 Posted: 11 Jun 2019 08:00 AM PDT Gold did reject from the important horizontal resistance at $1.345. Sellers did well defend the level of $1.345, which is further sign of the potential weakness on the Gold. The level of $1.303 might be in play.
Pink rectangle - resistance Yellow rectangle - support Blue lines – upward channel EURUSD is challenging the $1.319 support.. Support can also be found at the yellow rectangle area at $1.303. However it is not necessary to expect a pull back now. Gold is in bullish trend and it wont probably go much deep correction so the level around $1.319 may be the most of downside for now. A reversal from this level could signal the start of a new upward move starting that could eventually push price to re-test high around $1.245. Watch for buying opportunities. The material has been provided by InstaForex Company - www.instaforex.com |
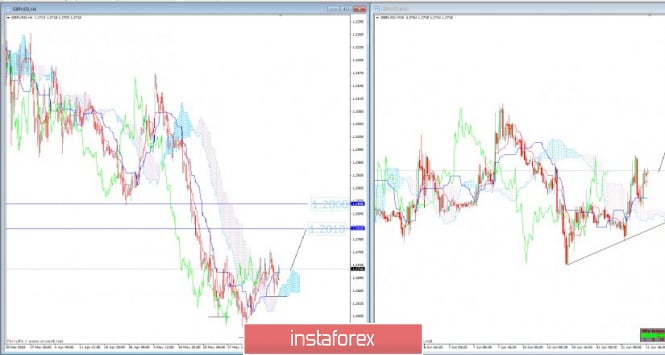
| GBP/USD analysis for June 11,.2019 Posted: 11 Jun 2019 07:37 AM PDT GBP/USD has been trading upwards in past 10 hours. We found that Ichimoku Cloud served like a good support on the 4H chart. Upside preferable.
H4 Ichimoku Kijun-sen (blue line) – 1.2707 support H4 Ichimoku Tenkan –sen (red line)-1.2690 support 2 We found that on both time-frames H4 and M30 we got price that is trading above the Ichimoku cloud, which is sign that short-term trend is bullish. On our scan we found that the trend is bullish on H4,H1,M30 and M15 time-frames, which is another good sign that GBP is in strong upward movement. As long as the price is trading above the Ichimoku cloud on H4, we will watch for long positions.Swing low support is seen at the price of 1.2653 and resistance at 1.2750. Buying opportunities are preferable. Upward targets are set at the price of 1.2810 and 1.2860. The material has been provided by InstaForex Company - www.instaforex.com |
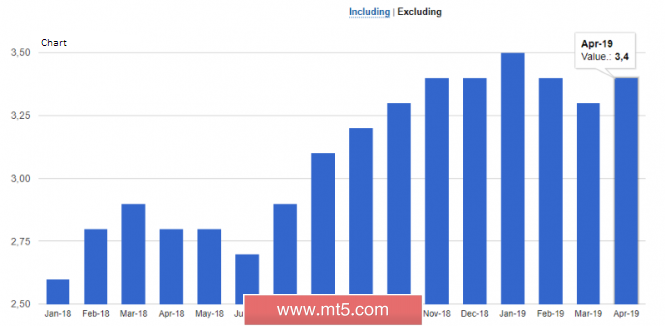
| Posted: 11 Jun 2019 07:18 AM PDT The British pound rose to intraday highs against the dollar and the euro. A good report on the UK labor market pointed to higher earnings and continued low unemployment. Many experts did not expect that more jobs would be created in April than in March, nor did they expect that wages would maintain fairly high growth rates. Along with this, wage growth may be a headache for the Bank of England, which also does not already know how to cope with a gradually increasing level of inflation, which can go beyond the established 2.0%. According to ILO standards, the number of unemployed in the UK fell from February to April of this year by 34,000 at once, while the unemployment rate remained within the historic lows around 3.8%. The good news for consumers was the increase in their average earnings, which increased from February to April of this year by 3.4%, after rising by 3.3% from December to February. Apparently, Brexit and problems with it were leveled by good economic growth rates. Applications for unemployment benefits in the UK in May this year increased by 23,200, and the unemployment rate was 3.1%. As for the technical picture of the GBPUSD pair, buyers have managed to return to the market after yesterday's disappointing reports on economic growth rates in recent months. However, a small uptrend is limited by a large resistance level of 1.2730, breaking above which will be very difficult. The pressure on the pound will gradually increase, and the reduction under the intermediate support of 1.2690, which buyers do not want, may lead to the demolition of a number of stop orders and the continuation of the bearish trend aimed at the nearest support levels in the area of 1.2610 and 1.2560. As for the data for the euro area, nothing interesting was published in the first half of the day, which left the technical curtain in the EURUSD pair unchanged. It is likely that the demand for risky assets will continue in the context of possible changes in the Fed's monetary policy. If we talk about the short-term forecast, support is seen at the level of 1.1290, while the breakthrough of intermediate resistance in the area of 1.1330 will lead to a larger upward trend of the trading instrument with updating highs in the areas of 1.1370 and 1.1430. Data on the confidence of small business owners in the US has also been ignored by the market. In May of this year, confidence has increased slightly compared with April. According to the report of the National Federation of Independent Business (NFIB), the US small business optimism index in May 2019 was 105.0 points against, 103.5 points in April. The NFIB continues to note improvements in sales expectations, as well as business conditions. The material has been provided by InstaForex Company - www.instaforex.com |
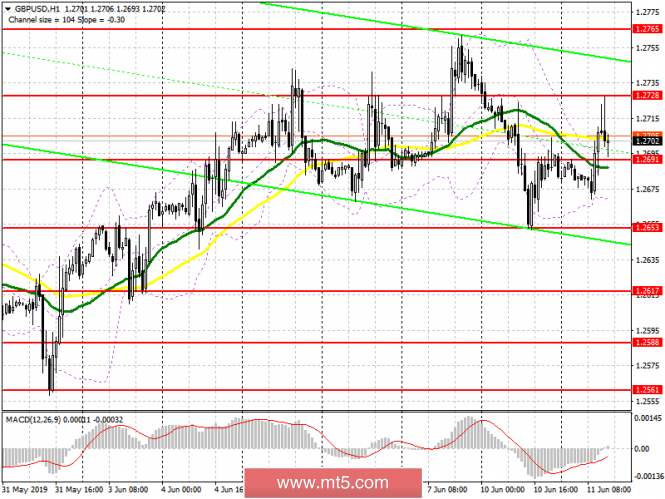
| GBP/USD: plan for the US session on June 11. Labor market data provided little support for the pound Posted: 11 Jun 2019 07:18 AM PDT To open long positions on GBP/USD, you need: The growth of the average earnings helped the pound to strengthen its position in the first half of the day, and while trading will be conducted above the support of 1.2691, the demand for GBP/USD will remain. The main task will be to re-test the maximum of 1.2728, where the first profit took place in the first half of the day, will lead to a breakthrough in this range and a larger upward trend in the area of 1.2765. In case of return of the pound under the support level 1.2691, to the long positions, you can look for a rebound from the low of 1.2653. To open short positions on GBP/USD, you need: The sellers of the pound coped with the morning task and declared themselves from the resistance of 1.2728, from where I recommended to open short positions. The main goal of the bears for the second half of the day will be the middle of the channel 1.2691, the breakthrough of which will lead to the update of the lower border in the area of 1.2653, where I recommend taking the profit. With further growth of GBP/USD, which is unlikely, it is best to expect sales to rebound from the new high of 1.2765. Indicator signals: Moving Averages Trading is conducted in the region of 30 and 50 moving averages, which indicates market uncertainty with a further direction. Bollinger Bands The downward movement of the pound will be limited by the lower limit of the indicator around 1.2670. Description of indicators
|
| EUR/USD: plan for the US session on June 11. No news is good news too. Posted: 11 Jun 2019 07:18 AM PDT To open long positions on EURUSD, you need: The situation did not change in the morning and the technical picture remained the same. At the moment, the repeated resistance test of 1.1330 can lead to a breakdown, and the main task of the bulls will be to consolidate above 1.1330, which will indicate the continuation of the upward trend with an exit to a maximum of 1.1366 and 1.1392, where I recommend taking the profit. In the scenario of a repeated decline to the support area of 1.1290, it is best to return to long positions on a false breakout, or already on a rebound from the minimum of 1.1253. To open short positions on EURUSD, you need: The bears coped with the task and formed a false breakout in the resistance area of 1.1330, but this did not lead to the desired sale of the euro. The main goal is the support of 1.1290, the repeated test of which will necessarily lead to its breakthrough and the descent of EUR/USD to the minimum area of 1.1253, where I recommend taking the profit. In the case of growth in the second half of the day above the resistance of 1.1330, it is best to sell the euro on the rebound from the new monthly high in the area of 1.136 and 1.1392. Indicator signals: Moving Averages Trading is conducted in the area of 30 and 50 moving averages, which indicates the uncertainty of the market. Bollinger Bands Volatility has dropped sharply, which does not give signals to enter the market.
Description of indicators
|
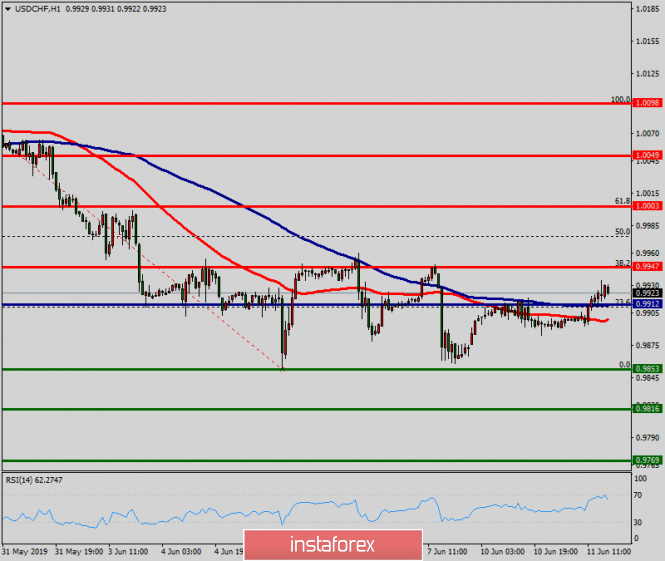
| Technical analysis of USD/CHF for May 11, 2019 Posted: 11 Jun 2019 07:12 AM PDT Pivot point: 0.9912. The USD/CHF pair continues to move downwards from the level of 0.9947. The pair dropped from the level of 0.9947 to the bottom around 0.9912. Today, the first resistance level is seen at 0.9947 followed by 1.0003, while daily support 1 is seen at 0.9853. According to the previous events, the USD/CHF pair is still moving between the levels of 0.9947 and 0.9853; for that we expect a range of 94 pips. If the USD/CHF pair fails to break through the resistance level of 0.9947, the market will decline further to 0.9853. This would suggest a bearish market because the RSI indicator is still in a positive area and does not show any trend-reversal signs. The pair is expected to drop lower towards at least 0.9853 with a view to test the second support. However, if a breakout takes place at the resistance level of 1.0003 (major resistance), then this scenario may become invalidated. The material has been provided by InstaForex Company - www.instaforex.com |
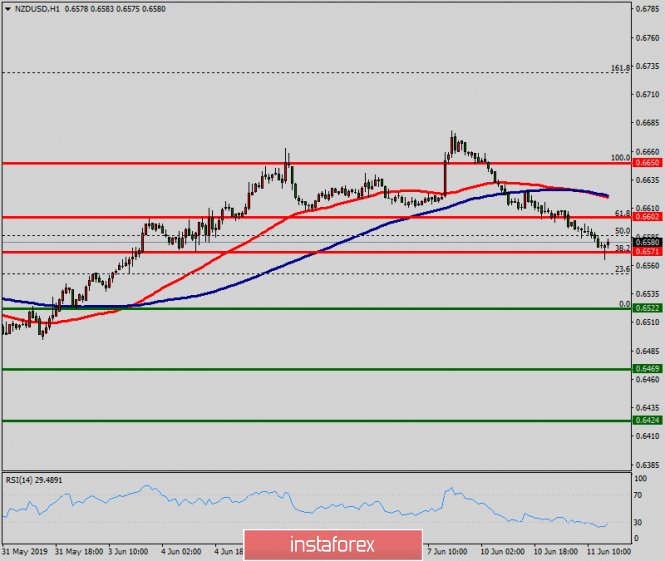
| Technical analysis of NZD/USD for May 11, 2019 Posted: 11 Jun 2019 06:58 AM PDT Overview: The NZD/USD pair is showing signs of weakness following a breakout of the lowest level of 0.6571. On the H1 chart, the level of 0.6571 coincides with 38.2% of Fibonacci, which is expected to act as minor resistance today. Since the trend is below the 38.2% Fibonacci level, the market is still in a downtrend. However, the resistance is seen at the level of 0.6571. Furthermore, the trend is still showing strength above the moving average (100). Thus, the market is indicating a bearish opportunity below the above-mentioned support levels, for that the bearish outlook remains the same as long as the 100 EMA is headed to the downside. Therefore, resistance will be found at the level of 0.6571 providing a clear signal to buy with a target seen at 0.6500. If the trend breaks the first supprt at 0.6500, the pair is likely to move downwards continuing the bearish trend development to the levels 0.6469 and 0.6424. The material has been provided by InstaForex Company - www.instaforex.com |
| Technical analysis of NZD/USD for May 11, 2019 Posted: 11 Jun 2019 06:56 AM PDT The NZD/USD pair is showing signs of weakness following a breakout of the lowest level of 0.6571. On the H1 chart, the level of 0.6571 coincides with 38.2% of Fibonacci, which is expected to act as minor resistance today. Since the trend is below the 38.2% Fibonacci level, the market is still in a downtrend. However, the resistance is seen at the level of 0.6571. Furthermore, the trend is still showing strength above the moving average (100). Thus, the market is indicating a bearish opportunity below the above-mentioned support levels, for that the bearish outlook remains the same as long as the 100 EMA is headed to the downside. Therefore, resistance will be found at the level of 0.6571 providing a clear signal to buy with a target seen at 0.6500. If the trend breaks the first supprt at 0.6500, the pair is likely to move downwards continuing the bearish trend development to the levels 0.6469 and 0.6424. The material has been provided by InstaForex Company - www.instaforex.com |
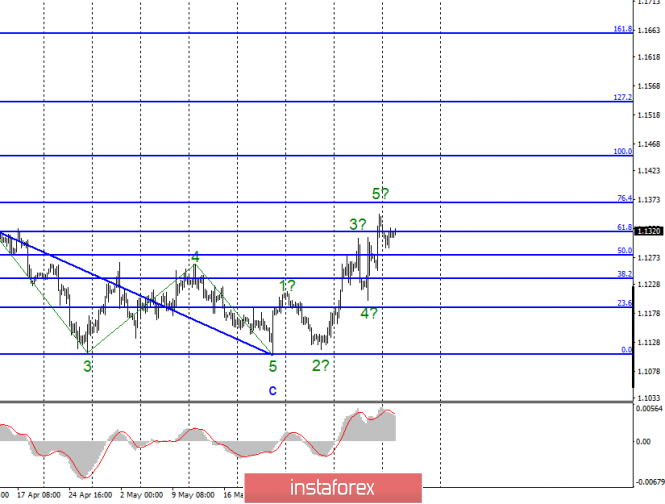
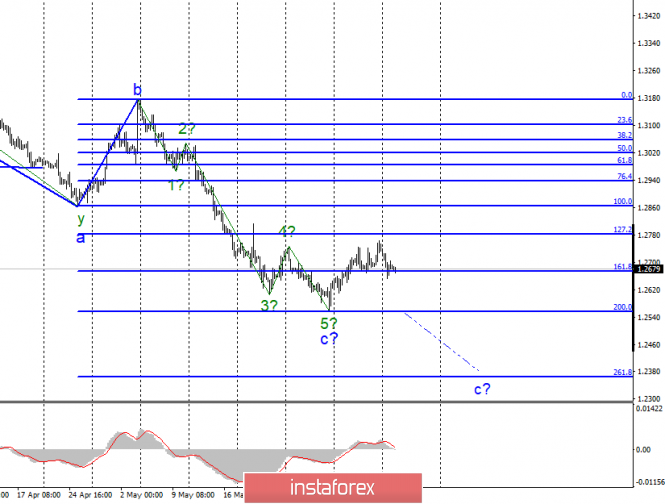
| Wave analysis of EUR/USD and GBP/USD on June 11. The Fed may reduce the rate in September Posted: 11 Jun 2019 06:29 AM PDT EUR/USD
Monday ended for the EUR/USD pair with a decrease of 20 bp. If the current wave layout is correct, then the 5th wave combination of the upward waves is already constructed. Therefore, from the current position, we can expect a decrease in the instrument within the correction set of waves. At the same time, a successful attempt to break the maximum of the expected wave 5 will lead to a complication of the internal wave structure of the trend area, which begins on May 23. Recently, the markets are increasingly discussing the slowdown of the US economy. For some, this is of great concern, as trade wars will not pass unnoticed by the US economy. As official reports show recently, the US economy is really slowing down. Jerome Powell admits a rate cut in the near future, and various economic publications believe that the probability of a rate cut in September is 80-90%. Donald Trump has long been putting pressure on Powell, believing that the Fed is too fast and often tightens monetary policy. Perhaps now Powell will hear the US President and we are waiting for a rollback on the rates down. Purchasing goals: 1.1367 – 76.4% Fibonacci 1.1447 – 100.0% Fibonacci Sales targets: 1.1106 – 0.0% Fibonacci General conclusions and trading recommendations: The euro/dollar pair is expected to be at the stage of building the first wave of a new trend segment. However, the construction of a correction set of waves can begin today or tomorrow. Based on this, I recommend waiting for the beginning of the construction of wave 2, and upon its completion from the lows between 11 and 12 figures, buy a pair of euro/dollar with goals located above the 14 figure. GBP/USD
Everything that is said in the section about the EUR/USD pair has a weak impact on the pound/dollar pair. The pound sterling remains the main factor for Brexit. Plus, the UK cannot please now strong statistics, which is not surprising. Thus, even fears for a possible weakening of the Fed's monetary policy do not particularly help the pound. Yesterday, the pound ended with a loss of about 50 basis points. At the moment, the chances of building three waves up remain. At least three waves. Then, upon completion of the correction section of the trend, it will be possible to assume the construction of a new 5-wave section down. However, the news background, which remains, though not entirely in favor of the dollar, causes the markets only one desire – to sell the pound. Perhaps in the near future, the situation will change, but so far it is very difficult to count on it. In any case, I recommend waiting for a successful attempt to break the minimum of the expected wave C to confirm the readiness of the pair to continue building a downward trend. Sales targets: 1,2554 – 200.0% Fibonacci 1.2360 – 261.8% Fibonacci Purchasing goals: 1.3175 – 0.0% Fibonacci General conclusions and trading recommendations: The wave pattern of the pound/dollar instrument suggests the resumption of the instrument's decline within the expected wave C or a new, fifth wave. Thus, now I recommend waiting for the breakthrough of the level of 200.0% and sell the pound with targets located near the calculated marks of 1.2360 and 1.2176, which corresponds to 261.8% and 323.6% of Fibonacci. Purchases, from my point of view, are now associated with increased risks. The material has been provided by InstaForex Company - www.instaforex.com |
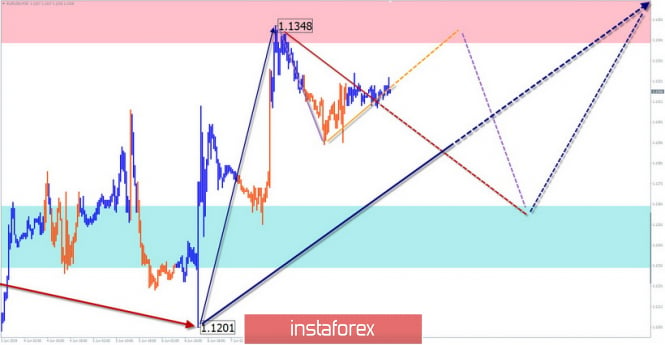
| Simplified wave analysis and forecast for EUR/USD, AUD/USD, and GBP/JPY on June 11 Posted: 11 Jun 2019 06:29 AM PDT EUR/USD The bullish wave of May 23 has a sufficient wave level to give rise to a new short-term trend. The price is at the bottom of a wide potential reversal zone. Since June 6, the bearish correction began to form in the wave structure. Forecast: Today, the upward pullback, which began yesterday, is expected to be completed, given the generally flat nature of the movements. Breaking the upper limit of resistance is unlikely. Further, the formation of a reversal and the beginning of a price decline is expected. The most likely lower limit of daily volatility is the support zone. Recommendations: Euro purchases today should be made with small upside potential. Short-term sales of the instrument are possible upon confirmation of the exchange rate change. The most reasonable tactic is to wait out the correction stage outside the market. Resistance zone: - 1.1340/1.1370 Support zone: - 1.1260/1.1230
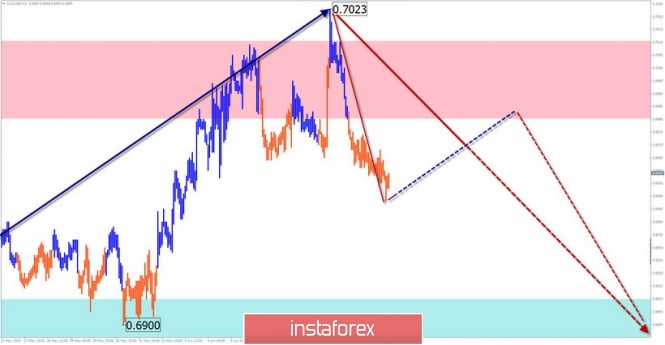
AUD/USD The Australian dollar major chart is dominated by a bearish trend. The bullish wave from May 17, which sets the vector to the direction of interday price fluctuations, is a correction of its last section. The wave reached a strong resistance. The decline that began on June 8 has a reversal potential, which indicates an early change in the price movement of the pair. Forecast: In the next trading sessions, the flat mood of the price movement is most likely. In the first half of the day, an upward vector of oscillations is expected; by the end of the day, the probability of a turn and the beginning of a decline increase. At the beginning of the descending phase, the volatility of movements can sharply increase. Recommendations: Buy "Aussie" today is unpromising, due to the low expected turn-up. In the area of the calculated resistance, it is recommended to start tracking your vehicle's signals to sell the instrument. Resistance zone: - 0.6980/0.7010 Support zone: - 0.6910/0.6880
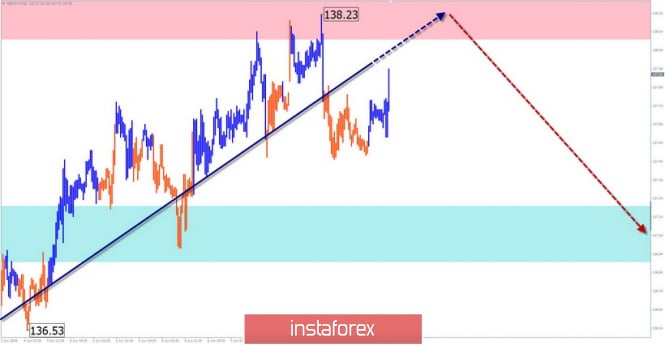
GBP/JPY On the cross chart against the general downward trend stands out bullish area from May 31. According to its potential, it takes the place of correction of the last section of the main wave. The wave structure looks complete. The price is approaching the lower limit of a wide potential reversal zone of a large scale. Forecast: Today, the upward trend of the price movement is expected to continue until its full completion. Further, it is expected to change the rate of movement and the price move of the pair down. Before the change, of course, the probability of a short-term break of the upper limit of the resistance zone remains. Recommendations: When buying a cross, the probability of a deep counter-rollback of the price should be taken into account. More promising may be the sale of the instrument, tracked in the area of the calculated resistance zone. Resistance zone: - 138.10/138.40 Support zone: - 137.20/136.90
Explanations to the figures: Waves in the simplified wave analysis consist of 3 parts (A-B-C). The last unfinished wave is analyzed. Zones show areas with the highest probability of reversal. The arrows indicate the wave marking according to the method used by the author, the solid background is the formed structure, the dotted ones are the expected movements. Note: The wave algorithm does not take into account the duration of tool movements over time. The material has been provided by InstaForex Company - www.instaforex.com |
| EUR / USD: Trump once again reminded China about the yuan and criticized the Fed policy Posted: 11 Jun 2019 05:05 AM PDT Yesterday, the American president expressed his opinion once again about the trade war being waged by his administration with China. Trump believes that he can reach a trade agreement with China and the problem that exists around Huawei will be solved. The American president is also confident that the Chinese authorities have an advantage over the United States, as they constantly weaken their currency. Meanwhile the Federal Reserve is on the way back and does not lower interest rates. Criticism of the Fed chairman is not the first time that the American president has sounded. This time, Trump noted that some of the Fed's decision-makers in monetary policy are not suitable for this. As for the fundamental statistics, which was published yesterday, the market took it rather calmly as a whole. According to the Conference Board, the employment trends index rose to 111.63 points in May against the revised April value of 110.21 points. The agency noted that, the decline in the index will be quite moderate despite some slowdown in employment growth. Yet, the decline in inflation expectations once again confirms the need for the Fed to resort to lower interest rates. According to the Fed-New York report, it is predicted that in a year inflation will be 2.5% and in three years will be 2.6%, which is 0.1% lower than the April figures. Let me remind you that the Fed is closely monitoring inflation expectations, and a decrease in interest rates is likely if it fails to reach the target inflation rate of 2% on an ongoing basis. The market inflation expectations for the next five years also remained below 2%. As for the general technical picture of the EUR/USD pair, it is likely that the demand for risky assets will continue in the context of possible changes in the Fed's monetary policy. If we talk about the short-term forecast, support is seen at the level of 1.1290 while the breakthrough of intermediate resistance in the area of 1.1330 will lead to a larger uptrend of the trading instrument with updating highs in the areas of 1.1370 and 1.1430. As for the Canadian dollar, yesterday's data on a sharp decline in the bookmarks of new homes did not frighten buyers. The USD/CAD pair remained at its lows and apparently, will continue to decline. According to a report by the Canada Mortgage and Housing Corp., the number of bookmarks for new homes in May 2019 decreased by 13.3% to 235,460 homes. The agency noted that the volatility of laying houses in Canada continued with the fall in May, following a strong increase in April. The material has been provided by InstaForex Company - www.instaforex.com |
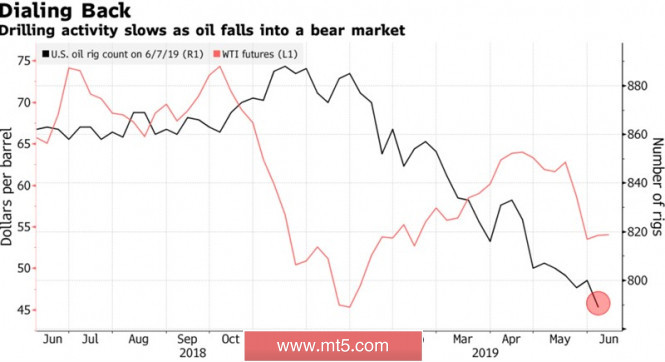
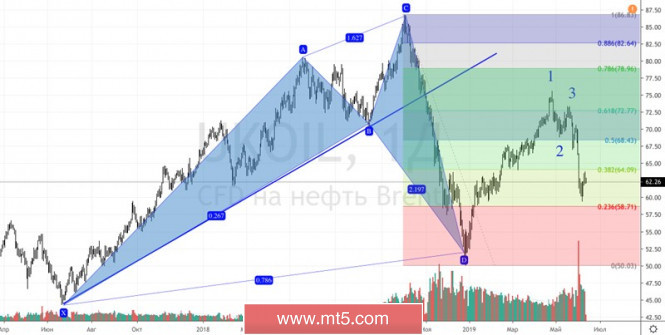
| Posted: 11 Jun 2019 04:35 AM PDT It is considered that if prices fall by 20% or more, then the asset moves to the territory of the "bear" market. In the case of oil, the situation is aggravated by the fact that the May peak was the most significant since the world financial crisis. Brent and WTI fell to 2008 levels, but is the US economy in recession? Not! On the contrary, it is ready to continue the longest economic expansion in its entire history and the Fed is on guard. If something goes wrong, it intends to loosen monetary policy. In such conditions, you begin to understand that prices have gone down. The market is oversold, which means that there is a reason to expect growth. The escalation of the US-Chinese trade conflict and Donald Trump's intention to impose duties on all Mexican imports have heightened investors' fears about a reduction in global oil demand growth. According to the estimates of the consulting company Energy FGE, the figure may expand only by 1 million b/s in 2019. At the same time, Washington has already reached an agreement with Mexico and intends to sign an agreement with Beijing. The US president even threatens China with duties on all imports if Xi Jinping does not appear to meet him in Osaka at the G20 summit. Market's faith in the de-escalation of the conflict contributed to the 5-day rally of US stock indices, diverging from oil for some time that suggests some underestimation of Brent and WTI. The lower fall of prices, the greater the chance that OPEC and other producing countries will prolong the agreement on production cuts by 1.2 million b/s at the end of June to the end of this year. Following the meeting between Saudi Arabia and Russia, it was noted that if this is not done, oil prices may fall below $40 a barrel. It seems that the main players are determined and they are not afraid of the fact that the Vienna agreement creates preferential conditions for American companies. However, the fourth in the last five weeks, the reduction of drilling rigs from Baker Hughes to 789 (-96 since the beginning of the year) indicates that not everything in the United States is in order with the production. Dynamics of oil prices and drilling rigs Yes, speculators reduce net longs for oil for the sixth consecutive week and brought the ratio of long and short positions to 4.4 to 1, which is the lowest value of the indicator for 12 weeks and has gone far from the current year's maximum mark of 14 to 1. However, all of these occurred against the background of the US-Chinese and US-Mexican conflicts. Improving the situation will change the outlook of investors. Technically, in the case of updating the June low risks, Brent continues to peak in the direction of $50 per barrel and below as part of the implementation of the 5-0 pattern. In order to return the initiative to their own hands, the bulls must raise quotes above $ 64.1. It turns out that the North Sea grade of oil will have a chance to draw consolidation and rise to the level of $ 68.5 per barrel. Brent daily chart |
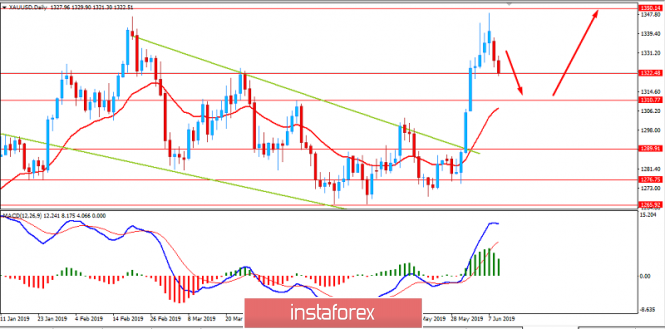
| GOLD to push higher again? June 11, 2019 Posted: 11 Jun 2019 04:02 AM PDT Gold managed to reach the $1350 area with an impulsive non-volatile bullish pressure and formed Double Top pattern. It may pull the price down towards $1300-1320 support area. Gold pushed lower after an eight-day streak in the previous session as the US and Mexico made a deal. Asian stocks were mostly higher amid upbeat economic reports. Chinese shares gained near 2%. Monday's better-than-expected trade data also provided some support. Expectations of interest rate cuts by the US Federal Reserve were also cited as a tailwind for the yellow metal. The US central bank is due to issue its next policy statement on June 19 after its monthly meeting. Fed Chairman Jerome Powell assured markets last week the central bank will do whatever it takes to shield the U.S. economy from recession owing to trade wars and preserve nearly a decade of record growth. Gold pundits mostly see August gold futures topping $1,400 an ounce between now and June 19, when the Fed is due to issue its next policy statement after its monthly meeting. While the central bank is not expected to decide outright on a rate cut at this round, traders will be closely watching the language in its statement to gauge how dovish it is and whether an easing could be expected in coming months. As of the current scenario, the price is expected to drop towards $1300 area before the price goes higher towards $1450-1500 area. Though the market sentiment is currently quite corrective, so reaching the resistance area is unlikely to happen anytime soon. As the price remains above the $1300 area with a daily close, the impulsive bullish bias may continue further. SUPPORT: 1250, 1289, 1300, 1320 RESISTANCE: 1350, 1400, 1450, 1500 BIAS: BULLISH MOMENTUM: VOLATILE
|
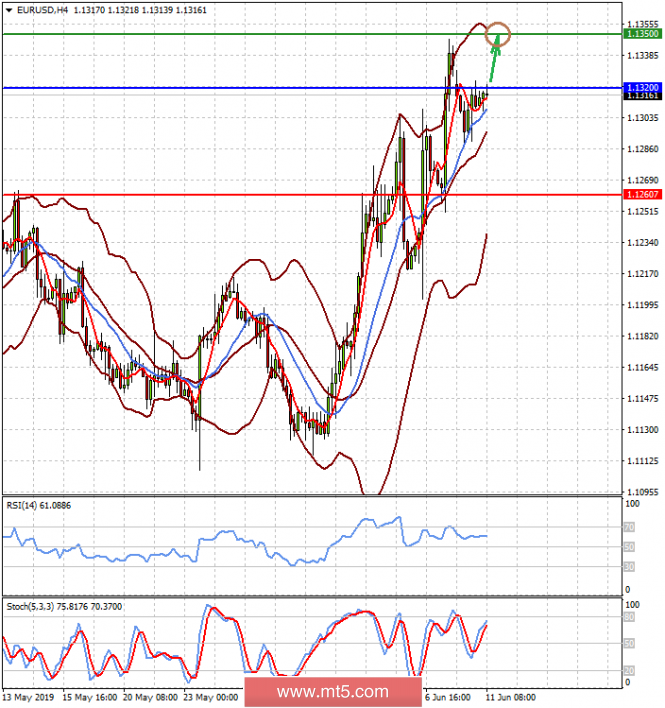
| EURUSD: EUR strengthens against USD. June 11, 2019 Posted: 11 Jun 2019 03:27 AM PDT The euro managed to assert strength against the greenback residing above the 1.1300 area with a daily close. The weak NFP report supported the gains of the euro. Nevertheless, the Eurozone economy continues to shrink. A global trade war is unlikely to subside economic growth. Additionally, the European Central Bank is ready to use any of its instruments to prop up confidence and growth in the currency bloc. The ECB last week gave the Eurozone a fresh boost with cheap funding for banks while ECB President Mario Draghi stated that the bank was ready to consider a wider range of measures to prop up inflation, which has undershot the ECB's target since 2013. With interest rates below zero, banks increasingly complain that ECB policy is hurting their profitability to the extent that it is hampering the flow of credit and thus transmission of its easy policy. The ECB now sees rates steady at least through the first half of 2020, having pushed back any move several times already. Moreover, the Eurozone Unemployment rate has shown an improvement from 7.7% to 7.6% where the Spanish Unemployment change decreased from -91.5K to -84.1K. The core CPI Estimate has been decreased from 1.3% to 0.8% on a yearly basis where the French Industrial Production increased from -1.1% to 0.4%. The French Final CPI is expected to be unchanged at 0.2% along with the German CPI. On the other hand, the US economy has weakened amid worse economic data such as Non-Farm Employment Change. The reading decreased significantly to 75k from 224k which was expected to be at 177k. Average Hourly Earnings and Unemployment Change remained unchanged. Market expectations for a Fed rate cut in June rose to 27.5% from 16.7% after the jobs data release, according to the CME Group's Fed Watch. The market participants are curious about the Fed's decision on key rate reduction in July. The major US equity indexes posted strong gains last week as weaker than expected economic data increased the odds of easier monetary policy from the Federal Reserve. Bond traders expect that the Federal Reserve will start slashing interest rates within months and the trade deal between the U.S. and Mexico has barely put a dent in that view. The tension between Mexico and America has eased, concern about the trade fight between the U.S. and China continues to weigh on investor confidence. Today US PPI report is going to be published. The reading is expected to drop to 0.1% from 0.2%. Core PPI is expected to rise to 0.2% from 0.1%. As of the current scenario, further correction is expected in this pair. The euro has greater chances to sustain gains over the US dollar as the US economy has been undermined by trade war tensions and weak economic reports. Now let us look at the technical view. The price is currently residing above the 1.1300 area with a daily close. Certain indecision bar closed yesterday with a daily candle inside the impulsive bullish breakout bar. The price is currently residing apart from the Mean, which is expected to revert to a dynamic level of 20 EMA before proceeding further upward. As the price remains above 1.1200 area with a daily close, the bullish bias is expected to continue with the target towards 1.1450-1.1500 area. |
| Posted: 11 Jun 2019 02:43 AM PDT The absence of any new picks between the United States and China against the backdrop of a global trade war has somewhat reassured financial markets. On this wave, stock markets resumed upward momentum, although the growth rate present earlier declined slightly. The lack of agreement between Washington and Beijing continues to be the main negative factors for financial markets. Uncertainty and a high probability of continuing escalation of the trade conflict, which was actively fueled by political opposition, has restrained investors from the desire to take decisive action in the markets. True, the expectations of a decline in interest rates by the Fed that grew last week already this year have somewhat softened trade conflicts between the States and their main partners in the world but does not exclude the influence of these global problems. In practice, we can say that investors will continue to follow closely the economic statistics coming from America, which the Fed will actually force to reduce the borrowing cost or eliminate this possibility at least. Today, investors will be attracted by the publication of producer price index data in the USA. It is assumed that the figure will decline in growth to 2.0% from 2.2% on an annualized basis and its monthly May value will fall to 0.1% from 0.2% in April. The value of the basic producer price index should also fall to 2.3% in annual terms from 2.4%. However, on the contrary, the May forecast value should grow by 0.2% against the April increase by 0.1%. Despite the fact that in recent years, the markets have begun to almost completely ignore the published data on industrial inflation as the attention of the Fed itself overwhelmingly focused on the values of consumer inflation. These figures can be a catalyst for a new surge of optimism about the expected lowering of interest rates in the US and lowering the dollar rate. If it demonstrates lower values, which will be a confirmatory factor of slowing down the general inflationary pressure, may force the US regulator not to delay the lowering of rates. Forecast of the day: The EUR/USD pair is trading below the resistance level of 1.1320. If the data of industrial inflation in the United States are worse than expected, this may lead to local growth of the pair to 1.1350. The AUD/USD pair remains in a short-term uptrend. It may turn upward and grow to 0.7010.against the background, perhaps to the weaker value of 0 in the industrial inflation from the USA. |
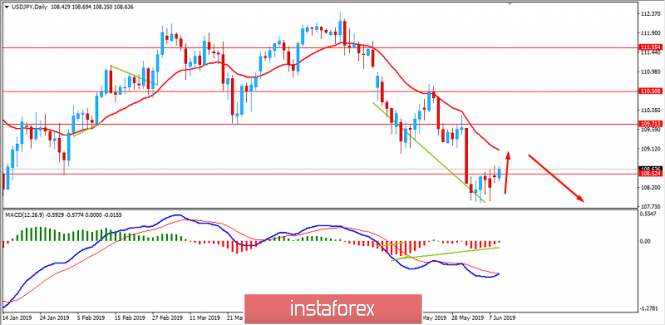
| USD/JPY: USD to gain momentum over JPY? June 11, 2019 Posted: 11 Jun 2019 02:40 AM PDT USD/JPY has been consolidating and struggling at near 108.50 following an impulsive non-volatile bearish trend since the bullish rejection off 112.00 resistance area with a daily close. On Friday, investors were astonished by unexpectedly dismal US nonfarm payrolls. Weak NFP is responsible for severe weakness of USD against JPY. Moreover, USD is widely expected to lose ground against JPY in the coming days. The USD/JPY pair opened a new trading week with the gap up. The news that the US and Mexico reached an agreement over illegal migration and tariffs boosted high-yielding assets shifting focus away from the safe-haven JPY. The trade relations between the US and China also kept a lid on prices. So, investors might shift focus to JPY as a safe haven asset. The bullish side was supported by increasing demand for higher risky assets. US stocks rose on the hope that the Fed would cut rates to stimulate the economy. This news kicked off the carry trade. Thus, investors borrowing from Japan's banks, sell JPY and buy USD to invest in the US stock market. US Treasury yields fell after the US government said the economy added fewer jobs than anticipated during the month of May 2019. The 10-year Treasury yield dropped below 2.06%, its lowest since September 2017. Additionally, market expectations for a Fed rate cut in June rose to 27.5% from 16.7% after dismal US nonfarm payrolls, according to the CME Group's Fed Watch tool. The market is also assessing the chance of a rate cut by July at 79% or so. The major US equity indexes posted strong gains last week as weaker than expected economic data increased the likelihood of easing monetary policy by the Federal Reserve. Today US PPI report is going to be published. Factory inflation is expected to edge down to 0.1% from the previous value of 0.2% and Core PPI is expected to inch up to 0.2% from the previous value of 0.1%. Tomorrow, the US us due to present CPI reports which are also expected to show negative readings. On the other hand, the most important concern for the BOJ is to maintain the Price Stability and Financial Stability such as the persistent low-interest rates can change the risk-taking behavior of financial institutions. The economic data from Japan created a mixed market sentiment. Q1 GDP expanded to 0.6% on a quarterly basis, thus bringing an annualized rate to 2.2% from 0.5%. Bank Lending in May rose more than the forecast up by 2.6% when compared to the previous month's value of 2.4%. The industrial production revealed as shown improvement along with the unemployment data, but the consumer confidence and retail sales showed some weakness. Today Japanese M2 Money Stock report was published with an increase to 2.7% from the previous value of 2.5% which was expected to be at 2.6% and Prelim Machinery Tools Orders also showed an increase to -27.3% from the previous value of -33.4%. Meanwhile, JPY has managed to maintain and sustain the gains over USD because of better fundamentals attracting greater market sentiment. Though JPY could face correctional weakness versus USD, JPY is expected to hold the upper hand over USD further in the coming days. Now let us look at the technical view. The price has been consolidating under high volatility at near 108.50 with a daily close. Today, the price showed certain upward pressure but it is expected to be short-lived. With confluence to the dynamic resistance of 20 EMA, the price is expected to push lower towards 105.00 support area in the coming days.
|


| You are subscribed to email updates from Forex analysis review. To stop receiving these emails, you may unsubscribe now. | Email delivery powered by Google |
| Google, 1600 Amphitheatre Parkway, Mountain View, CA 94043, United States | |
No comments:
Post a Comment